Observational Study
. 2021 Aug 23;6(16):e145495.
doi: 10.1172/jci.insight.145495.

Obesity and diabetes are major risk factors for epicardial adipose tissue inflammation

Affiliations
Observational Study

Obesity and diabetes are major risk factors for epicardial adipose tissue inflammation

Vishal Vyas et al. JCI Insight. .

Abstract

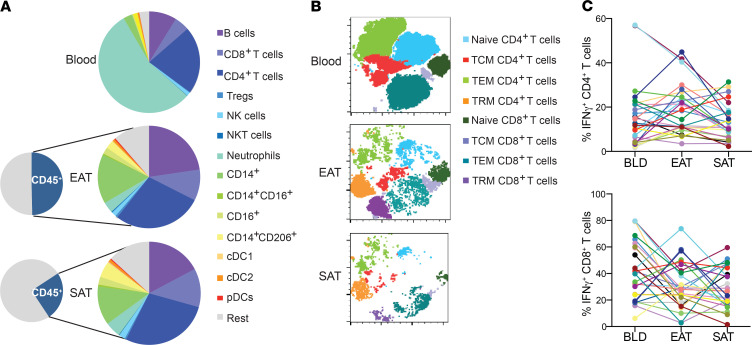
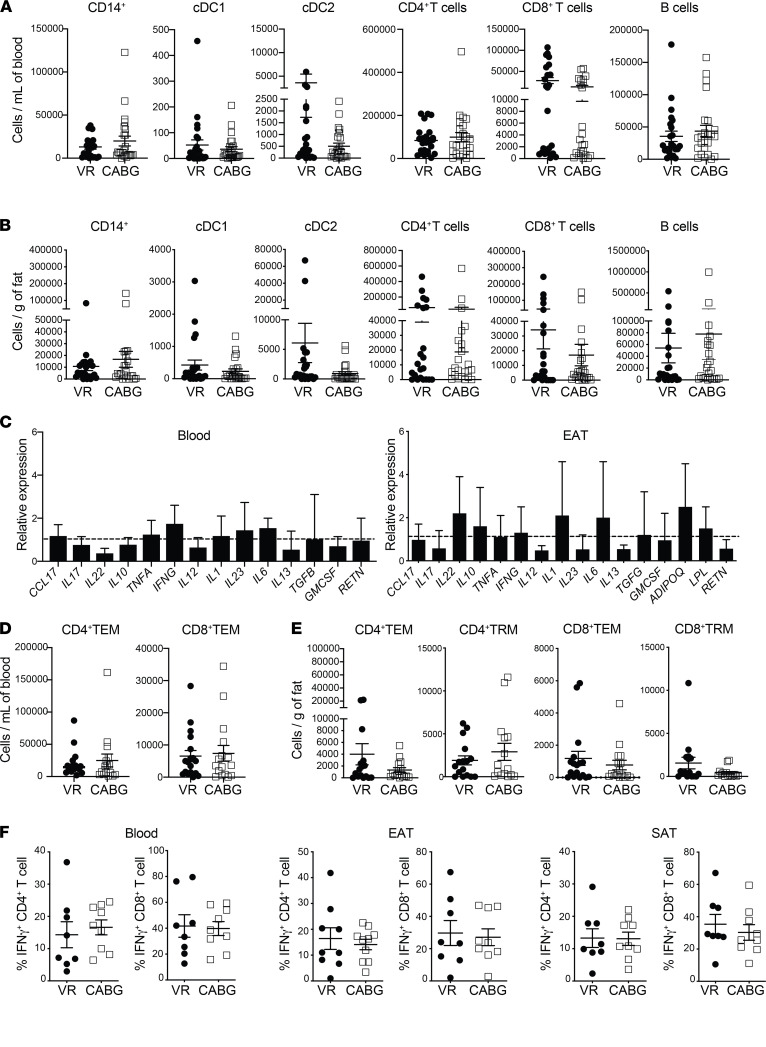
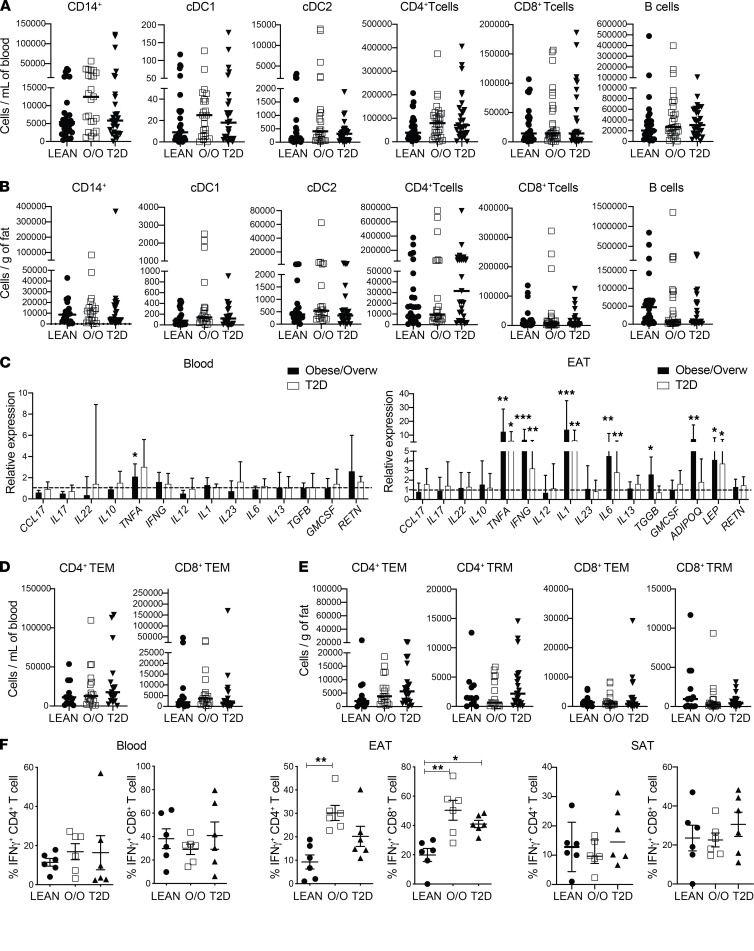
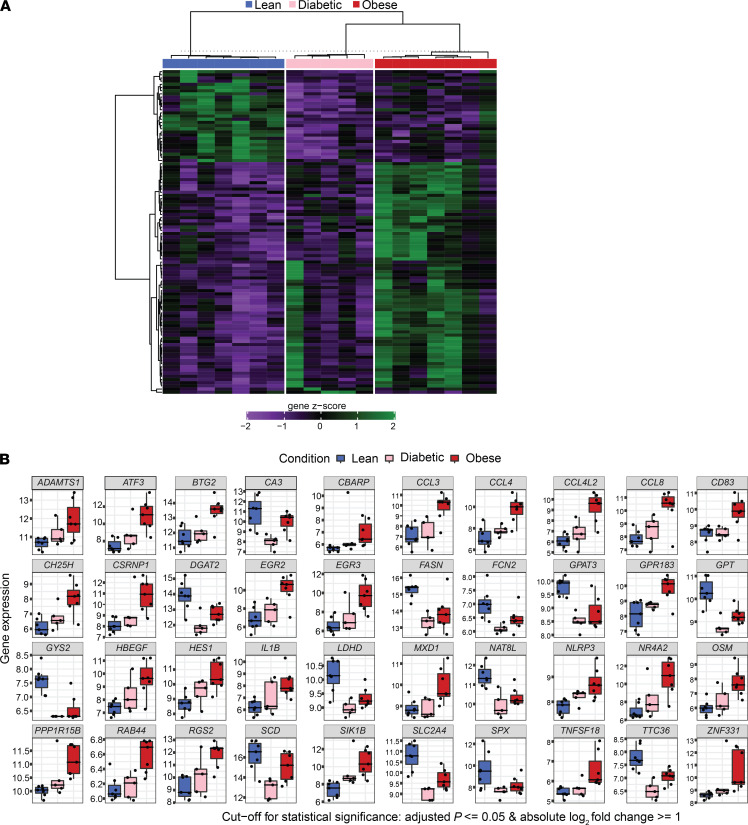
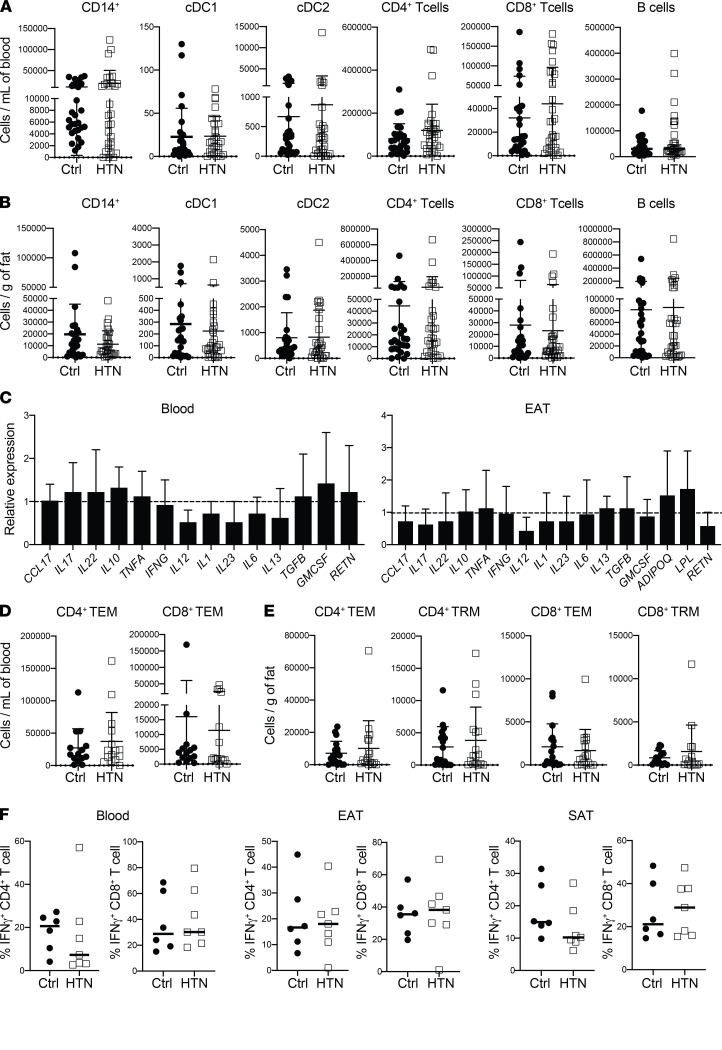
BACKGROUNDEpicardial adipose tissue (EAT) directly overlies the myocardium, with changes in its morphology and volume associated with myriad cardiovascular and metabolic diseases. However, EAT's immune structure and cellular characterization remain incompletely described. We aimed to define the immune phenotype of EAT in humans and compare such profiles across lean, obese, and diabetic patients.METHODSWe recruited 152 patients undergoing open-chest coronary artery bypass grafting (CABG), valve repair/replacement (VR) surgery, or combined CABG/VR. Patients' clinical and biochemical data and EAT, subcutaneous adipose tissue (SAT), and preoperative blood samples were collected. Immune cell profiling was evaluated by flow cytometry and complemented by gene expression studies of immune mediators. Bulk RNA-Seq was performed in EAT across metabolic profiles to assess whole-transcriptome changes observed in lean, obese, and diabetic groups.RESULTSFlow cytometry analysis demonstrated EAT was highly enriched in adaptive immune (T and B) cells. Although overweight/obese and diabetic patients had similar EAT cellular profiles to lean control patients, the EAT exhibited significantly (P ≤ 0.01) raised expression of immune mediators, including IL-1, IL-6, TNF-α, and IFN-γ. These changes were not observed in SAT or blood. Neither underlying coronary artery disease nor the presence of hypertension significantly altered the immune profiles observed. Bulk RNA-Seq demonstrated significant alterations in metabolic and inflammatory pathways in the EAT of overweight/obese patients compared with lean controls.CONCLUSIONAdaptive immune cells are the predominant immune cell constituent in human EAT and SAT. The presence of underlying cardiometabolic conditions, specifically obesity and diabetes, rather than cardiac disease phenotype appears to alter the inflammatory profile of EAT. Obese states markedly alter EAT metabolic and inflammatory signaling genes, underlining the impact of obesity on the EAT transcriptome profile.FUNDINGBarts Charity MGU0413, Abbott, Medical Research Council MR/T008059/1, and British Heart Foundation FS/13/49/30421 and PG/16/79/32419.

Keywords: Cardiology; Cardiovascular disease; Inflammation; Obesity; T cells.


Figures

Figure 1
Figure 1. CD4+ T cells are the dominant immune population in EAT and SAT.
(A) Pie chart illustrating relative proportions of CD45+ cells from the stromal-vascular fraction across tissues (n = 152). (B) Representative t-SNE plot to cluster different T cell subsets into a 2-dimensional plot across blood, EAT, and SAT. (C) IFN-γ levels produced by T cells in blood, EAT, and SAT (n = 25). Each color line represents the same patient.
Figure 2
Figure 2. Comparison of EAT immune profiling between CAD patients and controls.
(A and B) Absolute number of immune cells in CABG and VR patients across blood (A) and EAT (B) (n = 24 patients/group). (C) Relative expression levels of immune mediators in blood and EAT, respectively (n = 24 patients/group). Expression levels were normalized to GAPDH expression. Bars represent expression in CABG patients compared with VR surgery, which was set at 1 and indicated with dotted lines. Error bars show the geometric mean. (D and E) Graphs showing T cell subsets in blood (D) and EAT (E). (F) IFN-γ production among live CD4+ and CD8+ T cells in blood, EAT, and SAT, respectively (n = 7–8 patients/group). Statistical significance was determined by the Mann-Whitney U test, and data are represented as median and interquartile range.
Figure 3
Figure 3. Comparison of EAT immune profiling between obese/overweight and T2D patients and controls.
(A and B) Absolute number of immune cells in overweight/obesity (O/O) and T2D patients across blood (A) and EAT (B) (n = 30 patients/group). (C) Relative expression of immune mediators in overweight/obesity and T2D patients compared with lean nondiabetic patients across blood and EAT (n = 30 patients/group). Gene expression was normalized to GAPDH and control set as 1, indicated with dotted lines. Error bars show the geometric mean. (D and E) Graphs showing T cell subsets in blood (D) and (E) EAT. (F) IFN-γ production among live CD4+ and CD8+ T cells in blood, EAT, and SAT, respectively (n = 6 patients/group). Statistical significance was determined by the Kruskal-Wallis test with Dunn’s multiple comparisons posttest correction applied. Significance denoted as *P < 0.05, **P < 0.005, ***P < 0.0005, and data are represented as median and interquartile range.
Figure 4
Figure 4. Differentially expressed genes in EAT from obese/overweight and T2D patients compared with lean.
(A) Heatmap of differentially expressed genes in EAT, cutoff: adjusted P < 0.05; log2 fold change > 1. (B) Bars represent gene expression value for the top 40 differentially expressed genes in all 3 groups.
Figure 5
Figure 5. Comparison of EAT immune profiling between hypertensive patients and controls.
(A and B) Absolute number of immune cells in hypertensive and control patients across blood (A) and EAT (B) (n = 32 patients/group). (C) Relative expression of immune mediators in hypertensive versus control patients across blood and EAT (n = 32 patients/group). Gene expression was normalized to GAPDH and control set as 1, indicated with dotted lines. Error bars show the geometric mean. (D and E) Graphs showing T cell subsets in blood (D) and EAT (E). (F) Graphs represent IFN-γ production among live CD4+ and CD8+ T cells in blood, EAT, and SAT, respectively (n = 6 patients/group). Statistical significance was determined by Mann-Whitney U test, and data are represented as median and interquartile range.

Similar articles

Cited by

References

    1. Sacks HS, Fain JN. Human epicardial adipose tissue: a review. Am Heart J. 2007;153(6):907–917. doi: 10.1016/j.ahj.2007.03.019. - DOI - PubMed
    1. Ansaldo AM, et al. Epicardial adipose tissue and cardiovascular diseases. Int J Cardiol. 2019;278:254–260. doi: 10.1016/j.ijcard.2018.09.089. - DOI - PubMed
    1. Packer M. Epicardial adipose tissue may mediate deleterious effects of obesity and inflammation on the myocardium. J Am Coll Cardiol. 2018;71(20):2360–2372. doi: 10.1016/j.jacc.2018.03.509. - DOI - PubMed
    1. Song DK, et al. Increased epicardial adipose tissue thickness in type 2 diabetes mellitus and obesity. Diabetes Metab J. 2015;39(5):405–413. doi: 10.4093/dmj.2015.39.5.405. - DOI - PMC - PubMed
    1. Austys D, et al. Epicardial adipose tissue accumulation and essential hypertension in non-obese adults. Medicina (Kaunas) 2019;55(8):456. doi: 10.3390/medicina55080456. - DOI - PMC - PubMed

Publication types

MeSH terms