. 2021 Sep 22;6(18):e151571.
doi: 10.1172/jci.insight.151571.

CD8+PD-L1+CXCR3+ polyfunctional T cell abundances are associated with survival in critical SARS-CoV-2-infected patients

Affiliations

CD8+PD-L1+CXCR3+ polyfunctional T cell abundances are associated with survival in critical SARS-CoV-2-infected patients

Lucille Adam et al. JCI Insight. .

Abstract

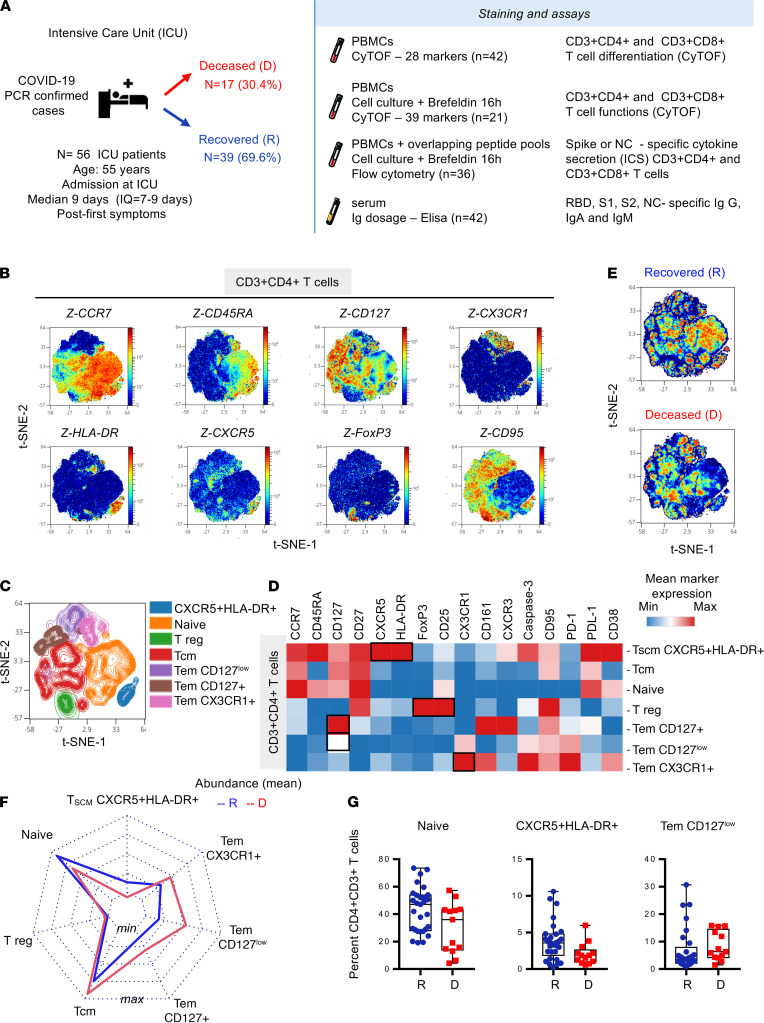
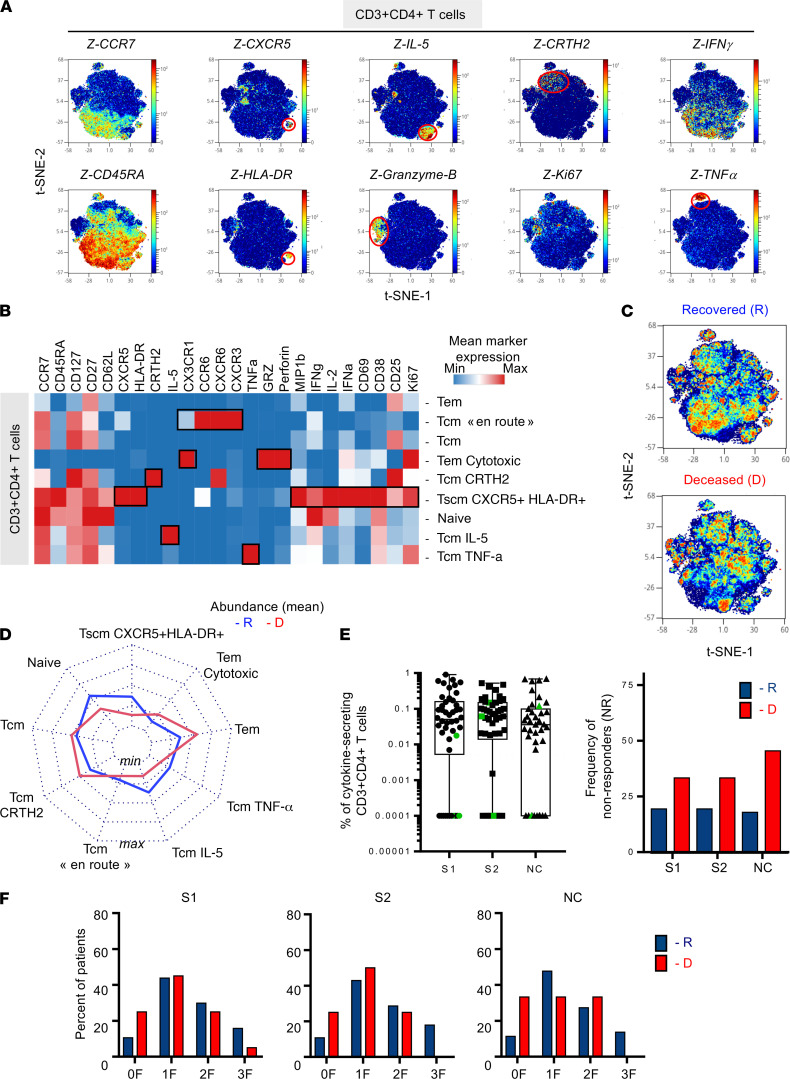
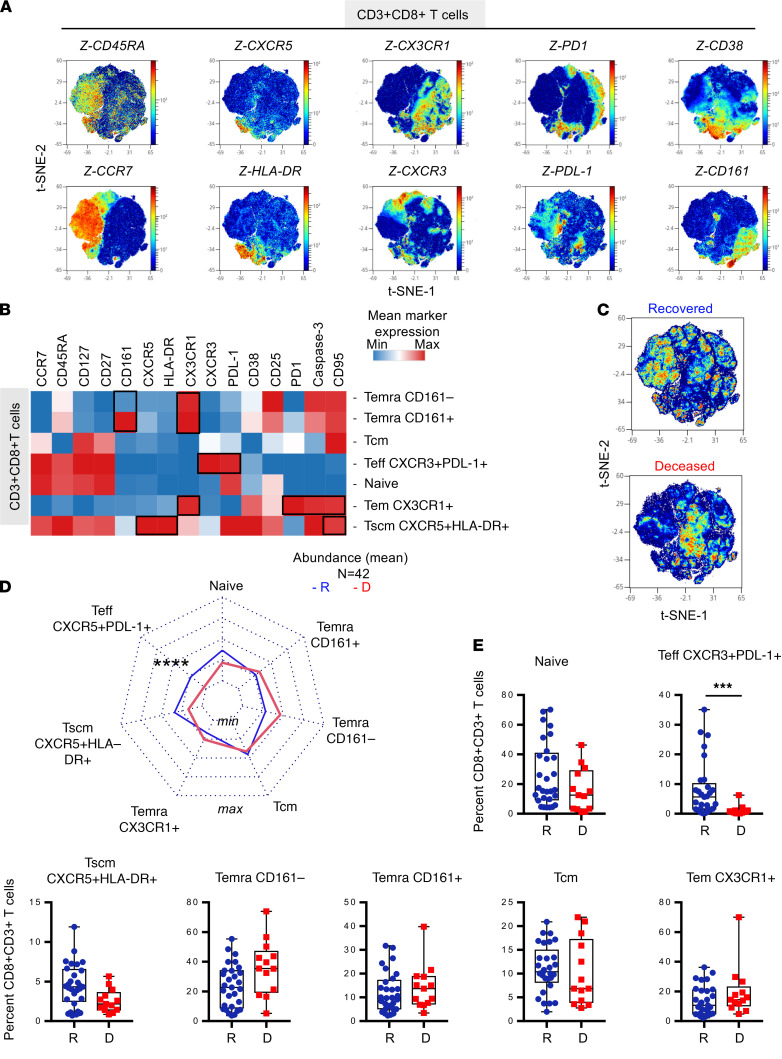
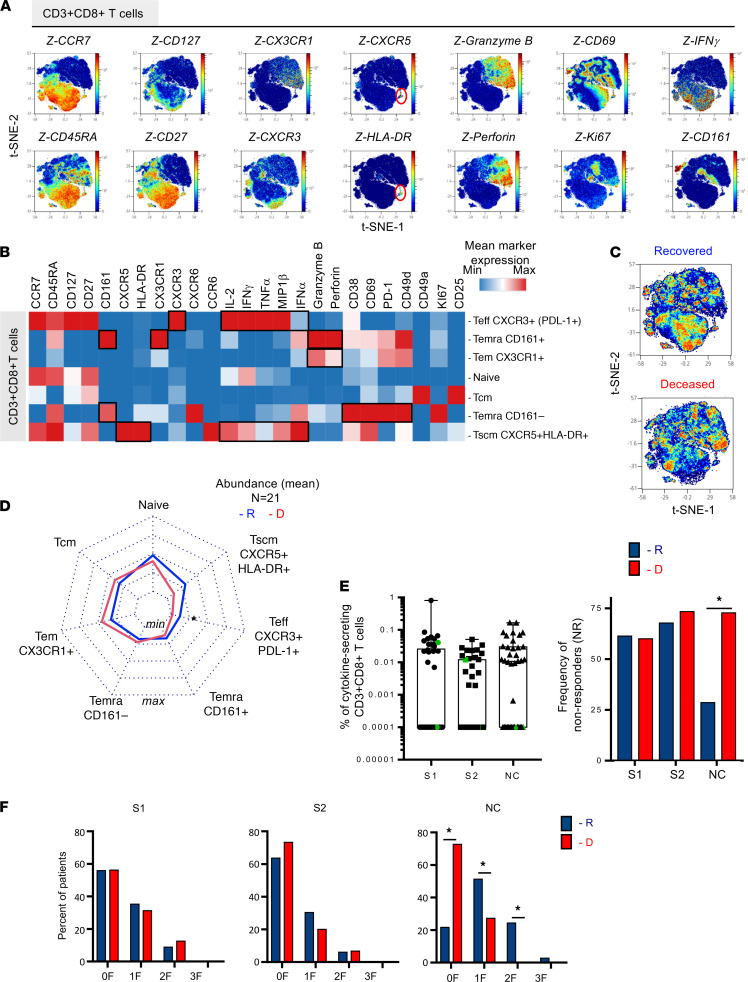
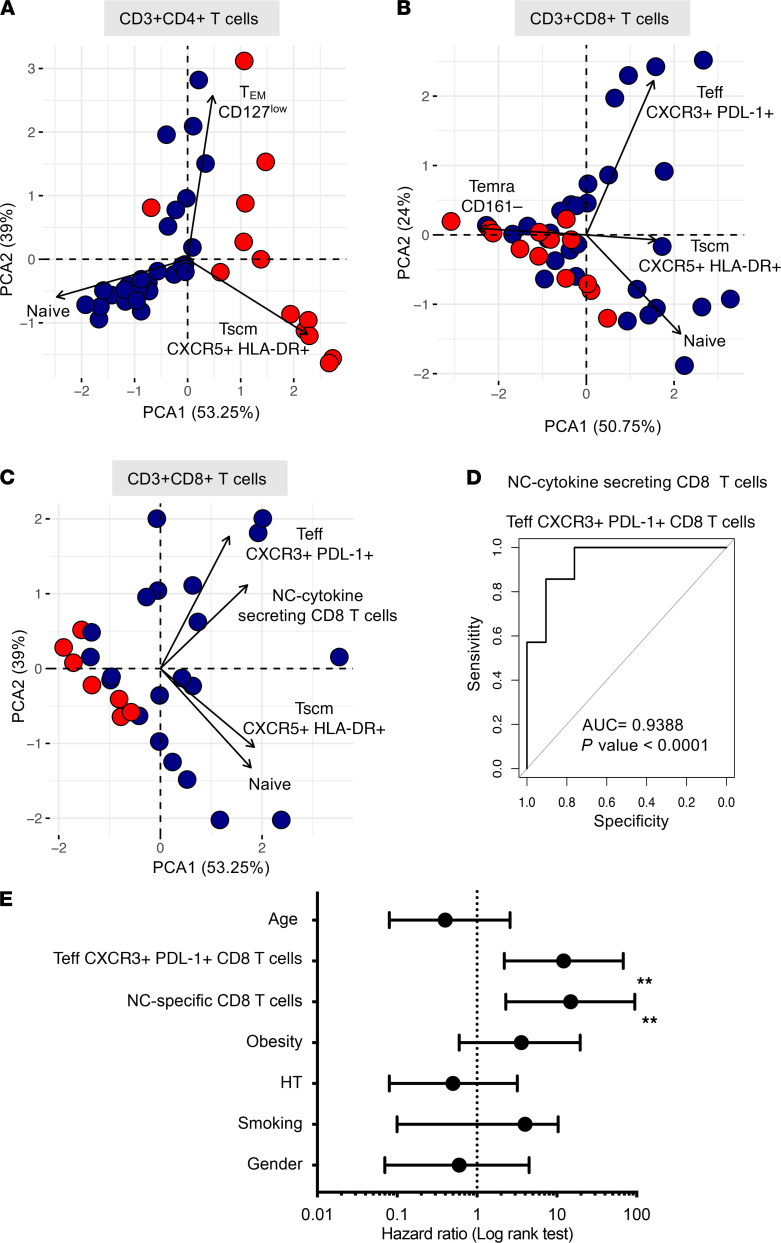
The importance of the adaptive T cell response in the control and resolution of viral infection has been well established. However, the nature of T cell-mediated viral control mechanisms in life-threatening stages of COVID-19 has yet to be determined. The aim of the present study was to determine the function and phenotype of T cell populations associated with survival or death of patients with COVID-19 in intensive care as a result of phenotypic and functional profiling by mass cytometry. Increased frequencies of circulating, polyfunctional CD4+CXCR5+HLA-DR+ stem cell memory T cells (Tscms) and decreased proportions of granzyme B-expressing and perforin-expressing effector memory T cells were detected in recovered and deceased patients, respectively. The higher abundance of polyfunctional PD-L1+CXCR3+CD8+ effector T cells (Teffs), CXCR5+HLA-DR+ Tscms, and anti-nucleocapsid (anti-NC) cytokine-producing T cells permitted us to differentiate between recovered and deceased patients. The results from a principal component analysis show an imbalance in the T cell compartment that allowed for the separation of recovered and deceased patients. The paucity of circulating PD-L1+CXCR3+CD8+ Teffs and NC-specific CD8+ T cells accurately forecasts fatal disease outcome. This study provides insight into the nature of the T cell populations involved in the control of COVID-19 and therefore might impact T cell-based vaccine designs for this infectious disease.

Keywords: Adaptive immunity; Immunology; T cells.


Conflict of interest statement

Conflict of interest: The authors have declared that no conflict of interest exists.

Figures

Figure 1
Figure 1. Increased CXCR5+HLA-DR+CD4+ T cells and decreased Tem subsets outline survival of critical cases with SARS-CoV-2 infection.
(A) Fifty-six patients with confirmed SARS-CoV-2 infection were admitted in ICU at a median of 9 days after symptoms. PBMC samples were collected to assess T cell phenotypes (n = 42, R = 29, D = 13) and expression of effector molecules (n = 21, R = 12, D = 9) using mass cytometry panels 1 and panel 2 (Supplemental Tables 1 and 2, respectively). SARS-CoV-2 peptide–specific, cytokine-producing T cells were analyzed by flow cytometry (S1, S2 n = 46, R = 31 and D = 15; NC n = 39, R = 28 and D = 11). Humoral responses were measured in the serum (n = 42, R = 29, D = 13). CD3+CD4+ T cell (50,000 events) were randomly taken among sample for unsupervised cluster using FlowSOM. (B) Density plot t-SNE representing the expression of indicated markers. (C) Spatial t-SNE representing 7 major clusters as indicated. (D) Heatmap representation of mean signal intensity of each marker in identified CD3+CD4+T cell populations. (E) Density plot t-SNE representing abundance of events using concatenated files of 29 R and 13 D patients. (F) Radar representing mean (min/max normalized) abundance of CD3+CD4+T cell subsets in 29 R (blue) and 13 D (red) patients. (G) Box-and-whisker plots with min and max of CD3+CD4+T cell subset abundances in 29 R (blue) and 13 D (red) patients. All points are shown. Multiple Mann-Whitney U test using Benjamini, Krieger, and Yekutieli FDR correction was performed, with significance set at q < 0.05. R, recovered; D, deceased; Tem, effector memory T cell; tSNE, t-distributed stochastic neighbor embedding.
Figure 2
Figure 2. Increased frequencies of circulating polyfunctional CXCR5+HLA-DR+CD4+ T cells and Tem subsets are associated with survival in patients critically infected with COVID-19.
PBMCs from 21 patients critically ill with COVID-19 were incubated with brefeldin A (16 hours) and stained using multiparametric mass cytometry panel 2 (n = 21, R = 12, D = 9). (A) CD3+CD4+ T cells (20,000 subsampling events) were randomly taken for unsupervised cluster using FlowSOM. Density plot t-SNE represents the expression of indicated markers. (B) Heatmap representation of mean signal intensity of each marker in CD3+CD4+T cells. (C) Density plot t-SNE representing abundance of events using concatenated files of 12 R and 9 D patients. (D) Radar representing mean (min/max normalized) abundances of CD3+CD4+ T cell subsets in 12 R (blue) and 9 D (red) patients. Multiple Mann-Whitney U test using Benjamini, Krieger, and Yekutieli FDR correction was performed, with significance set at q < 0.05. (E) SARS-CoV-2–specific T cell responses were measured in PBMCs from 46 ICU patients on day 15 ± 0.85 (mean ± SEM) after symptoms onset. PBMCs were stimulated for 16 hours with SARS-CoV-2 overlapping peptides: S1, S2, and NC. The frequency of specific CD4+T cells (Boolean gating of IFN-γ, IL-2, and TNF-α) is represented with box-and-whisker plots (min to max) after background subtraction according to background control (left). Color-coded (green) symbols represent individuals that were under immunosuppressive treatment when SARS-CoV-2–specific responses were studied. The frequency of nonresponders (with <0.005% cytokine-secreting CD3+CD4+ T cells) is represented among R (blue; S1 and S2 n = 31; NC n = 28) and D (red; S1 and S2 n = 15; NC n = 11) patients (right). (F) Frequency of patients with cells producing cytokines (0, 1, 2, 3 F) after stimulation in R (blue) and D patients (red). χ2 test did not show significance. R, recovered; D, deceased; F, function; Tem, effector memory T cell; tSNE, t-distributed stochastic neighbor embedding; NC, nucleocapsid.
Figure 3
Figure 3. Surviving patients with COVID-19 have increased levels of PD-L1+CXCR3+CD8+ Teffs and CXCR5+HLA-DR+CD8+ Tscms.
PBMC samples were collected to assess T cell phenotypes (n = 42, R = 29, D = 13) using mass cytometry panel 1 (Supplemental Table 1). CD3+CD8+ T cells (50,000 events) were randomly taken among sample for unsupervised cluster using FlowSOM. (A) Density plot t-SNE representing the expression of indicated markers. (B) Heatmap representation of mean signal intensity of each marker in identified CD3+CD8+T cell population. (C) Density plot t-SNE representing abundance of events using concatenated files of 29 R and 13 D patients. (D) Radar representing mean (min/max normalized) abundance of CD3+CD8+T cell subsets in 29 R (blue) and 13 D (red) patients. (E) Box-and-whisker plots with min and max of CD3+CD8+T cell subset abundances in 29 R (blue) and 13 D (red) patients. All points are shown. Multiple Mann-Whitney U test using Benjamini, Krieger, and Yekutieli FDR correction was performed, with significance set at ***P <.001. Teffs, effector T cells; Tscm, stem cell memory T cell; R, recovered; D, deceased.
Figure 4
Figure 4. Abundance of polyfunctional PD-L1+CXCR3+CD8+ T cells and NC-specific, cytokine-producing T cells define survival vs. fatal outcome after critical SARS-CoV-2 infection.
PBMCs from critical patients with COVID-19 were incubated with brefeldin A (16 h) and stained using multiparametric mass cytometry panel 2 (n = 21, R = 12, D = 9). (A) CD3+CD8+ T cell (20,000 events) were randomly taken among sample for unsupervised cluster using FlowSOM. Density plot t-SNE representing the expression of indicated markers. (B) Heatmap representation of mean signal intensity of each marker in CD3+CD8+T cell subsets. (C) Density plot t-SNE representing abundance of events using concatenated files of 12 R and 9 D patients. (D) Radar representing mean (min/max normalized) abundances of CD3+CD4+T cell subsets in 12 R (blue) and 9 D (red) patients. Multiple Mann-Whitney U test using Benjamini, Krieger, and Yekutieli FDR correction was performed, with significance set at adjusted P <.05. (E) SARS-CoV-2–specific T cell responses were measured in PBMCs from 46 ICU patients on day 15 ± 0.85 (mean ± SEM) after symptom onset. PBMCs were stimulated for 16 hours with SARS-CoV-2 overlapping 15-mer peptides (S1, S2, and NC). The frequency of specific CD8+ T cells (Boolean gating of IFN-γ, IL-2, and/or TNF-α) is represented with box-and-whisker plots (min to max) after background subtraction according to background control (left). Color-code (green) symbols represent individuals that were under immunosuppressive treatment when SARS-CoV-2–specific responses were studied. Individuals were considered responders when the frequency of cytokines produced was >0.005% of CD3+CD8+ cells. The frequency of nonresponders is represented among R (blue, S1 and S2: n = 31; NC n = 28) and D (red, S1 and S2 n = 15; NC n = 11) patients (right). χ2 test was performed, with significance set at *P < 0.05. (F) Frequency of patients with detectable cells producing cytokines (0, 1, 2, 3 F) after stimulation in R (blue) and D patients (red). χ2 test was performed, with significance set at *P < 0.05. R, recovered; D, deceased; NC, nucleocapsid; F, function.
Figure 5
Figure 5. PCA of T cell frequencies discriminate survival and decreased ICU patients after critical SARS-CoV-2 infection.
PCA representations (R software) are as follows: (A) CD4+ T cell subset abundance and (B) CD8+ T cell subset abundance as indicated, and (C) CD8+ T cell subsets as indicated and frequency of NC-specific CD8+ T cells. Color code indicates patients who recovered (blue) and patients who deceased (red). (D) ROC curve (R software) modeling the abundance of PD-L1+CXCR3+ Teffs and NC-specific CD8+ T cells in disease survival or death outcomes. AUC = 0.9388, P < 0.001. (E) Forest plots comparing HR (Mantel-Haenszel) for death in 28 patients according to the abundance of PD-L1+CXCR3+ Teffs and NC-specific CD8+ T cells. Log rank (Mantel–Cox) test was used to compare HR between groups, with significance defined by a **P < 0.001. PCA, principal component analysis; ROC, receiver operating characteristic; NC, nucleocapsid; Teffs, effector T cells.

References

    1. Huang C, et al. Clinical features of patients infected with 2019 novel coronavirus in Wuhan, China. Lancet. 2020;395(10223):497–506. doi: 10.1016/S0140-6736(20)30183-5. - DOI - PMC - PubMed
    1. Chen G, et al. Clinical and immunological features of severe and moderate coronavirus disease 2019. J Clin Invest. 2020;130(5):2620–2629. doi: 10.1172/JCI137244. - DOI - PMC - PubMed
    1. Verity R, et al. Estimates of the severity of coronavirus disease 2019: a model-based analysis. Lancet Infect Dis. 2020;20(6):669–677. doi: 10.1016/S1473-3099(20)30243-7. - DOI - PMC - PubMed
    1. Pedersen SF, Ho Y-C. SARS-CoV-2: a storm is raging. J Clin Invest. 2020;130(5):2202–2205. doi: 10.1172/JCI137647. - DOI - PMC - PubMed
    1. Wen W, et al. Immune cell profiling of COVID-19 patients in the recovery stage by single-cell sequencing. Cell Discov. 2020;6(1):31. doi: 10.1038/s41421-020-0168-9. - DOI - PMC - PubMed

Publication types