. 2021 Jul;18(180):20210164.
doi: 10.1098/rsif.2021.0164. Epub 2021 Jul 21.

SARS-CoV-2 screening: effectiveness and risk of increasing transmission

Affiliations

SARS-CoV-2 screening: effectiveness and risk of increasing transmission

Jordan P Skittrall. J R Soc Interface. 2021 Jul.

Abstract

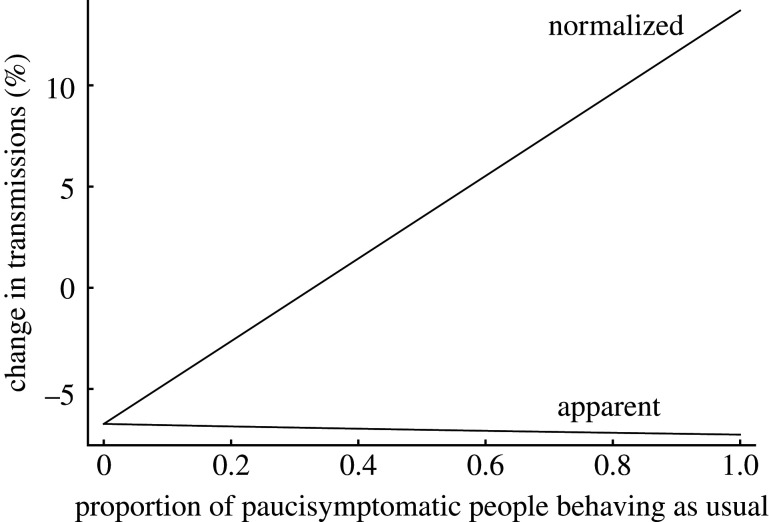
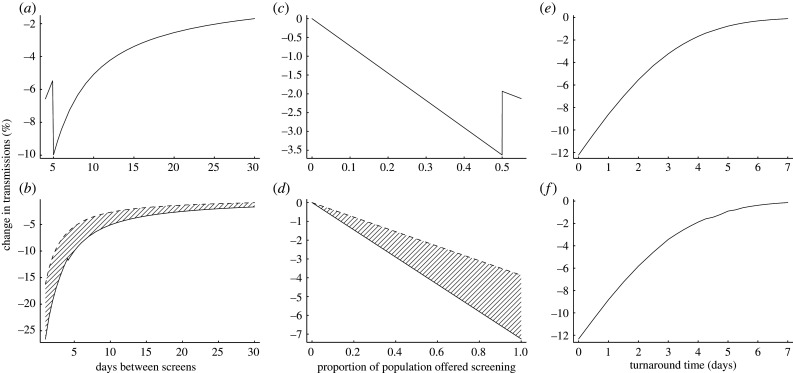
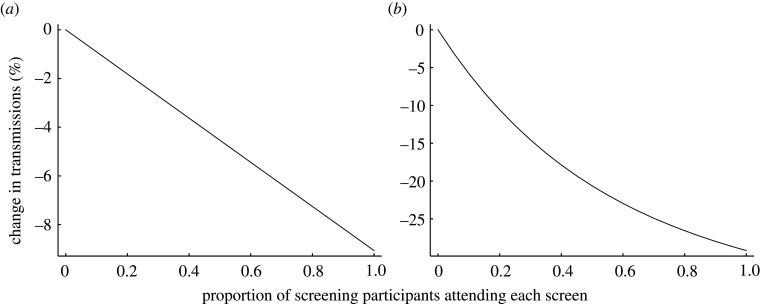
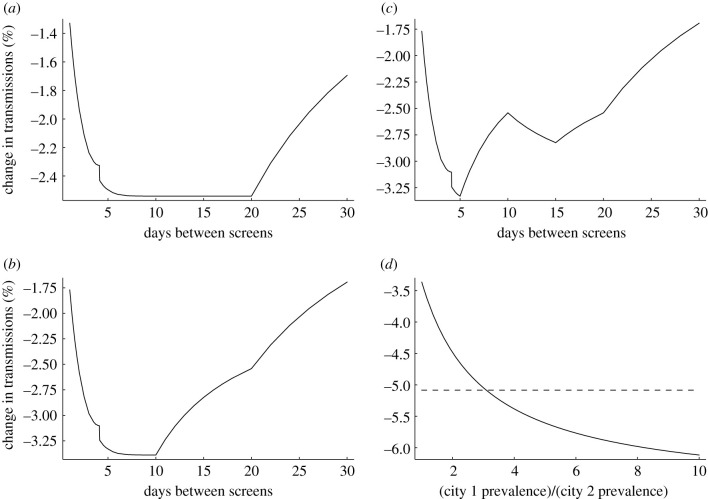
Testing asymptomatic people for SARS-CoV-2 aims to reduce COVID-19 transmission. Screening programmes' effectiveness depends upon testing strategy, sample handling logistics, test sensitivity and individual behaviour, in addition to dynamics of viral transmission. The interaction between these factors is not fully characterized. We investigated the interaction between these factors to determine how to optimize reduction of transmission. We estimate that under idealistic assumptions 70% of transmission may be averted, but under realistic assumptions only 7% may be averted. We show that programmes that overwhelm laboratory capacity or reduce isolation of those with minor symptoms have increased transmission compared with those that do not: programmes need to be designed to avoid these issues, or they will be ineffective or even counter-productive. Our model allows optimal selection of whom to test, quantifies the balance between accuracy and timeliness, and quantifies potential impacts of behavioural interventions. We anticipate our model can be used to understand optimal screening strategies for other infectious diseases with substantially different dynamics.

Keywords: COVID-19 pandemic; SARS-CoV-2; infection transmission; mass screening.


Figures

Figure 1.
Figure 1.
Behaviour changes in people with minor symptoms may negate the effect of screening. Model output where the proportion of those developing minor symptoms (paucisymptomatic people) behaving as usual, rather than isolating, is varied from 0 to 1, with parameters otherwise as in our realistic scenario. There are two ways of viewing the effect of screening. Firstly, one can just consider the effect of screening and isolation itself, so that as fewer people isolate before being screened, there are more transmissions to interrupt and so screening appears to stop more transmissions (‘apparent’ change in transmissions line, with number of transmissions in absence of screening as denominator, showing estimated change in transmissions varying from −6.7% when all paucisymptomatic people isolate, to −7.3% when all paucisymptomatic people behave as usual). Secondly, one can consider changes in behaviour also to be part of the impact of screening: in this case, the effect is the change in transmissions caused by an increase in the proportion of paucisymptomatic people behaving as usual from a fixed proportion (which we define to be zero, i.e. all paucisymptomatic people isolating) and then screening and isolation of those not already isolating (‘normalized’ change in transmissions line, with number of transmissions in the absence of screening when all paucisymptomatic people isolate as denominator, showing estimated change in transmissions varying from −6.7% when all paucisymptomatic people continue to isolate, to +13.7% when all paucisymptomatic people behave as usual). The combined effect is at best a reduced effectiveness in screening, and at worst an increase in the number of transmissions. (Note that the figure can be redrawn with the ‘normalized’ line representing the change from a different fixed proportion of paucisymptomatic people behaving as usual prior to the introduction of screening, but that as long as screening causes the proportion to increase, the overall result will still hold.)
Figure 2.
Figure 2.
Turnaround time strongly impacts the success of screening. (a) Impact on transmissions of shortening the interval between screening tests, until, at a 5-day interval, testing capacity is overwhelmed with an impact on turnaround time. The increased turnaround time results in delays in isolating infectious people and a drastic loss in ability to prevent transmissions. (b) Comparison (hatched region) between the effects of normal (solid line) and impaired (dashed line) laboratory turnaround times on transmission reduction, for varying screening intervals. (c) Impact on transmissions of offering weekly screening to an increasing population proportion until, at 50%, testing capacity is overwhelmed with an impact on turnaround time. As in (a), the resultant delays to isolation cause a drastic loss in ability to prevent transmissions. (d) Comparison (hatched region) between the effects of normal (solid line) and impaired (dashed line) laboratory turnaround times on transmission reduction, for varying proportions of the population offered screening. (e) Impact of turnaround time on transmission reduction. Here, rather than being a distribution, total turnaround time from sampling to action on a positive result takes a single value, which is varied. (f) As (e) but using reported RNA detection rates from the literature [8] rather than assuming the probability of detection scales with infectiousness. This shows the results are not an artefact of assuming detecting infection is more likely in more infectious individuals. Our realistic model parameters are used where not otherwise stated.
Figure 3.
Figure 3.
Diminishing returns with increased uptake for short screening intervals. Model output showing change in transmissions as the proportion of those who attend each offered screen (from those who engage in screening at least once) changes. (a) Weekly screening interval. (b) Daily screening interval. Model parameters are set as for our realistic scenario, except for the proportions attending each screening, and the screening interval in (b).
Figure 4.
Figure 4.
Screening in more complex scenarios. (a) Scenario where testing capacity is sufficient to offer screening to the whole population every 20 days (taking non-attendance into account), and offering of tests is managed so as not to exceed capacity (a smaller proportion of the population is screened if testing is offered more frequently than every 20 days). The proportion/frequency combination does not affect testing impact, except at the extremes where tests are not all used on potentially infected individuals (right-hand side of plot: testing frequency is so low that some tests are unused; left-hand side of plot: testing frequency is so high that some people offered tests have already tested positive and isolated in a preceding testing round). Note that the very small discontinuity of approximately 0.1% near the 4-day interval in this and subsequent panels is a numerical artefact arising from the code implementation of the calculation; there is no reason to expect such a discontinuity in a real-world setting. (b) As (a) but with the population structured: half the population has twice the risk of being infected as the other half of the population. The higher risk portion of the population is prioritized for screening, with leftover tests at the chosen screening rate offered to the lower risk portion. In this scenario, the greatest reduction in transmissions occurs when all tests are offered to the high risk portion. (c) As (b) but half of each portion of the population are healthcare workers in contact with vulnerable patients, so are always screened before others, i.e. the screening priority is higher rate healthcare workers, lower rate healthcare workers, higher rate others, lower rate others. Screening all those in contact with the vulnerable more often (10 day screening interval) is possible at a cost of reduced efficacy of screening in the overall population. (d) Scenario in which there are two identical cities with two identical laboratories (realistic testing scenario), save that the first city has an infection prevalence greater than the second city. Laboratory capacity is sufficient to offer screening to everybody every 10 days. Each city’s laboratory can be used separately to offer screening to its local population (dashed line). Alternatively, both laboratories can be used to screen every 5 days those in the city with higher infection prevalence, but with an additional two-day turnaround delay for samples sent between cities (solid line). The more effective strategy depends upon relative infection rates in the two cities.

Similar articles

Cited by

References

    1. Rivett L et al. 2020. Screening of healthcare workers for SARS-CoV-2 highlights the role of asymptomatic carriage in COVID-19 transmission. eLife 9, e58728. (10.7554/eLife.58728) - DOI - PMC - PubMed
    1. Dora AV, Winnett A, Jatt LP, Davar K, Watanabe M, Sohn L, Kern HS, Graber CJ, Goetz MB. 2020. Universal and serial laboratory testing for SARS-CoV-2 at a long-term care skilled nursing facility for veterans—Los Angeles, California, 2020. MMWR Morb. Mortal. Wkly Rep. 69, 651-655. (10.15585/mmwr.mm6921e1) - DOI - PMC - PubMed
    1. Njuguna H et al. 2020. Serial laboratory testing for SARS-CoV-2 infection among incarcerated and detained persons in a correctional and detention facility—Louisiana, April–May 2020. MMWR Morb. Mortal Wkly Rep. 69, 836-840. (10.15585/mmwr.mm6926e2) - DOI - PMC - PubMed
    1. Kissler SM et al. 2020. Viral dynamics of SARS-CoV-2 infection and the predictive value of repeat testing. medRxiv. (10.1101/2020.10.21.20217042) - DOI
    1. Lavezzo E et al. 2020. Suppression of a SARS-CoV-2 outbreak in the Italian municipality of Vo’. Nature 584, 425-429. (10.1038/s41586-020-2488-1) - DOI - PubMed

Publication types