. 2021 Aug 10;54(8):1715-1727.e7.
doi: 10.1016/j.immuni.2021.06.014. Epub 2021 Jul 21.

Pannexin 1 channels facilitate communication between T cells to restrict the severity of airway inflammation

Affiliations

Pannexin 1 channels facilitate communication between T cells to restrict the severity of airway inflammation

Christopher B Medina et al. Immunity. .

Abstract

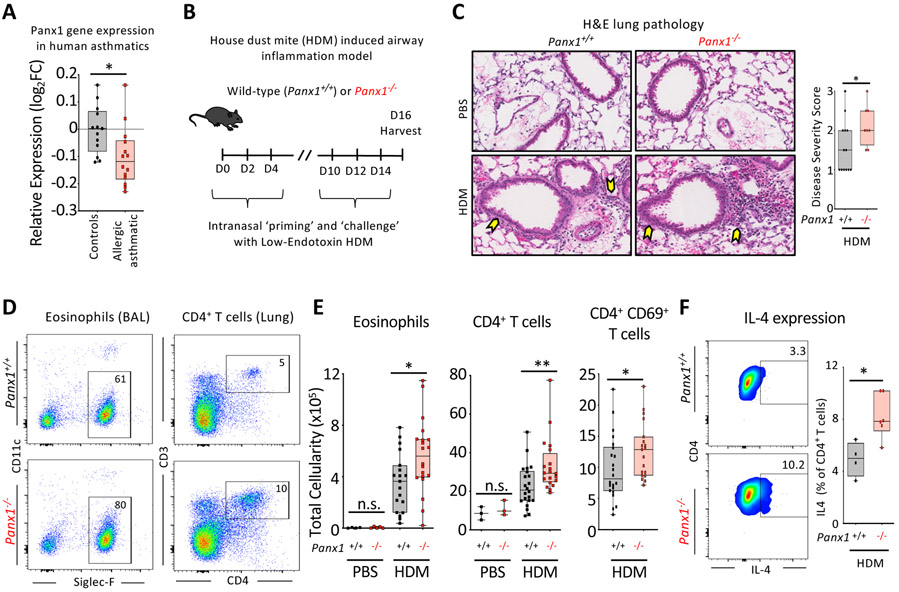
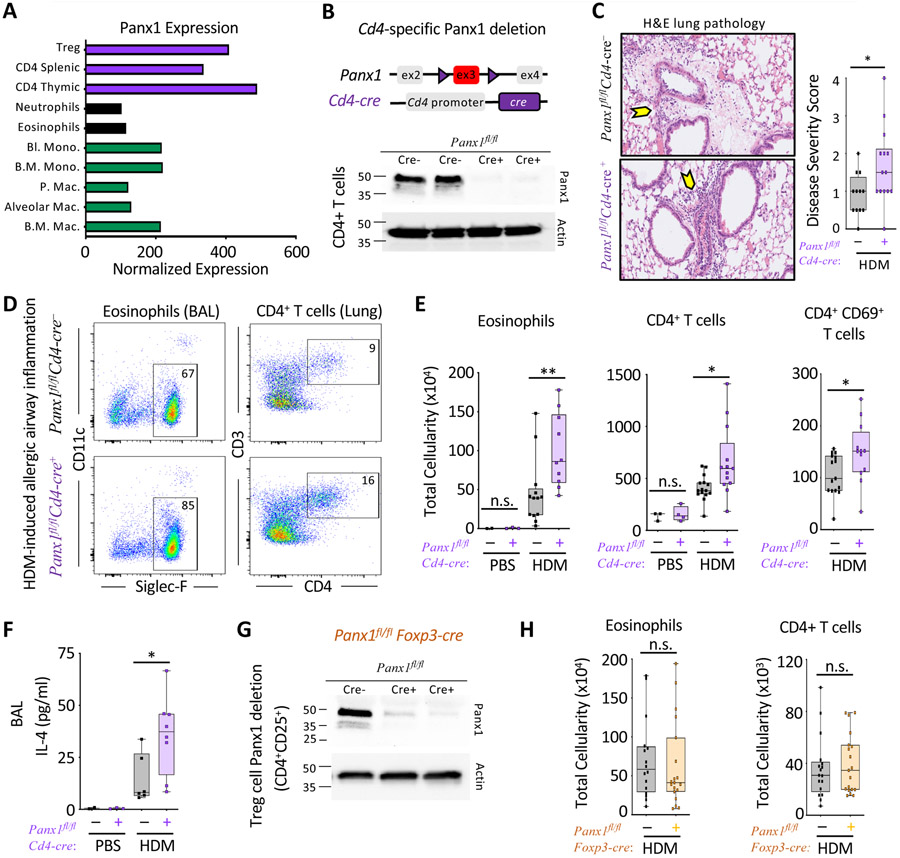
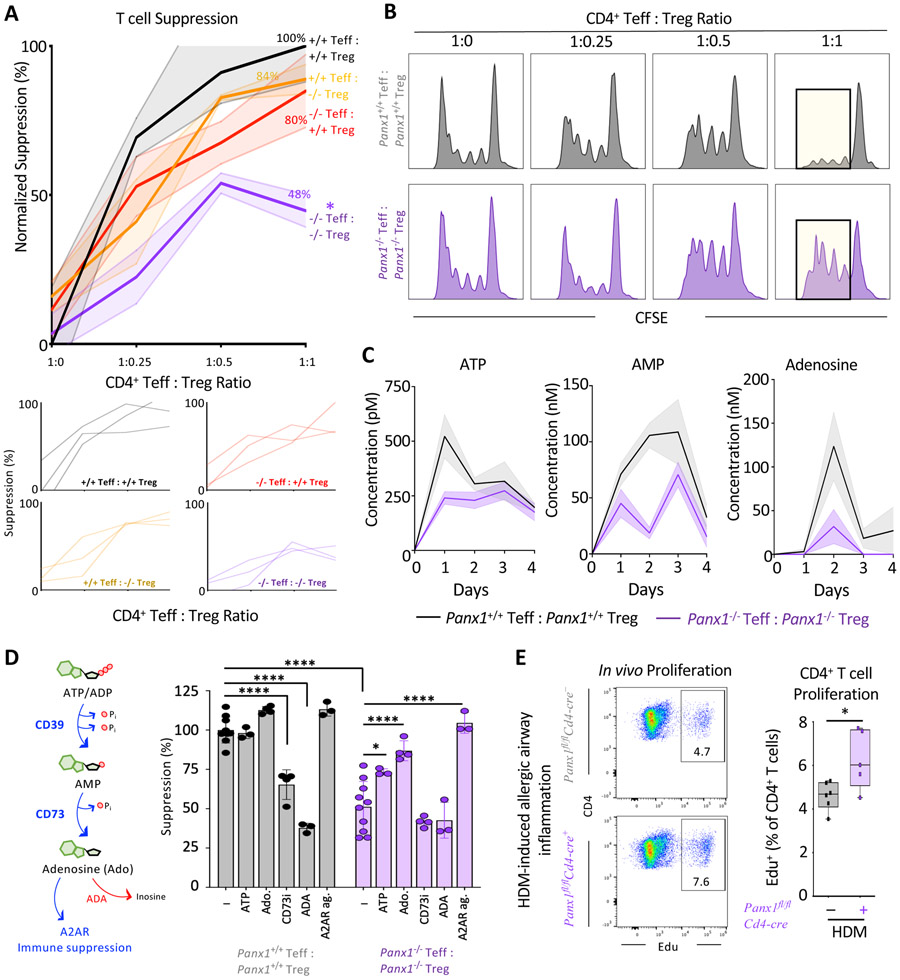
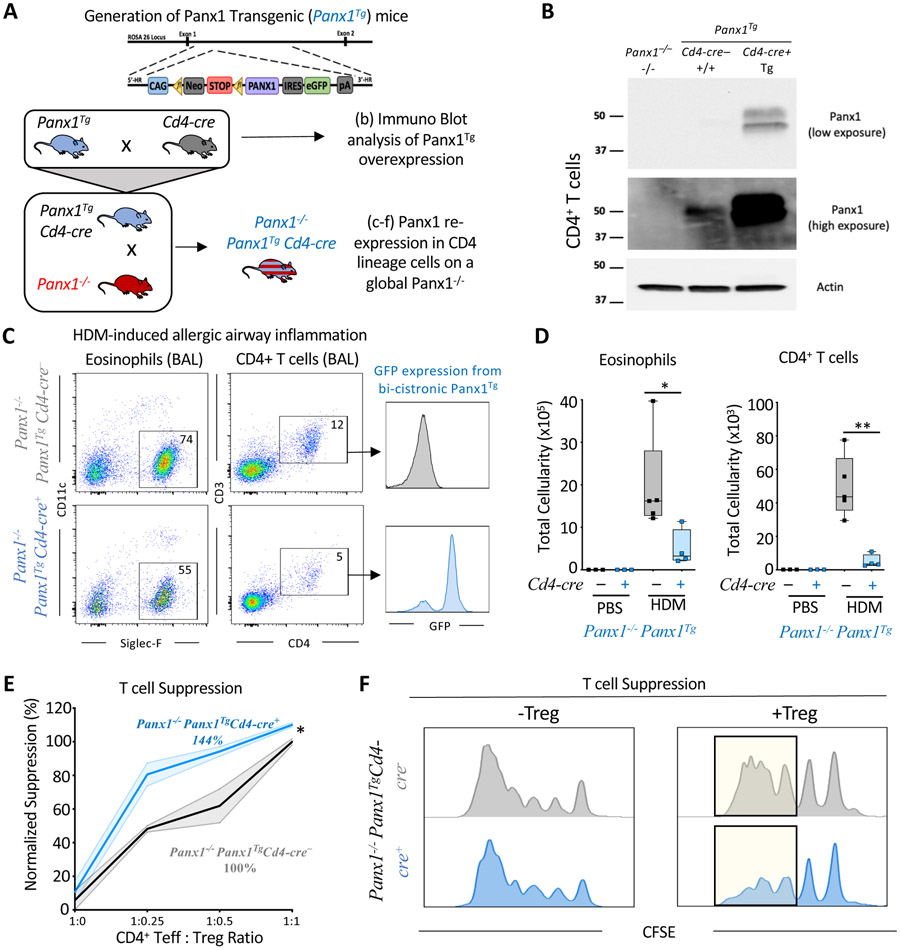
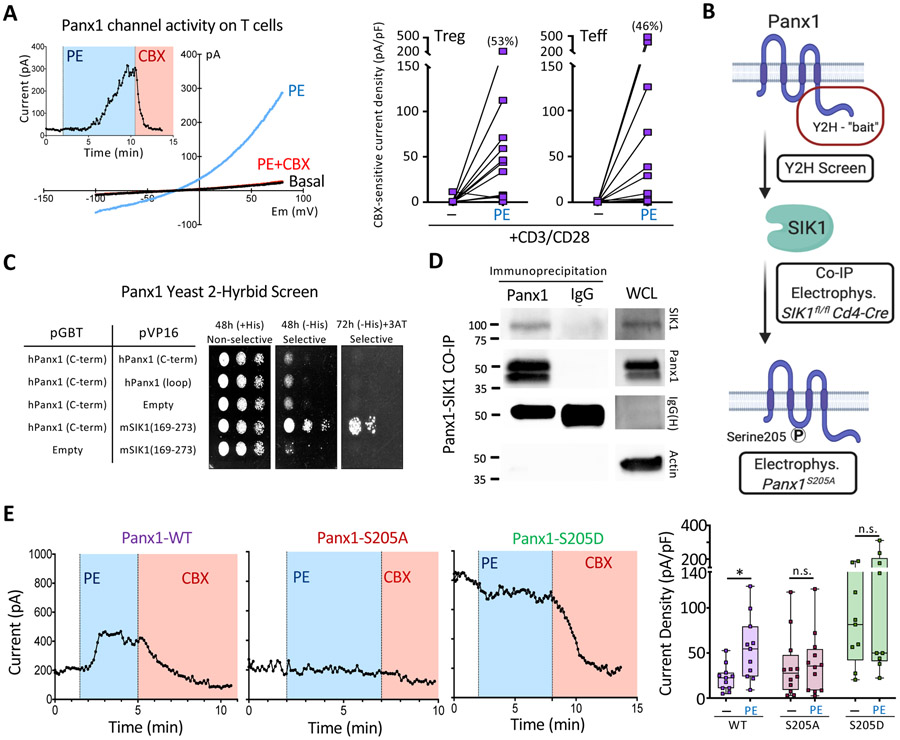
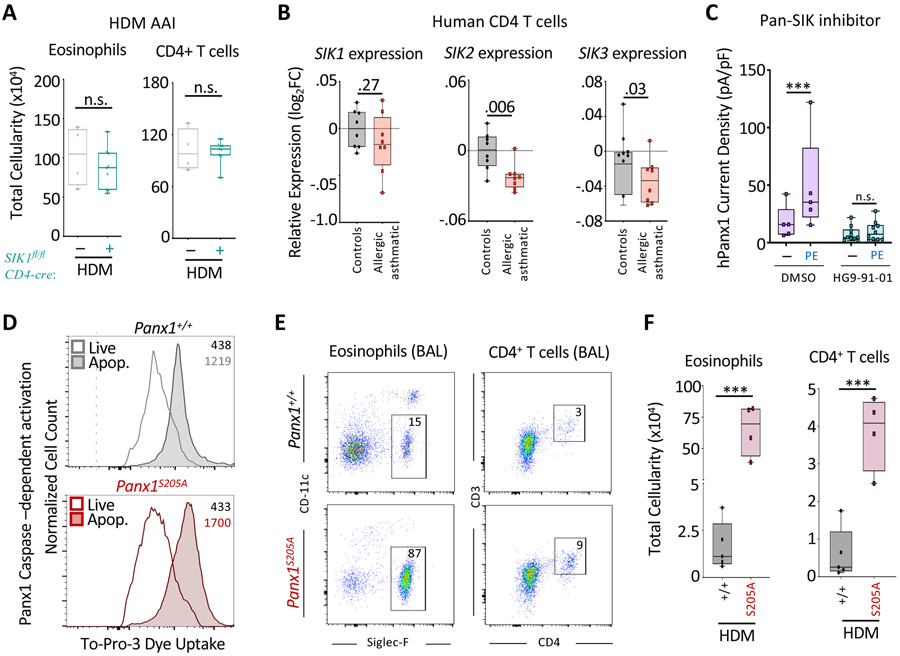
Allergic airway inflammation is driven by type-2 CD4+ T cell inflammatory responses. We uncover an immunoregulatory role for the nucleotide release channel, Panx1, in T cell crosstalk during airway disease. Inverse correlations between Panx1 and asthmatics and our mouse models revealed the necessity, specificity, and sufficiency of Panx1 in T cells to restrict inflammation. Global Panx1-/- mice experienced exacerbated airway inflammation, and T-cell-specific deletion phenocopied Panx1-/- mice. A transgenic designed to re-express Panx1 in T cells reversed disease severity in global Panx1-/- mice. Panx1 activation occurred in pro-inflammatory T effector (Teff) and inhibitory T regulatory (Treg) cells and mediated the extracellular-nucleotide-based Treg-Teff crosstalk required for suppression of Teff cell proliferation. Mechanistic studies identified a Salt-inducible kinase-dependent phosphorylation of Panx1 serine 205 important for channel activation. A genetically targeted mouse expressing non-phosphorylatable Panx1S205A phenocopied the exacerbated inflammation in Panx1-/- mice. These data identify Panx1-dependent Treg:Teff cell communication in restricting airway disease.

Keywords: Pannexin 1, extracellular ATP, lung, asthma, airway inflammation, T regulatory cell, T effector cell, Salt-inducible kinase, CD4 T cell, adenosine.


Conflict of interest statement

Declaration of interests The authors declare no competing interests.

Figures

Figure 1.
Figure 1.. Panx1 expression restricts the severity of allergic airway inflammation.
(A) Relative Panx1 expression (log2FC relative to healthy) on peripheral blood mononuclear cells (PBMC) of healthy or allergic asthmatic children (ctrl n=13, a.asthmatics n=14) (*p=0.015), revealing a decrease in Panx1 in asthmatics. (B) Schematic representation of house dust mite (HDM)-induced allergic airway inflammation. (C) H&E lung histology images of wild-type (n=13) and global Panx1−/−(n=8) mice during PBS or HDM challenge. Arrows highlight areas of immune cell infiltration and inflammation. Disease severity score as assessed by a pathologist blinded to the genotypes (*p=0.05). (D) Flow plots showing the extent of eosinophil and CD4+ T cell infiltration into the airways of Panx1+/+ and Panx1−/− mice after HDM-induced airway inflammation. (E) Absolute cellularity of eosinophils (left) (*p=0.017), total CD4+ T cells (middle) (**p=0.008), and activated CD69+ CD4+ T cells (right) (*p=0.033). Each dot represents a mouse. (PBS control– Panx1+/+ n=4, PBS control– Panx1−/− n=5, HDM– Panx1+/+ n=19, HDM– Panx1−/− n=21) and lung (PBS– Panx1+/+ n=3, PBS– Panx1−/− n=3, HDM– Panx1+/+ n=22, HDM– Panx1−/− n=20), respectively, in wild-type (Panx1+/+) and global Panx1−/−. (F) Flow plots showing the percentage of IL4+ CD4+ T cells (left) and quantification (right) during HDM-induced allergic airway inflammation. (Panx1+/+ n=4, Panx1−/−n=6) (*p=0.011). Unpaired Student’s t-test (A,C,E,F). Related to Figure S1.
Figure 2.
Figure 2.. T cell Panx1 expression limits allergic airway inflammation.
(A) Gene expression data from the Immgen database assessing the relative expression of Panx1. (B) Schematic representation of Cd4-cre mediated Panx1 deletion and efficiency of deletion via immunoblot. (C) H&E lung histology images of Panx1fl/fCd4-cre (n=12) and Panx1fl/fCd4-cre+ (n=14) mice during HDM challenge. Arrows highlight areas of immune cell infiltration and inflammation. Disease severity score as assessed by a pathologist blinded to genotypes is shown on the right (*p=0.029). (D) Flow plots showing the extent of eosinophil and CD4+ T cell infiltration into the airways of Panx1fl/fCd4-cre and Panx1fl/fCd4-cre+ mice after HDM-induced airway inflammation. (E, F) Absolute cellularity of eosinophils (left) (**p=0.009), CD4+ T cells (middle) (*p=0.012), activated CD69+ CD4+ T cells (left) (*p=0.032), and BALF IL-4 cytokine concentration (F) (*p=0.034). (PBS–Panx1fl/fCd4-cre n=2, PBS–Panx1fl/fCd4-cre+ n=3, HDM–Panx1fl/fCd4-cre n=13, HDM–Panx1fl/fCd4-cre+ n=11) and lung (PBS–Panx1fl/fCd4-cre n=3, PBS–Panx1fl/fCd4-cre+ n=4, HDM–Panx1fl/fCd4-cre n=15, HDM–Panx1fl/fCd4-cre+ n=13), respectively. (G)Foxp3-cre mediated Panx1 deletion and the efficiency of deletion. (H) Absolute cellularity of eosinophils (left) and CD4+ T cells (right) (Panx1fl/fFoxp3-cre n=17, Panx1fl/fFoxp3-cre+ n=19). Unpaired Student’s t-test (C,E,F). Related to Figure S2 and S3.
Figure 3.
Figure 3.. Panx1 regulates crosstalk between Teff and Treg cells during Treg mediated suppression.
(A) Quantitative analysis of suppression across the four different cellular combinations (n=3) (*p=0.047) (top). Individual experimental line plots demonstrating the extent of suppression across Teff:Treg cell ratios (bottom). (B) Histograms of combinatorial suppression assays with wild type and Panx1−/− Teff and Treg cells at indicated cell ratios. (C) Concentrations of extracellular ATP, AMP, and adenosine over time during suppression assays with wild-type or Panx1−/− T cells. (D) Schematic of conversion of ATP to adenosine by CD39 and CD73 mediated enzymatic reactions and adenosine actions on the A2AR. Conversion of adenosine to inosine with ADA treatment. ATP supplementation, adenosine supplementation, CD73 inhibition, ADA treatment, and A2AR agonist during wild-type or Panx1−/− T cell suppression assays (1:1 Teff:Treg ratio) (n=3-10) (****p<0.0001, *p<0.05). (E) Flow plots and quantification of in vivo T cell proliferation using Edu incorporation during allergic airway inflammation in Panx1fl/fCd4-cre+ mice (n=5) and wild-type littermate controls (n=6) (*p=0.028). Data are mean ± s.e.m. Two-way ANOVA (A), One-way ANOVA (D), Unpaired Student’s t-test (E). Related to Figure S4.
Figure 4.
Figure 4.. T cell specific rescue of Panx1 expression dampens airway inflammation.
(A) Schematic representation for the generation of Panx1Tg mice and the Cd4-cre mediated Panx1 transgene re-expression in the global Panx1−/− mice. (B) Immuno blot validation of Panx1 over-expression in CD4+ T cells by crossing the Panx1Tg mice to Cd4-cre mice and assessing Panx1 protein from isolated splenic CD4+ T cells. Actin expression was used as a loading control. The Panx1 expression is shown in two different exposures. (C, D) Flow plots for eosinophil and CD4+ T cell infiltration into the bronchoalveolar space. The T cells infiltrating into the lungs were GFP positive only in the Panx1−/− Panx1TgCd4-cre+ condition (C). Absolute cellularity of eosinophils (*p=0.048) (left) and CD4+ T cells (**p=0.002) (right) (D). (Panx1−/−Panx1TgCd4-cre n=5, Panx1−/−Panx1TgCd4-cre+ n=4) in PBS and HDM-treated mice. (E, F) Quantitative analysis of T cell suppression assays between Panx1−/−Panx1TgCd4-cre (n=3) and Panx1−/− Panx1TgCd4-cre+ (n=3) mice across different T cell seeding ratios (*p=0.039) (E). Histograms of suppression assays. Yellow highlights the area of difference (F). Unpaired Student’s t-test (D). Two-way ANOVA, Data are mean +/− s.e.m. (E). Related to Figure S5.
Figure 5.
Figure 5.. Phosphorylation of Serine 205 on Panx1 by SIK mediates channel activation
(A) Whole cell patch-clamp recordings of Panx1 currents over time and the representative current-voltage relationship (I/V curves) from purified CD4+ T cells after phenylephrine stimulation (blue) (left). The cells were activated with CD3 and CD28 prior to PE stimulation. The specificity of the Panx1 currents were verified via the Panx1 inhibitor CBX (red). CBX-sensitive current densities of Treg and Teff cells stimulated with CD3 and CD28 ± phenylephrine (right). (B) Schematic representation of methodologies used to investigate the mechanism of live cell Panx1 activation. After initial yeast 2-hybrid screens, co-immunoprecipitations and kinase assays were performed to validate hits. Electrophysiology studies and Panx1 mutagenesis were used to investigate SIK1 mediated activation of Panx1 at serine 205. (C) Yeast 2-hybrid (Y2H) screen showing colony growth on plates with Panx1 and SIK1 specific plasmids. (D) Immuno blot analysis of co-immunoprecipitations of endogenous Panx1 and SIK proteins in Jurkat T cells. Actin was used as a whole cell lysate loading (WCL) control. (E) Whole cell patch-clamp recordings of Panx1 currents over time in HEK293T cells expressing the α1D-adrenergic receptor and either Panx1-WT (left), Panx1-S205A (middle), or Panx1-S205D (right) during phenylephrine (PE) and carbenoxolone (CBX – Panx1 inhibitor) treatment. Current density quantification of Panx1 currents across the different Panx1 mutants and treatments. Unpaired Student’s t-test (E). Related to Figure S6.
Figure 6.
Figure 6.. The Panx1S205 phosphorylation axis controls the extent of airway inflammation
(A) Absolute cellularity of eosinophils (left) and CD4+ T cells (right) in SIK1fl/flCd4-cre (n=4), and SIK1fl/flCd4-cre+ mice (n=9). (B) Relative SIK family gene expression (log2FC relative to healthy) on CD4+ T cells of healthy or asthmatic patients (ctrl n=8, asthmatics n=8), revealing a decrease in the expression of the SIK gene family in asthmatics. (C) Current density quantification from whole cell patch-clamp recordings of Panx1 currents in HEK293T cells transfected with α1D and Panx1-WT before and after PE stimulation and the SIK family inhibitor HG9-91-01 (***p <0.0007). Two-way ANOVA (D) Functional analysis of genetically targeted Panx1S205A cells by TO-PRO-3 dye uptake during apoptosis. Histograms and MFI of TO-PRO-3 dye uptake within apoptotic cells and live cells of respective mice. (E) Flow plots showing the extent of eosinophil and CD4+ T cell infiltration into the bronchoalveolar space in Panx1+/+ and Panx1S205A mice. (F) Absolute cellularity of eosinophils (***p=0.0002) (left) and CD4+ T cells (***p=0.0006) (right). (Panx1+/+ n=5, Panx1S205A n=4). Unpaired Student’s t-test (C,F). Related to Figure S6.

Comment in

References

    1. Antonioli L, Pacher P, Vizi ES, Haskó G, 2013. CD39 and CD73 in immunity and inflammation. Trends Mol Med 19, 355–367. doi:10.1016/j.molmed.2013.03.005 - DOI - PMC - PubMed
    1. Arias-Calderón M, Almarza G, Díaz-Vegas A, Contreras-Ferrat A, Valladares D, Casas M, Toledo H, Jaimovich E, Buvinic S, 2016. Characterization of a multiprotein complex involved in excitation-transcription coupling of skeletal muscle. Skelet Muscle 6, 15. doi:10.1186/s13395-016-0087-5 - DOI - PMC - PubMed
    1. Billaud M, Chiu Y-H, Lohman AW, Parpaite T, Butcher JT, Mutchler SM, DeLalio LJ, Artamonov MV, Sandilos JK, Best AK, Somlyo AV, Thompson RJ, Le TH, Ravichandran KS, Bayliss DA, Isakson BE, 2015. A molecular signature in the pannexin1 intracellular loop confers channel activation by the α1 adrenoreceptor in smooth muscle cells. Sci Signal 8, ra17–ra17. doi:10.1126/scisignal.2005824 - DOI - PMC - PubMed
    1. Bosurgi L, Cao YG, Cabeza-Cabrerizo M, Tucci A, Hughes LD, Kong Y, Weinstein JS, Licona-Limon P, Schmid ET, Pelorosso F, Gagliani N, Craft JE, Flavell RA, Ghosh S, Rothlin CV, 2017. Macrophage function in tissue repair and remodeling requires IL-4 or IL-13 with apoptotic cells. Science 356, 1072–1076. doi:10.1126/science.aai8132 - DOI - PMC - PubMed
    1. Chekeni FB, Elliott MR, Sandilos JK, Walk SF, Kinchen JM, Lazarowski ER, Armstrong AJ, Penuela S, Laird DW, Salvesen GS, Isakson BE, Bayliss DA, Ravichandran KS, 2010. Pannexin 1 channels mediate “find-me” signal release and membrane permeability during apoptosis. Nature 467, 863–867. doi:10.1038/nature09413 - DOI - PMC - PubMed

Publication types