

The impact of COVID-19 lockdowns on surface urban heat island changes and air-quality improvements across 21 major cities in the Middle East
- PMID: 34284210
- PMCID: PMC9756818
- DOI: 10.1016/j.envpol.2021.117802
The impact of COVID-19 lockdowns on surface urban heat island changes and air-quality improvements across 21 major cities in the Middle East
Abstract
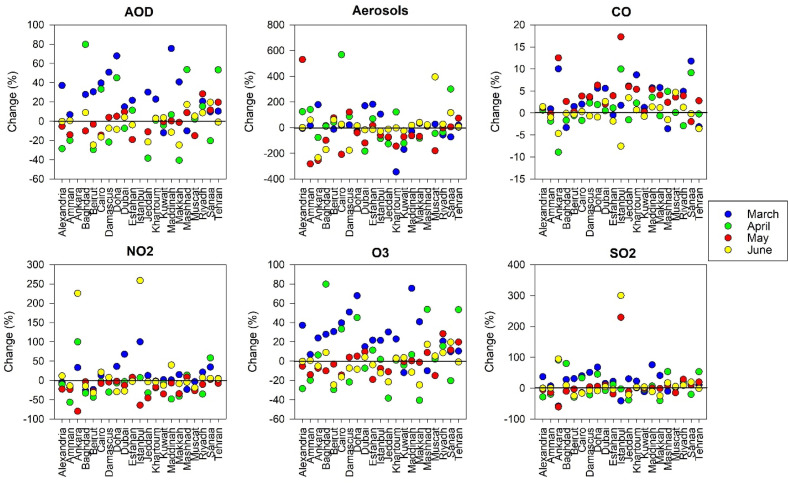
This study investigates changes in air quality conditions during the restricted COVID-19 lockdown period in 2020 across 21 metropolitan areas in the Middle East and how these relate to surface urban heat island (SUHI) characteristics. Based on satellite observations of atmospheric gases from Sentinel-5, results indicate significant reductions in the levels of atmospheric pollutants, particularly nitrogen dioxide (NO2), sulfur dioxide (SO2), and carbon monoxide (CO). Air quality improved significantly during the middle phases of the lockdown (April and May), especially in small metropolitan cities like Amman, Beirut, and Jeddah, while it was less significant in "mega" cities like Cairo, Tehran, and Istanbul. For example, the concentrations of NO2 in Amman, Beirut, and Jeddah decreased by -56.6%, -43.4%, and -32.3%, respectively, during April 2020, compared to April 2019. Rather, there was a small decrease in NO2 levels in megacities like Tehran (-0.9%) and Cairo (-3.1%). Notably, during the lockdown period, there was a decrease in the mean intensity of nighttime SUHI, while the mean intensity of daytime SUHI experienced either an increase or a slight decrease across these locations. Together with the Gulf metropolitans (e.g. Kuwait, Dubai, and Muscat), the megacities (e.g. Tehran, Ankara, and Istanbul) exhibited anomalous increases in the intensity of daytime SUHI, which may exceed 2 °C. Statistical relationships were established to explore the association between changes in the mean intensity and the hotspot area in each metropolitan location during the lockdown. The findings indicate that the mean intensity of SUHI and the spatial extension of hotspot areas within each metropolitan had a statistically significant negative relationship, with Pearson's r values generally exceeding - 0.55, especially for daytime SUHI. This negative dependency was evident for both daytime and nighttime SUHI during all months of the lockdown. Our findings demonstrate that the decrease in primary pollutant levels during the lockdown contributed to the decrease in the intensity of nighttime SUHIs in the Middle East, especially in April and May. Changes in the characteristics of SUHIs during the lockdown period should be interpreted in the context of long-term climate change, rather than just the consequence of restrictive measures. This is simply because short-term air quality improvements were insufficient to generate meaningful changes in the region's urban climate.
Keywords: Air quality; COVID-19; Climate change; Middle east; Urban heat island.
Copyright © 2021 Elsevier Ltd. All rights reserved.
Conflict of interest statement
The authors declare that they have no known competing financial interests or personal relationships that could have appeared to influence the work reported in this paper.
Figures


Similar articles
-
A global observational analysis to understand changes in air quality during exceptionally low anthropogenic emission conditions.Environ Int. 2021 Dec;157:106818. doi: 10.1016/j.envint.2021.106818. Epub 2021 Aug 20. Environ Int. 2021. PMID: 34425482
-
Changes in air pollution, land surface temperature, and urban heat islands during the COVID-19 lockdown in three Chinese urban agglomerations.Sci Total Environ. 2023 Sep 20;892:164496. doi: 10.1016/j.scitotenv.2023.164496. Epub 2023 May 29. Sci Total Environ. 2023. PMID: 37257592 Free PMC article.
-
Improvement in air quality and its impact on land surface temperature in major urban areas across India during the first lockdown of the pandemic.Environ Res. 2021 Aug;199:111280. doi: 10.1016/j.envres.2021.111280. Epub 2021 May 21. Environ Res. 2021. PMID: 34029544 Free PMC article.
-
Geospatial analysis of COVID-19 lockdown effects on air quality in the South and Southeast Asian region.Sci Total Environ. 2021 Feb 20;756:144009. doi: 10.1016/j.scitotenv.2020.144009. Epub 2020 Nov 21. Sci Total Environ. 2021. PMID: 33250248 Free PMC article.
-
Effect of COVID-19 pandemic on air quality: a study based on Air Quality Index.Environ Sci Pollut Res Int. 2021 Jul;28(27):35564-35583. doi: 10.1007/s11356-021-14462-9. Epub 2021 May 25. Environ Sci Pollut Res Int. 2021. PMID: 34036496 Free PMC article. Review.
Cited by
-
Effects of the COVID-19 Lockdown on Air Pollutant Levels and Associated Reductions in Ischemic Stroke Incidence in Shandong Province, China.Front Public Health. 2022 May 27;10:876615. doi: 10.3389/fpubh.2022.876615. eCollection 2022. Front Public Health. 2022. PMID: 35719628 Free PMC article.
-
The Curious Relationship Between COVID-19 Lockdowns and Urban Heat Islands.Geophys Res Lett. 2022 Apr 16;49(7):e2022GL098198. doi: 10.1029/2022GL098198. Epub 2022 Mar 30. Geophys Res Lett. 2022. PMID: 35601503 Free PMC article.
-
The effectiveness of a supportive training program on stress, anxiety, and depression of patients with COVID-19 hospitalized in Najaf hospitals.BMC Psychol. 2025 Feb 27;13(1):165. doi: 10.1186/s40359-025-02490-w. BMC Psychol. 2025. PMID: 40011949 Free PMC article. Clinical Trial.
-
The case of Tehran's urban heat island, Iran: Impacts of urban 'lockdown' associated with the COVID-19 pandemic.Sustain Cities Soc. 2021 Dec;75:103263. doi: 10.1016/j.scs.2021.103263. Epub 2021 Aug 14. Sustain Cities Soc. 2021. PMID: 36568531 Free PMC article.
-
Anthropogenic heat variation during the COVID-19 pandemic control measures in four Chinese megacities.Remote Sens Environ. 2023 Aug 1;293:113602. doi: 10.1016/j.rse.2023.113602. Epub 2023 Apr 26. Remote Sens Environ. 2023. PMID: 37159819 Free PMC article.
References
-
- Abutaleb K., et al. Assessment of urban heat island using remotely sensed imagery over Greater Cairo, Egypt. Adv. Rem. Sens. 2015;4:35.
-
- AL Talib B.Y. Religious tourism in Al Madina Al Munawara; and its future using GIS techniques. J. Arts Soc. Sci. 2020;11:1–24.
-
- Alobaydi D., Bakarman M.A., Obeidat B. The impact of urban form configuration on the urban heat island: the case study of Baghdad, Iraq. Procedia. Eng. 2016;145:820–827.
MeSH terms
Substances
LinkOut - more resources
Full Text Sources
Medical
Miscellaneous
