. 2021 Jul 27;118(30):e2022409118.
doi: 10.1073/pnas.2022409118.

COVID-19 pandemic reveals persistent disparities in nitrogen dioxide pollution

Affiliations

COVID-19 pandemic reveals persistent disparities in nitrogen dioxide pollution

Gaige Hunter Kerr et al. Proc Natl Acad Sci U S A. .

Abstract

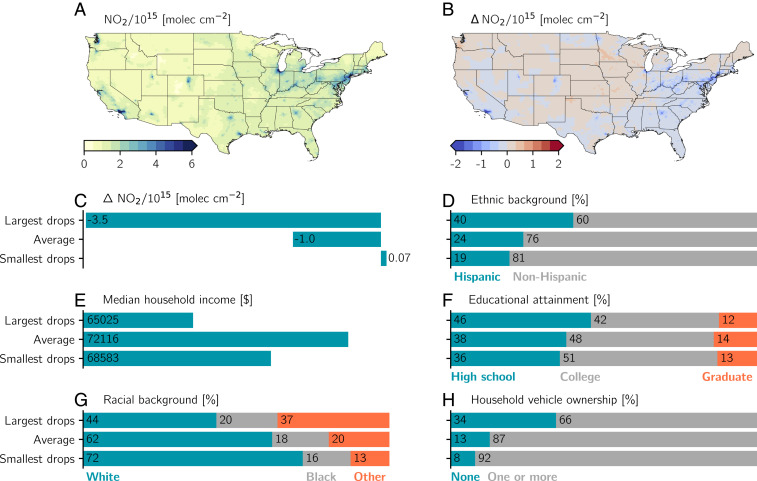
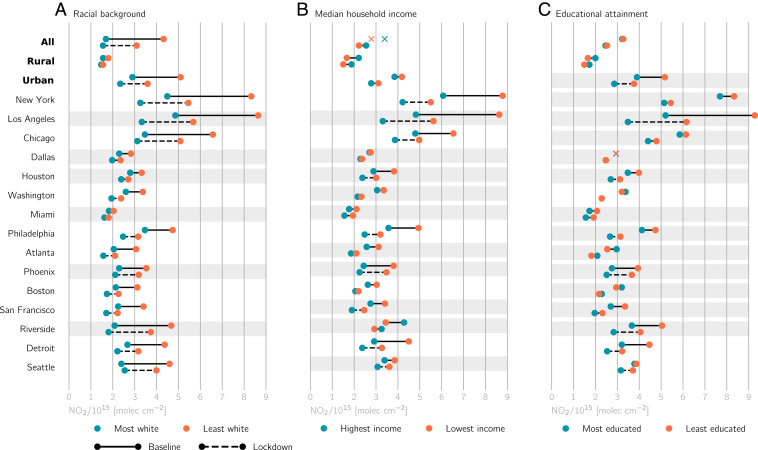
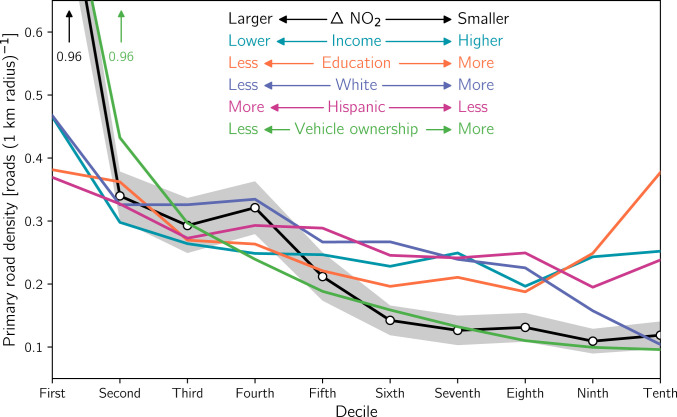
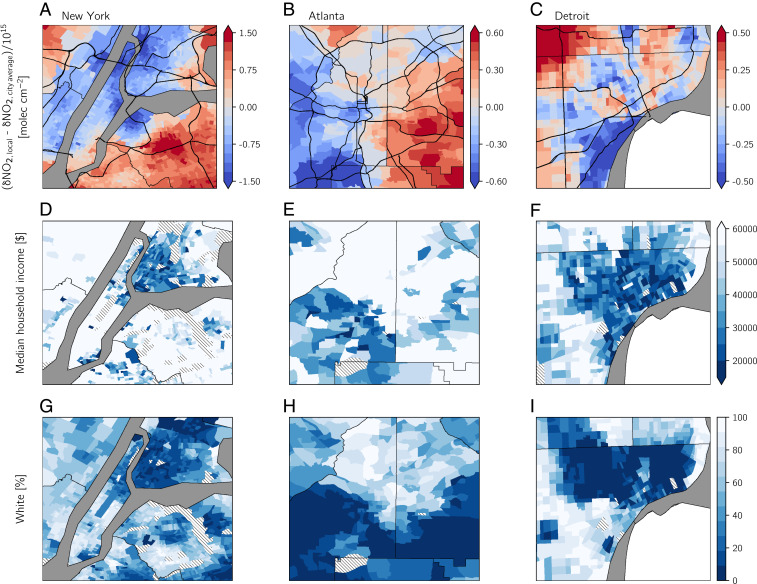
The unequal spatial distribution of ambient nitrogen dioxide ([Formula: see text]), an air pollutant related to traffic, leads to higher exposure for minority and low socioeconomic status communities. We exploit the unprecedented drop in urban activity during the COVID-19 pandemic and use high-resolution, remotely sensed [Formula: see text] observations to investigate disparities in [Formula: see text] levels across different demographic subgroups in the United States. We show that, prior to the pandemic, satellite-observed [Formula: see text] levels in the least White census tracts of the United States were nearly triple the [Formula: see text] levels in the most White tracts. During the pandemic, the largest lockdown-related [Formula: see text] reductions occurred in urban neighborhoods that have 2.0 times more non-White residents and 2.1 times more Hispanic residents than neighborhoods with the smallest reductions. [Formula: see text] reductions were likely driven by the greater density of highways and interstates in these racially and ethnically diverse areas. Although the largest reductions occurred in marginalized areas, the effect of lockdowns on racial, ethnic, and socioeconomic [Formula: see text] disparities was mixed and, for many cities, nonsignificant. For example, the least White tracts still experienced ∼1.5 times higher [Formula: see text] levels during the lockdowns than the most White tracts experienced prior to the pandemic. Future policies aimed at eliminating pollution disparities will need to look beyond reducing emissions from only passenger traffic and also consider other collocated sources of emissions such as heavy-duty vehicles.

Keywords: COVID-19; TROPOMI; air pollution; environmental justice; nitrogen dioxide.


Conflict of interest statement

The authors declare no competing interest.

Figures

Fig. 1.
Fig. 1.
Spatial distribution of NO2 columns during the baseline and COVID-19 lockdown periods and apportionment of drops among different demographic subgroups. (A) Census tract average baseline NO2 (13 March to 13 June 2019). (B) Absolute difference between lockdown (13 March to 13 June 2020) and baseline NO2 (ΔNO2), where ΔNO2<0 corresponds to NO2 drops during lockdowns. (CH) Demographic data averaged over urban tracts with the largest drops (ΔNO2 in first decile), all urban tracts, and urban tracts with the smallest drops (ΔNO2 in the tenth decile). “Other” in G includes American Indian or Alaska Native, Asian, Native Hawaiian or other Pacific Islander, two or more races, and some other race. The census-designated concept of race differs from ethnicity, and the percentage of White residents in G includes individuals with Hispanic origin or descent.
Fig. 2.
Fig. 2.
Disparities in baseline and lockdown NO2 columns for different (A) racial, (B) median household income, and (C) educational attainment population subgroups. Disparities are shown for three conglomerations (all, urban, and rural census tracts), and urban tracts are further separated into the 15 largest MSAs in the United States. For each conglomeration or MSA, demographic subgroups are determined using the 10th and 90th percentiles as thresholds. NO2 levels are thereafter averaged over tracts within these subgroups. If the difference in subgroup NO2 distributions for a particular demographic variable and time period is not statistically significant, mean NO2 levels are denoted with an “X” and no connector lines. Conglomerations or MSAs with no significant change in NO2 disparities between the baseline and lockdown periods are shaded in gray.
Fig. 3.
Fig. 3.
The relationship of road density with urban lockdown-related drops in NO2 columns and demographic variables. Road density is calculated as the number of primary road segments within a 1-km radius of tracts’ centroids for each decile of demographic variables. The colored legend indicates the directionality of each demographic variable. As an example, the density corresponding to the lowest decile of the “White” curve represents the road density in urban tracts that are the least White (i.e., in the first decile of the percentage of their population that is White). Shading for the ΔNO2 curve illustrate the 90% CI.
Fig. 4.
Fig. 4.
Case studies of lockdown NO2 drops, income, and race for (A, D, and G) New York, (B, E, and H) Atlanta, and (C, F, and I) Detroit. (AC) ΔNO2,local is calculated from oversampled TROPOMI data as the difference between ΔNO2 and the city average ΔNO2 to highlight neighborhoods with larger drops (i.e., negative values) and smaller drops (i.e., positive values) compared with the city-averaged drops. Primary roads are shown in thick black lines. (DF) Median household income and (GI) percentage of the population that is White. Tracts in DI that are employment centers, airports, parks, or forests and therefore report no demographic data are denoted with hatching.

References

    1. Bell M. L., Ebisu K., Environmental inequality in exposures to airborne particulate matter components in the United States. Environ. Health Perspect. 120, 1699–1704 (2012). - PMC - PubMed
    1. Landrigan P. J., et al. , The Lancet Commission on pollution and health. Lancet 391, 462–512 (2018). - PubMed
    1. Schell C. J., et al. , The ecological and evolutionary consequences of systemic racism in urban environments. Science 369, eaay4497 (2020). - PubMed
    1. Demetillo M. A. G., et al. , Observing nitrogen dioxide air pollution inequality using high-spatial-resolution remote sensing measurements in houston, Texas. Environ. Sci. Technol. 54, 9882–9895 (2020). - PubMed
    1. Nguyen N. P., Marshall J. D., Impact, efficiency, inequality, and injustice of urban air pollution: Variability by emission location. Environ. Res. Lett. 13, 024002 (2018).

Publication types