

Chemical Screen Identifies Diverse and Novel Histone Deacetylase Inhibitors as Repressors of NUT Function: Implications for NUT Carcinoma Pathogenesis and Treatment
- PMID: 34285087
- PMCID: PMC8568634
- DOI: 10.1158/1541-7786.MCR-21-0259
Chemical Screen Identifies Diverse and Novel Histone Deacetylase Inhibitors as Repressors of NUT Function: Implications for NUT Carcinoma Pathogenesis and Treatment
Abstract
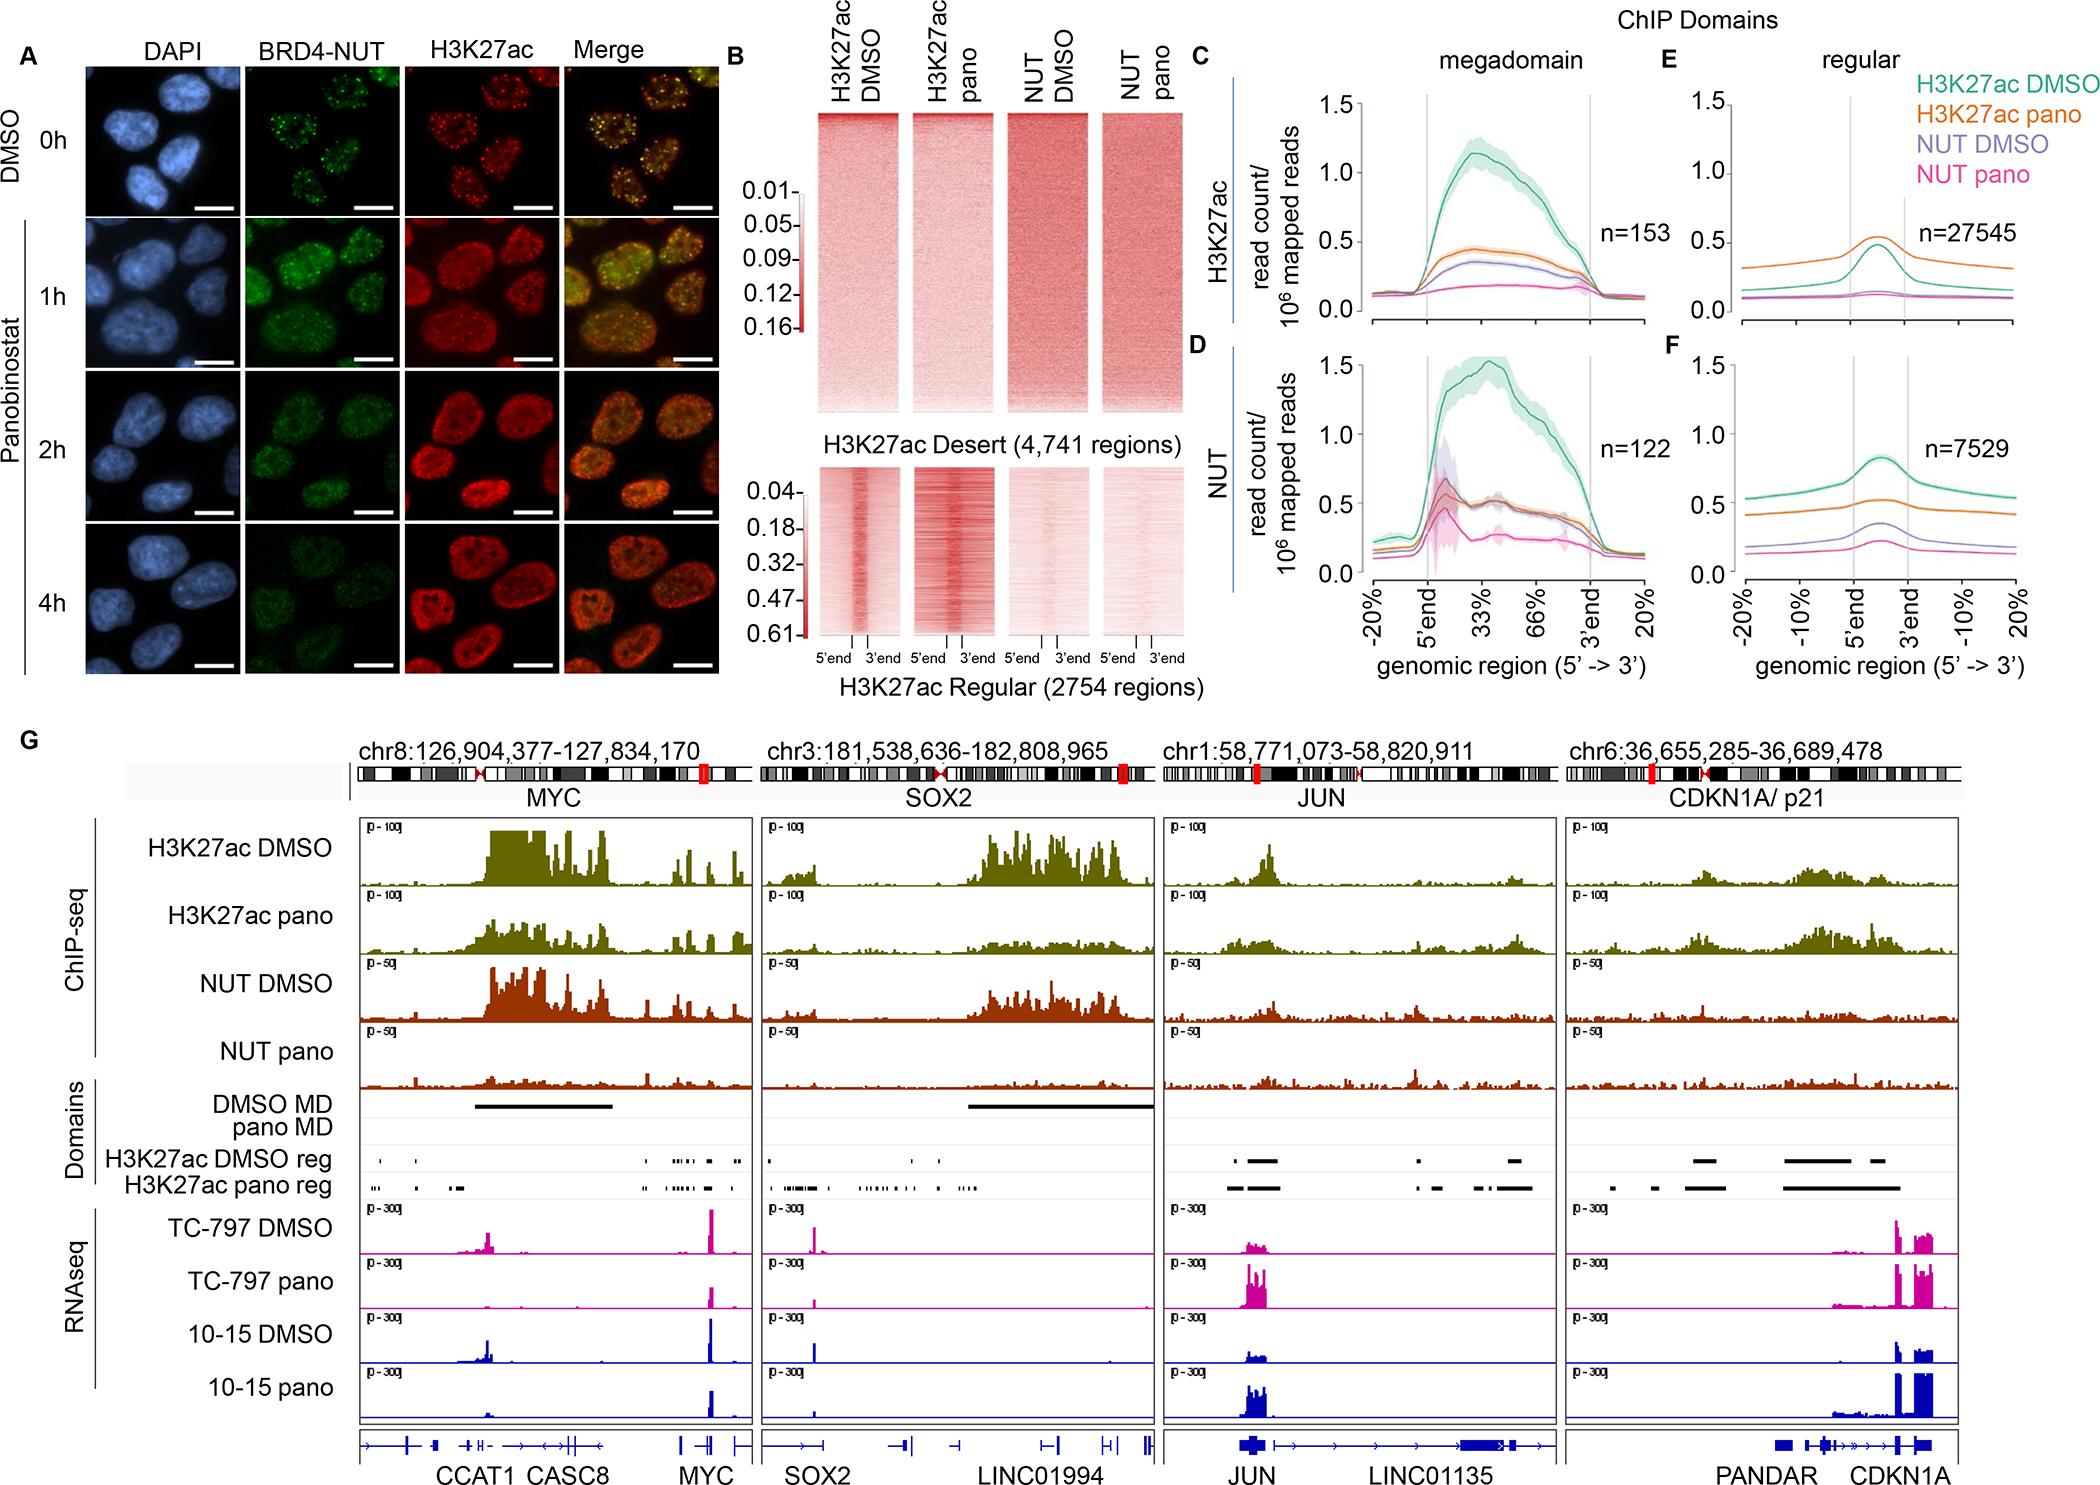
NUT carcinoma (NC), characterized most commonly by the BRD4-NUTM1 fusion, is a rare, aggressive variant of squamous carcinoma with no effective treatment. BRD4-NUT drives growth and maintains the poorly differentiated state of NC by activating pro-growth genes such as MYC, through the formation of massive, hyperacetylated, superenhancer-like domains termed megadomains. BRD4-NUT-mediated hyperacetylation of chromatin is facilitated by the chromatin-targeting tandem bromodomains of BRD4, combined with NUT, which recruits the histone acetyltransferase, p300. Here, we developed a high-throughput small-molecule screen to identify inhibitors of transcriptional activation by NUT. In this dCAS9-based GFP-reporter assay, the strongest hits were diverse histone deacetylase (HDAC) inhibitors. Two structurally unrelated HDAC inhibitors, panobinostat and the novel compound, IRBM6, both repressed growth and induced differentiation of NC cells in proportion to their inhibition of NUT transcriptional activity. These two compounds repressed transcription of megadomain-associated oncogenic genes, such as MYC and SOX2, while upregulating pro-differentiation, non-megadomain-associated genes, including JUN, FOS, and key cell-cycle regulators, such as CDKN1A. The transcriptional changes correlate with depletion of BRD4-NUT from megadomains, and redistribution of the p300/CBP-associated chromatin acetylation mark, H3K27ac, away from megadomains toward regular enhancer regions previously populated by H3K27ac. In NC xenograft models, we demonstrated that suppression of tumor growth by panobinostat was comparable with that of bromodomain inhibition, and when combined they improved both survival and growth suppression. IMPLICATIONS: The findings provide mechanistic and preclinical rationale for the use of HDAC inhibitors, alone or combined with other agents, in the treatment of NUT carcinoma.
©2021 American Association for Cancer Research.
Conflict of interest statement
Competing interests
P.A. Cole has ownership interest (including patents) in Acylin Therapeutics and has consulted for Abbvie and Constellation Pharmaceuticals. C.A. French is a consultant at Boehringer-Ingelheim, and reports receiving a commercial research grant from Boehringer-Ingelheim, Glaxo-Smith-Kline, and Constellation Pharmaceuticals (Cambridge, MA). No potential conflicts of interest were disclosed by the other authors.
Figures


Similar articles
-
Supercharging BRD4 with NUT in carcinoma.Oncogene. 2021 Feb;40(8):1396-1408. doi: 10.1038/s41388-020-01625-0. Epub 2021 Jan 15. Oncogene. 2021. PMID: 33452461 Free PMC article. Review.
-
The BRD4-NUT Fusion Alone Drives Malignant Transformation of NUT Carcinoma.Cancer Res. 2023 Dec 1;83(23):3846-3860. doi: 10.1158/0008-5472.CAN-23-2545. Cancer Res. 2023. PMID: 37819236 Free PMC article.
-
Therapeutic targeting of p300/CBP HAT domain for the treatment of NUT midline carcinoma.Oncogene. 2020 Jun;39(24):4770-4779. doi: 10.1038/s41388-020-1301-9. Epub 2020 May 4. Oncogene. 2020. PMID: 32366905 Free PMC article.
-
Combined Targeting of the BRD4-NUT-p300 Axis in NUT Midline Carcinoma by Dual Selective Bromodomain Inhibitor, NEO2734.Mol Cancer Ther. 2020 Jul;19(7):1406-1414. doi: 10.1158/1535-7163.MCT-20-0087. Epub 2020 May 5. Mol Cancer Ther. 2020. PMID: 32371576 Free PMC article.
-
NUT Is a Driver of p300-Mediated Histone Hyperacetylation: From Spermatogenesis to Cancer.Cancers (Basel). 2022 Apr 29;14(9):2234. doi: 10.3390/cancers14092234. Cancers (Basel). 2022. PMID: 35565363 Free PMC article. Review.
Cited by
-
Prolonged Survival of NUT Midline Carcinoma and Current Approaches to Treatment.Oncologist. 2023 Sep 7;28(9):765-770. doi: 10.1093/oncolo/oyad177. Oncologist. 2023. PMID: 37311046 Free PMC article.
-
Hiding in plain sight: NUT carcinoma is an unrecognized subtype of squamous cell carcinoma of the lungs and head and neck.Nat Rev Clin Oncol. 2025 Apr;22(4):292-306. doi: 10.1038/s41571-025-00986-3. Epub 2025 Feb 3. Nat Rev Clin Oncol. 2025. PMID: 39900969 Review.
-
Report of the First International Symposium on NUT Carcinoma.Clin Cancer Res. 2022 Jun 13;28(12):2493-2505. doi: 10.1158/1078-0432.CCR-22-0591. Clin Cancer Res. 2022. PMID: 35417004 Free PMC article.
-
Histone H2B Deacylation Selectivity: Exploring Chromatin's Dark Matter with an Engineered Sortase.J Am Chem Soc. 2022 Mar 2;144(8):3360-3364. doi: 10.1021/jacs.1c13555. Epub 2022 Feb 17. J Am Chem Soc. 2022. PMID: 35175758 Free PMC article.
-
Structural Basis of Sirtuin 6-Catalyzed Nucleosome Deacetylation.J Am Chem Soc. 2023 Mar 29;145(12):6811-6822. doi: 10.1021/jacs.2c13512. Epub 2023 Mar 17. J Am Chem Soc. 2023. PMID: 36930461 Free PMC article.
References
-
- French CA, Miyoshi I, Kubonishi I, Grier HE, Perez-Atayde AR, Fletcher JA. Brd4-nut fusion oncogene: A novel mechanism in aggressive carcinoma. Cancer Res. 2003;63(2):304–7. - PubMed
-
- French CA, Kutok JL, Faquin WC, Toretsky JA, Antonescu CR, Griffin CA, et al. Midline carcinoma of children and young adults with nut rearrangement. J Clin Oncol. 2004;22(20):4135–9. Epub 2004/10/16. - PubMed
-
- French CA. Pathogenesis of nut midline carcinoma. Annu Rev Pathol. 2012;7:247–65. Epub 2011/10/25. - PubMed
Publication types
MeSH terms
Substances
Grants and funding
LinkOut - more resources
Full Text Sources
Molecular Biology Databases
Miscellaneous
