. 2021 Aug;70(8):1754-1766.
doi: 10.2337/db20-1081. Epub 2021 Mar 18.

T-Cell Expression and Release of Kidney Injury Molecule-1 in Response to Glucose Variations Initiates Kidney Injury in Early Diabetes

Affiliations

T-Cell Expression and Release of Kidney Injury Molecule-1 in Response to Glucose Variations Initiates Kidney Injury in Early Diabetes

Josephine M Forbes et al. Diabetes. 2021 Aug.

Abstract

Half of the mortality in diabetes is seen in individuals <50 years of age and commonly predicted by the early onset of diabetic kidney disease (DKD). In type 1 diabetes, increased urinary albumin-to-creatinine ratio (uACR) during adolescence defines this risk, but the pathological factors responsible remain unknown. We postulated that early in diabetes, glucose variations contribute to kidney injury molecule-1 (KIM-1) release from circulating T cells, elevating uACR and DKD risk. DKD risk was assigned in youth with type 1 diabetes (n = 100; 20.0 ± 2.8 years; males/females, 54:46; HbA1c 66.1 [12.3] mmol/mol; diabetes duration 10.7 ± 5.2 years; and BMI 24.5 [5.3] kg/m2) and 10-year historical uACR, HbA1c, and random blood glucose concentrations collected retrospectively. Glucose fluctuations in the absence of diabetes were also compared with streptozotocin diabetes in apolipoprotein E -/- mice. Kidney biopsies were used to examine infiltration of KIM-1-expressing T cells in DKD and compared with other chronic kidney disease. Individuals at high risk for DKD had persistent elevations in uACR defined by area under the curve (AUC; uACRAUC0-10yrs, 29.7 ± 8.8 vs. 4.5 ± 0.5; P < 0.01 vs. low risk) and early kidney dysfunction, including ∼8.3 mL/min/1.73 m2 higher estimated glomerular filtration rates (modified Schwartz equation; Padj < 0.031 vs. low risk) and plasma KIM-1 concentrations (∼15% higher vs. low risk; P < 0.034). High-risk individuals had greater glycemic variability and increased peripheral blood T-cell KIM-1 expression, particularly on CD8+ T cells. These findings were confirmed in a murine model of glycemic variability both in the presence and absence of diabetes. KIM-1+ T cells were also infiltrating kidney biopsies from individuals with DKD. Healthy primary human proximal tubule epithelial cells exposed to plasma from high-risk youth with diabetes showed elevated collagen IV and sodium-glucose cotransporter 2 expression, alleviated with KIM-1 blockade. Taken together, these studies suggest that glycemic variations confer risk for DKD in diabetes via increased CD8+ T-cell production of KIM-1.


Figures

Figure 1
Figure 1
Youth with type 1 diabetes at high risk for DKD have early kidney dysfunction and greater glycemic variability. Youth (20.0 ± 2.8 years old) with type 1 diabetes but not previously diagnosed with DKD were stratified by future risk for DKD using tertiles of uACR (low risk, N = 33; medium [Med] risk, N = 33; and high risk, N = 34). AD: Measures of kidney function. A: All subjects in the cohort (N = 100) plotted by increasing uACR. General linear regression plot of log uACR vs. eGFR using the adult eGFRCKD-EPI formula (B) or the pediatric modified eGFRSCHWARTZ equation (C), corrected for age, sex, diabetes duration and HbA1c. D: Historical uACR. Mean uACR observation periods were 5.0 ± 1.7 years and 4.8 ± 2.5 years for the low- versus high-risk group, respectively. Historical long-term glucose control (HbA1c) (E) and nonfasted plasma glucose concentrations (F) from the time of diabetes diagnosis (green arrows) according to DKD risk. Mean HbA1c/plasma glucose observation periods were 7.6 ± 2.7 years and 7.0 ± 3.4 years for the low- vs. high-risk group, respectively. G: AUC for retrospective uACR over the previous 10 years (AUCuACR 0-10) (other AUC plots in Supplementary Fig. 1). HJ: Cohort glycemic control at the time of recruitment. Long-term markers of glucose control, HbA1c (H) and fructosamine albumin (Alb) (I), and blood glucose variability in 1,5 anhydroglucitol (AG) (J). **P < 0.01 vs. low risk or medium risk. No., number.
Figure 2
Figure 2
Circulating KIM-1 increases with DKD risk and damages healthy primary human kidney cells. Youth (20.0 ± 2.8 years old) with type 1 diabetes were stratified by risk for DKD using tertiles of uACR (low risk, N = 33; medium [Med] risk, N = 33; and high risk, N = 34). A: Plasma KIM-1 measured by ELISA. B: Linear regression plot of log uACR vs. plasma KIM-1 in the entire cohort. C and D: Healthy PTECs were incubated for 24 h with plasma (4%) from matched pairs of participants (N = 10, low/high-risk pairs matched for age, sex, diabetes duration, HbA1c, and BMI) in the presence and absence of preincubation with KIM-1–neutralizing antibody (Ab). C: Collagen IV PTEC content by IN Carta Image Analysis Software. D: Upregulation of cell surface SGLT2 on PTECs by flow cytometry. EH: Representative photomicrographs of patient plasma-exposed PTECs stained for collagen IV (Coll IV; red), SGLT2 (green), and nuclei (DAPI; blue). E: Low risk plus control Ab. F: Low risk plus KIM-1–blocking Ab. G: High risk plus control Ab. H: High risk plus KIM-1– blocking Ab. Scale bar = 20 μm. I: Characteristics of paired low- and high-risk participants whose 4% plasma was used in PTEC experiments (N = 10/group). J: Urinary KIM-1 concentrations in all subjects per milligram of creatinine (Cr). *P < 0.05 vs. low risk; **P < 0.01 vs. low risk plus KIM-1 blockade. BG, blood glucose; MFU, mean fluorescence unit.
Figure 3
Figure 3
Glucose variability even in the absence of diabetes increases T-cell Kim-1 expression in preclinical models. A: Male adolescent ApoE−/− mice (6 weeks [Wks] of age) received four i.p. injections of glucose (2 g/kg; blue diamonds; N = 10) or isovolumetric saline injections (saline; white diamonds; N = 10), delivered 2 h apart, to achieve plasma glucose variations that peaked between ∼15 and 20 mmol/L. B: Plasma glucose concentrations after four bihourly glucose injections are shown. This was repeated weekly for 10 weeks and compared with age-matched streptozotocin diabetic mice followed over the same period (red diamonds; N = 10). B: Daily plasma glucose concentrations in saline- and glucose-injected mice. C: Long-term glucose control measured by glycated hemoglobin. D: uACR at week 16. E and F: Flow cytometry analysis of live peripheral blood Kim-1+ cells. E: Non-T cells (Kim-1+CD3). F: CD4+ (Kim-1+CD3+CD4+CD8) and CD8+ (Kim-1+CD3+CD8+CD4) subsets as proportion of CD3+ T cells. G: Linear regression of CD3+CD8+CD4Kim-1+ T cells and uACR. H: Contour plot of CD4+ and CD8+ separation of murine live (Ghost 510-nm viability) CD3+ Kim-1+ T cells from peripheral blood. Data are shown as mean SD or median (interquartile range) and tested using one-way ANOVA/Tukey post hoc or Kruskal Wallis/Dunn post hoc testing. *P < 0.05, **P < 0.01, ***P < 0.001 vs. saline group. Diab, diabetes.
Figure 4
Figure 4
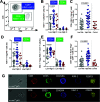
T-cell KIM-1 expression is increased in youth at high risk for DKD. Youth (20.0 ± 2.8 years old) with type 1 diabetes were stratified by risk for DKD using tertiles of uACR (low risk, N = 33; medium risk, N = 33; and high risk, N = 34). KIM-1 expression on live PBMCs is shown for low- and high-risk groups. Control subjects are a reference group of healthy individuals but are not age- and sex-matched nor used in statistical analyses. Circulating KIM-1+ live T-cell (CD3+) populations (A) as a contour plot for all KIM-1+CD4 (green) and CD8+ (blue) and plotted as individual subjects (B). C: Circulating KIM-1+ Tconv (CD3+) cells expressing KIM-1 sorted for the specific subset of naive CD8+ Tconv cells (CD3+CD8+CD4CD45RA+HLA-DR). DG: Circulating Treg cell (CD3+CD25+CD127lo/−) populations expressing KIM-1 plotted as a proportion of all CD4+ (green) and CD8+ (blue) Treg (D) or all CD3+KIM-1+ Treg (CD3+CD8+CD25+CD127lo/−) (E). F: CD8+ Treg cells expressing KIM-1 sorted for the naive CD8+ Treg (CD8+CD25+CD127lo/−CD45RA+HLA-DR) subset. G: Single-cell imaging of two representative naive KIM-1+CD8+ Treg cells during flow cytometry showing channels for cell surface markers bright field (BF), CD8 (red), CD25 (green), CD45RA (violet), KIM-1 (blue), and intracellular FOXP3 (yellow). All other KIM-1+ T-cell subsets are presented in Supplementary Figs. 7 and 8. Data are shown as mean ± SD or median (interquartile range) and analyzed using Student t test or Mann-Whitney U test. C, control.
Figure 5
Figure 5
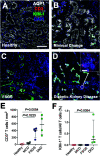
Kidney biopsies from individuals with DKD show infiltration of KIM-1+ T cells. Representative immunofluorescent staining of kidney tissue in frozen sections taken from research tissue donors with renal pathologist–confirmed healthy kidney (A), minimal change disease (MCD) (B), FSGS (C), and DKD (D). Kidney tissue sections were stained for Aquaporin-1 (white), T cells (CD3; red), KIM-1 (green), and nuclei (DAPI; blue). A representative KIM-1+ T cell is circled in D. Scale bars = 100 μm; 10 μm for the inset image in D. E: Morphometric quantification of CD3+ T cells (cells per mm2) from kidney tissues (N = 4 donors/group) with values for individual donors presented. Data are shown as median with interquartile range. F: Proportion of CD3+ T cells expressing KIM-1 from healthy kidney tissue (N = 4), MCD (n = 4), FSGS (n = 4), and DKD tissue (n = 4).

Comment in

References

    1. Huo L, Harding JL, Peeters A, Shaw JE, Magliano DJ. Life expectancy of type 1 diabetic patients during 1997-2010: a national Australian registry-based cohort study. Diabetologia 2016;59:1177–1185 - PubMed
    1. Miller RG, Mahajan HD, Costacou T, Sekikawa A, Anderson SJ, Orchard TJ. A contemporary estimate of total mortality and cardiovascular disease risk in young adults with type 1 diabetes: the Pittsburgh Epidemiology of Diabetes Complications Study. Diabetes Care 2016;39:2296–2303 - PMC - PubMed
    1. Raghavan S, Vassy JL, Ho YL, et al. . Diabetes mellitus-related all-cause and cardiovascular mortality in a national cohort of adults. J Am Heart Assoc 2019;8:e011295. - PMC - PubMed
    1. Gregg EW, Cheng YJ, Srinivasan M, et al. . Trends in cause-specific mortality among adults with and without diagnosed diabetes in the USA: an epidemiological analysis of linked national survey and vital statistics data. Lancet 2018;391:2430–2440 - PubMed
    1. Rawshani A, Sattar N, Franzén S, et al. . Excess mortality and cardiovascular disease in young adults with type 1 diabetes in relation to age at onset: a nationwide, register-based cohort study. Lancet 2018;392:477–486 - PMC - PubMed

Publication types

MeSH terms

Substances