. 2021 Jul 20;11(1):399.
doi: 10.1038/s41398-021-01490-9.

Effects of eight neuropsychiatric copy number variants on human brain structure

Collaborators, Affiliations

Effects of eight neuropsychiatric copy number variants on human brain structure

Claudia Modenato et al. Transl Psychiatry. .

Abstract

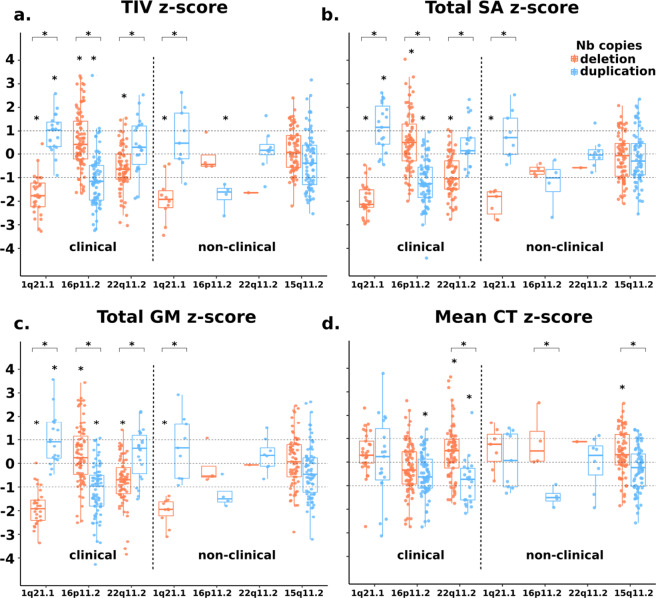
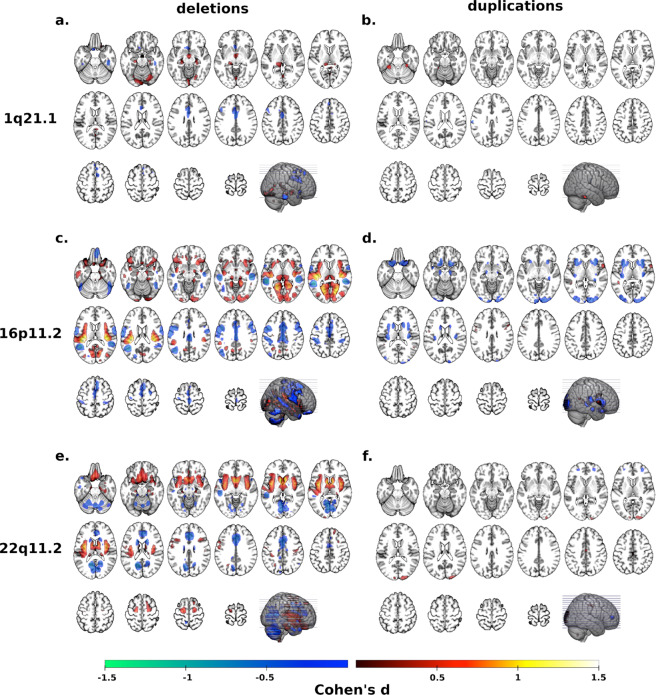
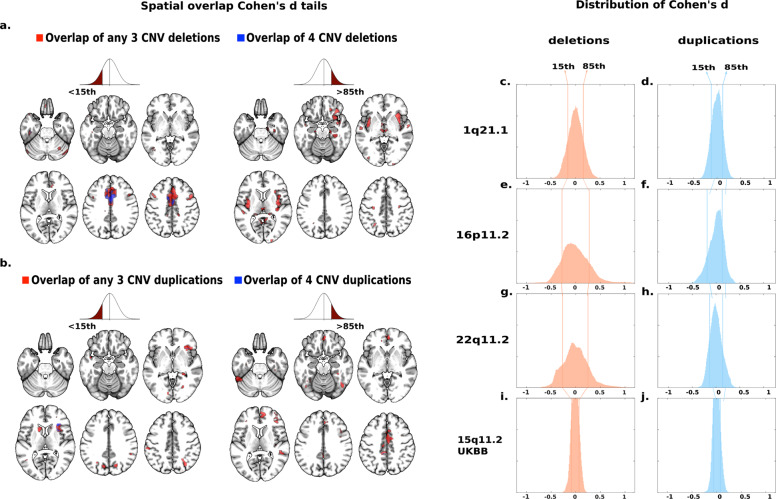
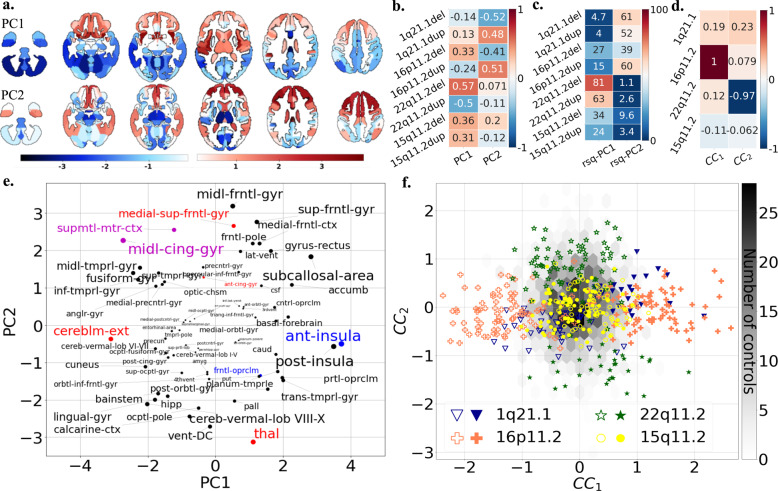
Many copy number variants (CNVs) confer risk for the same range of neurodevelopmental symptoms and psychiatric conditions including autism and schizophrenia. Yet, to date neuroimaging studies have typically been carried out one mutation at a time, showing that CNVs have large effects on brain anatomy. Here, we aimed to characterize and quantify the distinct brain morphometry effects and latent dimensions across 8 neuropsychiatric CNVs. We analyzed T1-weighted MRI data from clinically and non-clinically ascertained CNV carriers (deletion/duplication) at the 1q21.1 (n = 39/28), 16p11.2 (n = 87/78), 22q11.2 (n = 75/30), and 15q11.2 (n = 72/76) loci as well as 1296 non-carriers (controls). Case-control contrasts of all examined genomic loci demonstrated effects on brain anatomy, with deletions and duplications showing mirror effects at the global and regional levels. Although CNVs mainly showed distinct brain patterns, principal component analysis (PCA) loaded subsets of CNVs on two latent brain dimensions, which explained 32 and 29% of the variance of the 8 Cohen's d maps. The cingulate gyrus, insula, supplementary motor cortex, and cerebellum were identified by PCA and multi-view pattern learning as top regions contributing to latent dimension shared across subsets of CNVs. The large proportion of distinct CNV effects on brain morphology may explain the small neuroimaging effect sizes reported in polygenic psychiatric conditions. Nevertheless, latent gene brain morphology dimensions will help subgroup the rapidly expanding landscape of neuropsychiatric variants and dissect the heterogeneity of idiopathic conditions.


Conflict of interest statement

MBMVdB reports grants from Takeda Pharmaceuticals, outside the submitted work. All other authors reported no biomedical financial interests or potential conflicts of interest.

Figures

Fig. 1
Fig. 1. 1q21.1, 16p11.2, 22q11.2, and 15q11.2 exert rich effects on global brain measures.
Total intracranial volume (a), total surface area (b), total grey matter volume (c) and mean cortical thickness (d) for clinically and non-clinically ascertained CNVs. Z scores for clinically and non-clinically ascertained CNVs were calculated using 331 and 965 controls, respectively, adjusting for age, age2, sex and site as a random factor. Y axis values are z scores. X axis are CNV groups. Significant difference between CNV group and corresponding control group is indicated with a star. Horizontal bars with stars show significant differences between deletions and duplications within the same locus. TIV total intracranial volume, SA surface area, GM grey matter, CT cortical thickness.
Fig. 2
Fig. 2. Cohen’s d maps of VBM regional brain differences in deletion and duplication carriers at the 1q21.1, 16p11.2, and 22q11.2 loci compared to controls.
Regional brain differences adjusted for total grey matter volume. Left and right columns show results for deletions (a, c, e) and duplication (b, d, f) carriers, respectively. Color maps show the significant effects of each CNV, thresholded at q < 0.05 FWE. Color scale represents positive and negative Cohen’s d effect sizes were estimated. The linear model was adjusted for sex, linear, and quadratic expansion of age and total grey matter volume. 15q11.2 was not displayed because only a few voxels survived family-wise error (FWE) correction. Corresponding maps for surface area and cortical thickness are reported in Supplementary Figs. 4 and 5.
Fig. 3
Fig. 3. Spatial overlap across deletions and duplications at four genomic loci.
Spatial overlap across clinically and non-clinically ascertained deletions (a) and duplications (b) at four genomic loci shown separately for <15th and >85th percentile of Cohen’s d values. Overlap of all four deletions (a) or all four duplications (b) is shown in blue. Overlaps of any combination of three deletions (a) or any combination of three duplications (b) are shown in red. Top ranking Cohen’s d values used in (a, b) are presented on the density plots for all eight deletions and duplications: 1q21.1 (c, d), 16p11.2 (e, f), 22q11.2 (g, h), 15q11.2 (i, j). The x axes values of the eight density plots are Cohen’s d. Corresponding maps for surface area and cortical thickness are reported in Supplementary Figs. 6 and 7.
Fig. 4
Fig. 4. Principal component analysis and canonical correlation analysis of brain alterations due to eight CNVs.
a PCA dimension 1 and 2 regional relevances projected on axial brain slices. The darker the red or blue color, the stronger the positive or negative association with the PCA dimensions. PCA was run on z-scored Cohen’s d values, with the eight CNVs as variables and 130 neuroanatomical GM regions as observations. GM region volumes were adjusted for total grey matter, age, age2, sex, and site. The first two components explained respectively 31.77 and 28.66 % of the variance. b Loading of eight CNVs on the two PCA dimensions. Values are PC loading magnitudes and represent the contribution of a CNV to the PC. c Variance explained (coefficient of determination, R-squared) of each CNV Cohen’s d profile by PC1 and PC2. Values and color scale represent the “percent of variance”. d Loadings of the first and second CCA dimension on four CNV genomic loci. Shows contribution of a CNV loci to the canonical dimension. e Loading of Neuromorphometrics Regions of Interests (ROIs) on the two PCA dimensions. ROIs are averaged across the left and right hemisphere for visualization. The font size is correlated to the region’s contribution to dimensions. ROI names are color coded as being part of the deletion (red), duplication (blue) and both deletion and duplication (magenta) convergence patterns. f Scatterplot showing the participant/specific expressions of each of the 484 carriers of eight different CNVs along two dominant gene-morphometry canonical correlation (CC) dimensions established using 130 neuroanatomical GM regions of CNV carriers. GM region volumes were adjusted for total grey matter, age, age2, sex, and site. The empty and full symbols represent deletions and duplication, respectively. The grey hexagonal bin plot represents the frequency of controls (n = 1296). Controls were not used to calculate the CCA and were projected post hoc on the two dimensions using CCA prediction. CCA ROI loadings are reported in Supplementary Fig. 10. Results for surface area and cortical thickness are reported in Supplementary Fig. 9 (PCA), 14–15 (CCA).

References

    1. Sanders SJ, et al. Insights into autism spectrum disorder genomic architecture and biology from 71 risk loci. Neuron. 2015;87:1215–33. doi: 10.1016/j.neuron.2015.09.016. - DOI - PMC - PubMed
    1. Marshall CR, et al. Contribution of copy number variants to schizophrenia from a genome-wide study of 41,321 subjects. Nat Genet. 2017;49:27–35. doi: 10.1038/ng.3725. - DOI - PMC - PubMed
    1. Chawner SJRA, et al. A genetics-first approach to dissecting the heterogeneity of autism: phenotypic comparison of autism risk copy number variants. AJP. 2021;178:77–86. doi: 10.1176/appi.ajp.2020.20010015. - DOI - PMC - PubMed
    1. Douard E, et al. Effect sizes of deletions and duplications on autism risk across the genome. AJP. 2020;178:87–98. doi: 10.1176/appi.ajp.2020.19080834. - DOI - PMC - PubMed
    1. Moreno-De-Luca D, et al. Using large clinical data sets to infer pathogenicity for rare copy number variants in autism cohorts. Mol Psychiatry. 2013;18:1090–5. doi: 10.1038/mp.2012.138. - DOI - PMC - PubMed

Publication types