. 2021 Jul 20;12(1):4401.
doi: 10.1038/s41467-021-24588-6.

Temperature heterogeneity correlates with intraspecific variation in physiological flexibility in a small endotherm

Affiliations

Temperature heterogeneity correlates with intraspecific variation in physiological flexibility in a small endotherm

Maria Stager et al. Nat Commun. .

Abstract

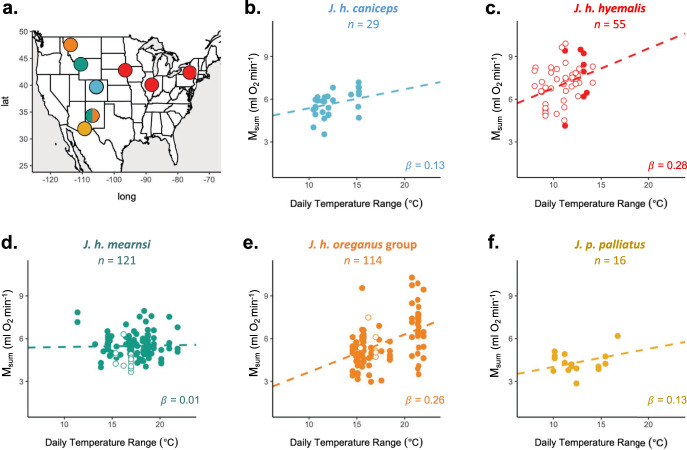
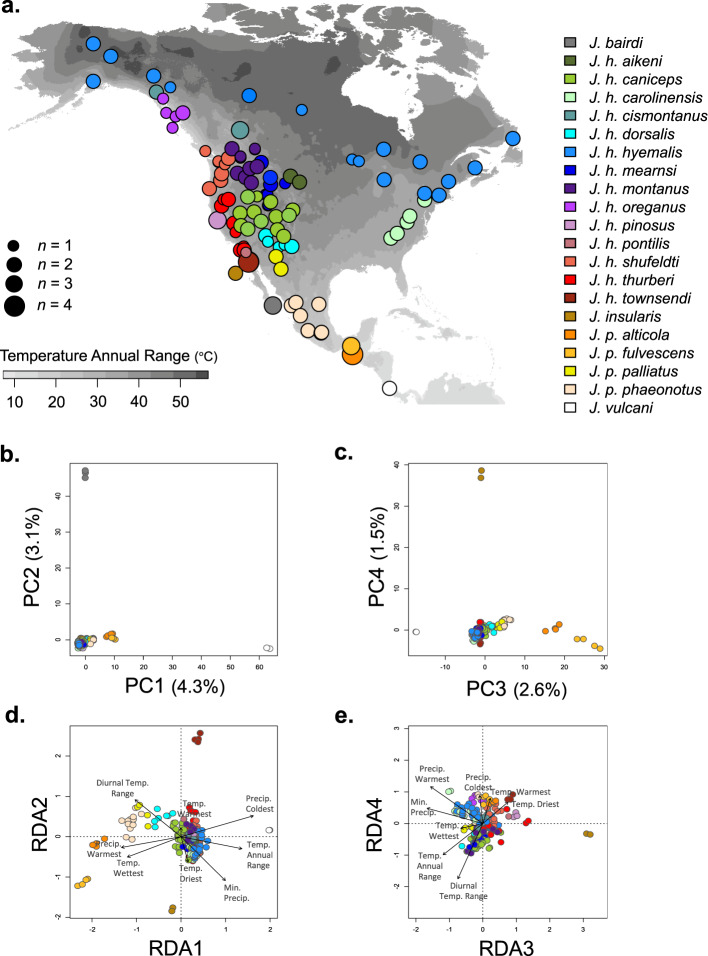
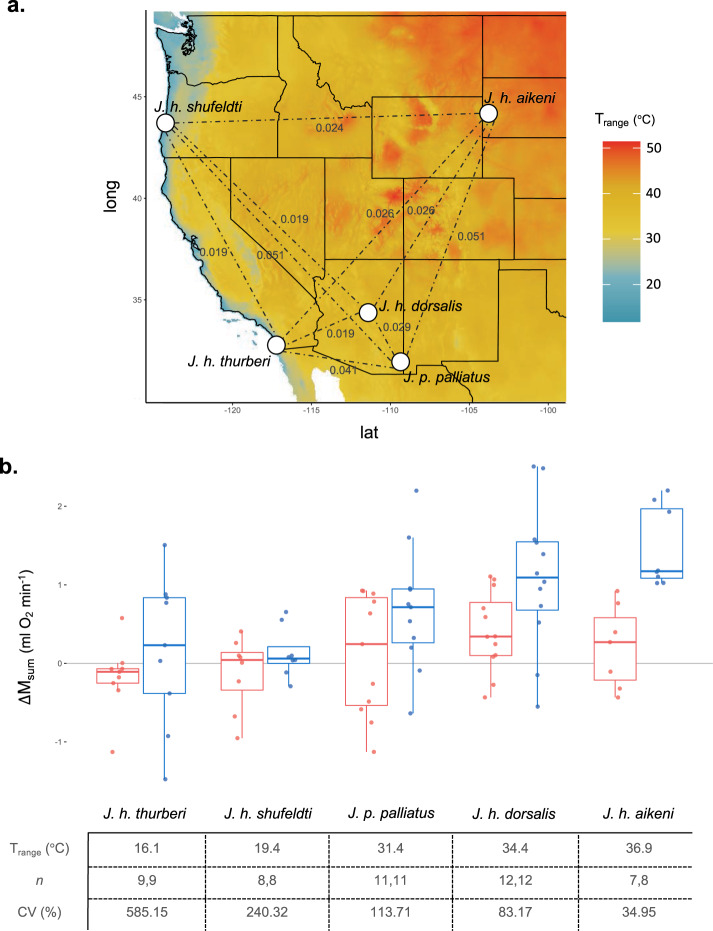
Phenotypic flexibility allows individuals to reversibly modify trait values and theory predicts an individual's relative degree of flexibility positively correlates with the environmental heterogeneity it experiences. We test this prediction by integrating surveys of population genetic and physiological variation with thermal acclimation experiments and indices of environmental heterogeneity in the Dark-eyed Junco (Junco hyemalis) and its congeners. We combine field measures of thermogenic capacity for 335 individuals, 22,006 single nucleotide polymorphisms genotyped in 181 individuals, and laboratory acclimations replicated on five populations. We show that Junco populations: (1) differ in their thermogenic responses to temperature variation in the field; (2) harbor allelic variation that also correlates with temperature heterogeneity; and (3) exhibit intra-specific variation in thermogenic flexibility in the laboratory that correlates with the heterogeneity of their native thermal environment. These results provide comprehensive support that phenotypic flexibility corresponds with environmental heterogeneity and highlight its importance for coping with environmental change.


Conflict of interest statement

The authors declare no competing interests.

Figures

Fig. 1
Fig. 1. Relationships between daily temperature range and thermogenic capacity (Msum) differ among five Junco taxa assayed in the field.
a Map of sampling sites for field measurements color-coded by taxon, following color scheme in bf and plotted in R with package mapdata. bf Taxon-specific relationships between Msum and daily temperature range (averaged over the 8 days prior to capture), while controlling for differences in body mass. Each dot represents an individual (n = 335). Sample sizes for each taxon are listed at the top and the slope (β; in ml O2 min−1 °C−1) of each relationship is shown in the lower right corner. Sampling occurred during the breeding season (filled circle) or nonbreeding season (open circle). Lines fit from glm (Msum = Mb + Taxa × Td_range) using mean Mb for each taxon. Source data are provided in the Source Data file.
Fig. 2
Fig. 2. Junco population genetic variation.
a Origin of 181 Junco individuals included in the SNP dataset. Map shading (in grayscale) depicts temperature annual range values from WorldClim, plotted in R with package raster. Dot color denotes museum-based taxon assignments; dot size represents the number of individuals from that locale (n = 1 to 4). Population genetic variation from 22,006 genome-wide SNPs structured along four PC axes (b, c) and four RDA axes (d, e) where each dot represents an individual. Colors follow the legend provided in (a). d, e Arrows indicate loadings of eight WorldClim variables (diurnal temperature range, temperature annual range, mean temperature of the warmest quarter, mean temperature of the wettest quarter, mean temperature of the driest quarter, mean minimum precipitation, mean precipitation of the warmest quarter, and mean precipitation of the coldest quarter) in a partial RDA conditioned on PC axes 1 and 2. Source data are provided in the Source Data file.
Fig. 3
Fig. 3. Junco thermogenic flexibility correlates with thermal heterogeneity.
a Origin of five Junco populations used in laboratory acclimations (dots) that differ in their native annual temperature range (Trange; values from WorldClim), shown in shaded colors and plotted in R with package raster. Pairwise FST indicated by dotted lines and accompanying values in gray. b Thermogenic flexibility, measured as the change in Msum over the 3-week temperature acclimation treatment (post- minus pre-acclimation), for each population. Boxplots show the median values, the 25th and 75th percentiles (lower and upper margins of the box), and the minimum and maximum values ≤1.5 × IQR from the box margin (whiskers). Dots indicate individual measures (n = 95). Control birds (acclimated to 23 °C) in red; cold-acclimated birds (3 °C) in blue. For each population, the native Trange, number of individuals in each treatment (Control, Cold), and coefficient of variation for cold-acclimated individuals (CV) are shown below. Source data are provided in the Source Data file.

References

    1. Piersma T, Drent J. Phenotypic flexibility and the evolution of organismal design. Trends Ecol. Evolution. 2003;18:228–233. doi: 10.1016/S0169-5347(03)00036-3. - DOI
    1. Botero CA, Weissing FJ, Wright J, Rubenstein DR. Evolutionary tipping points in the capacity to adapt to environmental change. Proc. Natl Acad. Sci. USA. 2015;112:184–189. doi: 10.1073/pnas.1408589111. - DOI - PMC - PubMed
    1. Lande R. Evolution of phenotypic plasticity and environmental tolerance of a labile quantitative character in a fluctuating environment. J. Evol. Biol. 2014;27:866–875. doi: 10.1111/jeb.12360. - DOI - PubMed
    1. Piersma, T. & van Gils, J. A. The Flexible Phenotype: A Body-centred Integration of Ecology, Physiology, and Behaviour (Oxford Univ. Press, 2011).
    1. Moran NA. The evolutionary maintenance of alternative phenotypes. Am. Naturalist. 1992;139:971–989. doi: 10.1086/285369. - DOI

Publication types