. 2021 Jul 20;12(1):4415.
doi: 10.1038/s41467-021-24695-4.

Engineering self-organized criticality in living cells

Affiliations

Engineering self-organized criticality in living cells

Blai Vidiella et al. Nat Commun. .

Erratum in

Abstract

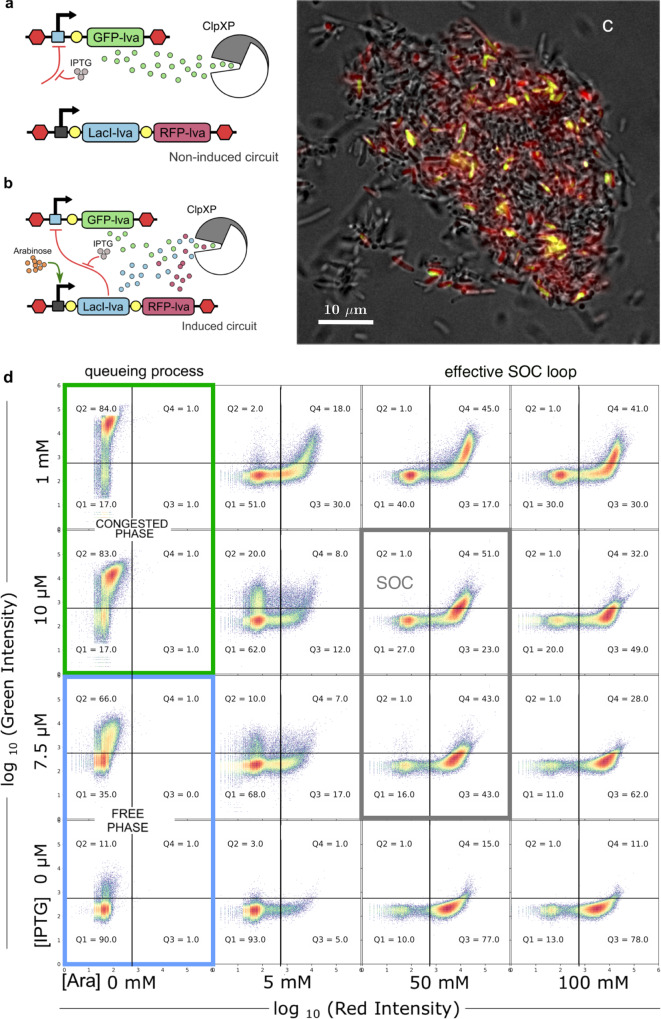
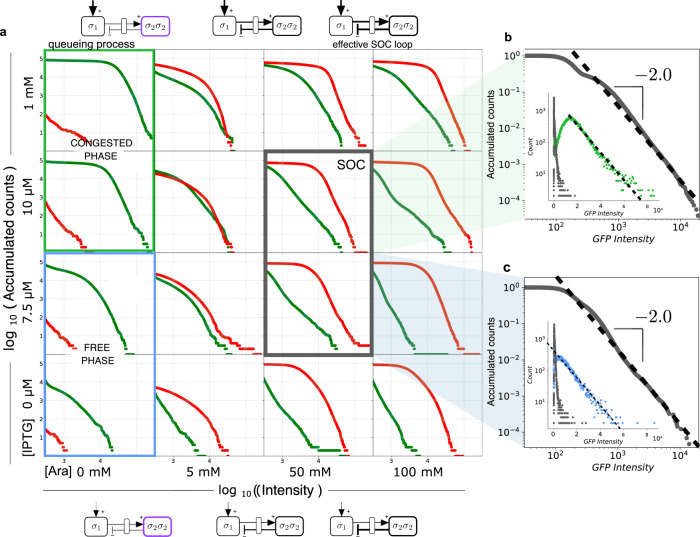
Complex dynamical fluctuations, from intracellular noise, brain dynamics or computer traffic display bursting dynamics consistent with a critical state between order and disorder. Living close to the critical point has adaptive advantages and it has been conjectured that evolution could select these critical states. Is this the case of living cells? A system can poise itself close to the critical point by means of the so-called self-organized criticality (SOC). In this paper we present an engineered gene network displaying SOC behaviour. This is achieved by exploiting the saturation of the proteolytic degradation machinery in E. coli cells by means of a negative feedback loop that reduces congestion. Our critical motif is built from a two-gene circuit, where SOC can be successfully implemented. The potential implications for both cellular dynamics and behaviour are discussed.


Conflict of interest statement

The authors declare no competing interests.

Figures

Fig. 1
Fig. 1. Paths to intracellular criticality.
Tunable critical dynamics can be found in simple genetic circuits (a) where a given gene (here coding for GFP-Iva) is constitutively expressed into a protein σ that decays and is also actively degraded by the cell proteolytic machinery (ClpXP). By tuning expression rate η (d), a critical rate ηc is found to separate a phase of efficient degradation from another involving congestion. In (b) the thick line indicates that few proteins are found for η < ηc (the proteolytic machinery efficiently degrades it) while it accumulates on the right side, due to congestion (light green; ClpXP fails to degrade all the incoming proteins). An alternative, non-externally tuned path is self-organised criticality (SOC), provided by the sandpile (c, adapted from @ricard_sole Oct. 2017). As grains of sand are slowly added at a rate η, the angle of the pile θ grows and only small avalanches will be observed. However, as the critical (maximum) θc is reached, avalanches of all sizes take place, reducing θ. The feedback between the order parameter (S) and the control parameter (θ) is summarised in (d). To facilitate the conditions enabling SOC, a two-gene circuit with negative feedback (e) allows mapping the sandpile feedback diagram (f). Here, both proteins compete for ClpXP (higher levels of σ1 also implies high values of σ2) and repression feedback is mediated by σ2σ2 (the Lac repressor dimer) with σ1 and σ2 acting as order and control parameters, respectively. Protein models generated using Pymol Software.
Fig. 2
Fig. 2. Nonlinear dynamics of the two-gene critical motif.
(ac) Orbits for Eqs. (1–2) in the (σ1, σ2) space with η2 = 10−3 (a), η2 = 10−2 (b), and η2 = 0.056 (c), setting η1 = 10−2, δ1,2 = 5 × 10−2, δcC = 10−2, K = θ = 10−3. The nullclines are plotted in red (dσ1/dt = 0) and blue (dσ2/dt = 0). The colour of the arrows of the vector field corresponds to their module (blue: small; red: large). The background colour shows the arrival times to the attractor (shorter times in yellow; longer times in violet). The stochastic dynamics of the model reveals a maximum in the CV when η2 ~ 10−2, as shown in panel (d) where the colours stand for μ = 0.5 (blue), μ = 1.0 (orange) and μ = 1.5 (green). The relative location of the deterministic flows is indicated by dashed lines. Three different values of the coupling parameter μ are used to show the robust nature of the maximum of CV, where the SOC motif has been tuned to generate fat-tailed behaviour, as shown in panel (e), where the hot map is overlapped to the phase space, showing a larger density close to the deterministic attractor as well as the fat-tailed scaling behaviour (f) with P>(σ1)~σ12 which gives γ ~ 3 for P(σ1). Here five distributions are shown for 5 independent runs along with their average (dark line). (g) Transition between free and congested phases (green curve, in linear-log scale), computed using the same parameter values as in (e) and (f), and located at η1 ≈ 0.02. The solid black line with dots shows how the value of the σ1 inhibition function, here labelled as η^(t), is tuned by the system itself driving it close to the transition value (see also Supplementary Figures 9–11). Here P(η1) is the probability of η^(t) to take different values of η1. By contrast, the flows and hot maps for the non-SOC circuit close to the queuing theory transition (h) have a Gaussian pattern (i) with exponential tails as shown by the straight lines in the linear-log insets (here η2 = 10−2 and μ = 0). The distributions are depicted with the violin plots in panel (j) for the indicated parameter values.
Fig. 3
Fig. 3. Engineered gene circuit implementing the SOC motif in E. coli.
Gene constructs considering non-induced (a) and induced (b) states. (c) Overlapped bright field and fluorescence images of bacteria-induced with Ara (100 mM) and IPTG (10 μM). Yellow bacteria express both GFP and RFP. d Flow cytometry dot plots (green vs red channel) of E. coli cultures exposed to different concentrations of IPTG and Ara. In the non-induced circuit (a), without Ara, the transition from noncongested proteolytic machinery phase (i.e. free phase, subcritical) to congested phase (supercritical) depends on the tunable GFP-lva production. As IPTG increases, so do the de-repression of GFP expression, ClpXP is not able to degrade the excess of GFP and most cells exhibit high green emission. When the circuit is induced (b), Ara triggers the expression of the LacI repressor and the RFP reporter, that are also degraded by the ClpXP complex. The increase of tagged proteins to be degraded contributes to the congestion of ClpXP but also the LacI repression helps to de-congest by reducing the tagged GFP expression. Hence, as Ara concentration is increased, a shift towards higher RFP levels along with dispersal and lower levels of GFP values is observed. This defines the parameter space domain (grey window) where the feedback loop required for SOC is at work. For the larger concentrations of IPTG and Ara, the SOC loop remains effective, at least within the limits of the experimentally explored parameter space. A SOC state is obtained in the presence of high Ara concentration around the IPTG values close to the queueing transition. Most cells (Q3 + Q4 ≈ 80%) are emitting in the red channel, but exhibit a broad range of green fluorescence levels, since this state is characterized by fluctuations associated with large bursts of GFP expression (the heterogeneous GFP expression is apparent in the yellow cells of (c) and in the histogram of Fig. 4). Microscope images of this experiment and FACS of more IPTG-Ara combinations are shown in Section III.D of SM and in the source data file.
Fig. 4
Fig. 4. Statistics and power-law distributions for SOC from the experiments.
a Cumulative (non-normalized) distributions P>(σ1,2) of GFP and RFP fluorescence levels, here plotted using green and red lines, respectively, for the same set of conditions shown in Fig. 3d. The candidate combinations leading to the SOC state (grey panels) are characterized by a broad range of GFP expression revealed by the tail associated with large bursts. In (b) and (c) two cumulative histograms are shown for (10 μM IPTG, 50 mM arabinose (Ara)) and (7.5 μM IPTG, 50 mM Ara), respectively. Both distributions are close to a scaling law P>(σ1)~σ12 thus leading to a scaling exponent γ ~ 3, consistent with the stochastic simulations. The insets display the comparison of the raw histograms of the congested state (green dots (b)) and free-phase (blue dots,(c)), respectively and the SOC state (grey dots) corresponding to the same IPTG conditions. Notice that, unlike the larger images, the x-axes of the insets are linear (so that exponential laws appear as straight lines). Cumulative distributions are shown for fluorescence levels above 102.5 (Q2, Q3, Q4 from Fig. 3). All cumulative distributions have obtained from a constant population size of 105 cells. Additional distributions with more detailed IPTG-Ara combinations are shown in Section III.D in the SM and source data are provided as a Source Data file.

References

    1. Rao CV, Wolf DM, Arkin AP. Control, exploitation and tolerance of intracellular noise. Nature. 2002;420:231–237. - PubMed
    1. Raj A, Van Oudenaarden A. Nature, nurture, or chance: stochastic gene expression and its consequences. Cell. 2008;135:216–226. - PMC - PubMed
    1. Eldar A, Elowitz MB. Functional roles for noise in genetic circuits. Nature. 2010;467:167–173. - PMC - PubMed
    1. Balázsi G, van Oudenaarden A, Collins JJ. Cellular decision making and biological noise: from microbes to mammals. Cell. 2011;144:910–925. - PMC - PubMed
    1. Solé R, Manrubia SC, Benton M, Kauffman S, Bak P. Criticality and scaling in evolutionary biology. Trends Ecol. Evol. 1999;14:156. - PubMed

Publication types

MeSH terms

Substances