. 2021 Jul 20;12(1):4405.
doi: 10.1038/s41467-021-24603-w.

Refractoriness of STING therapy is relieved by AKT inhibitor through effective vascular disruption in tumour

Affiliations

Refractoriness of STING therapy is relieved by AKT inhibitor through effective vascular disruption in tumour

Seung-Hwan Jeong et al. Nat Commun. .

Abstract

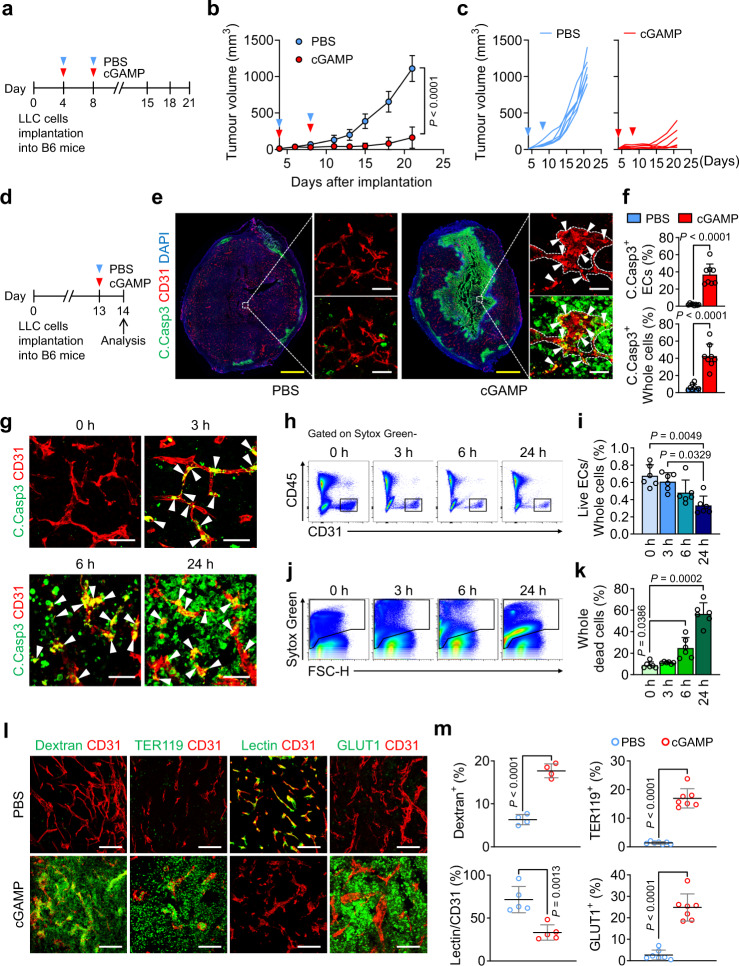
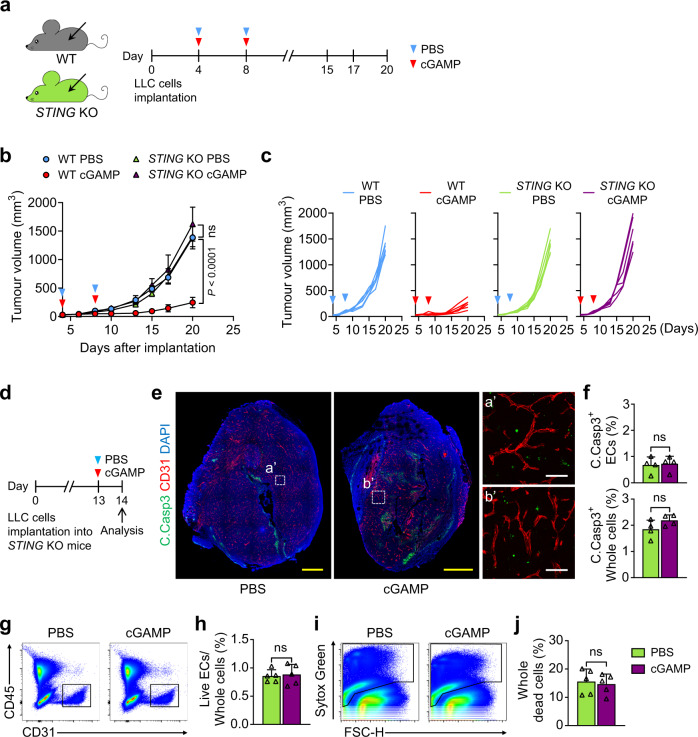
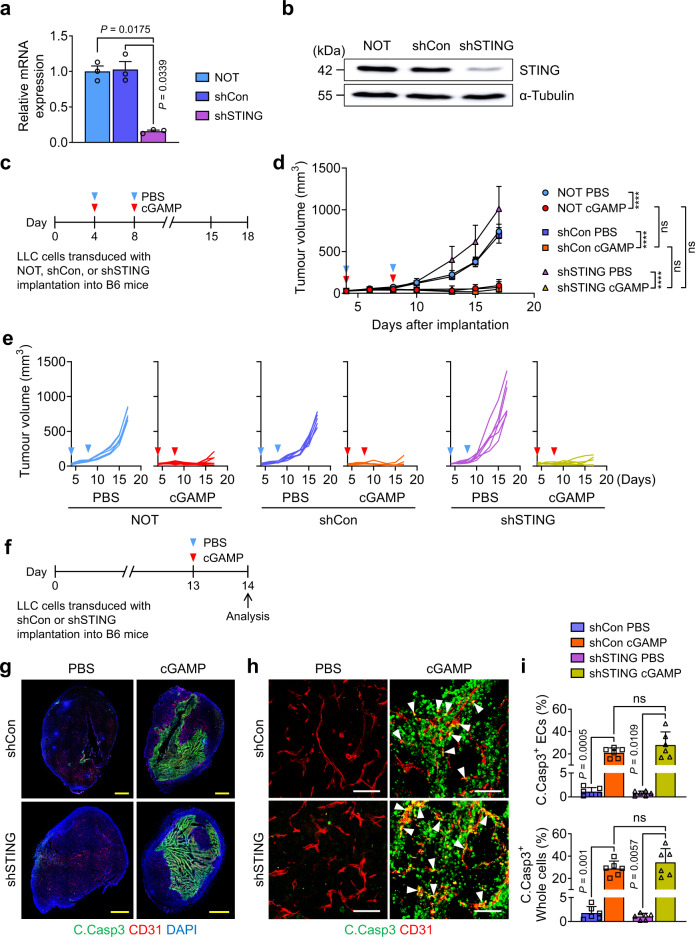
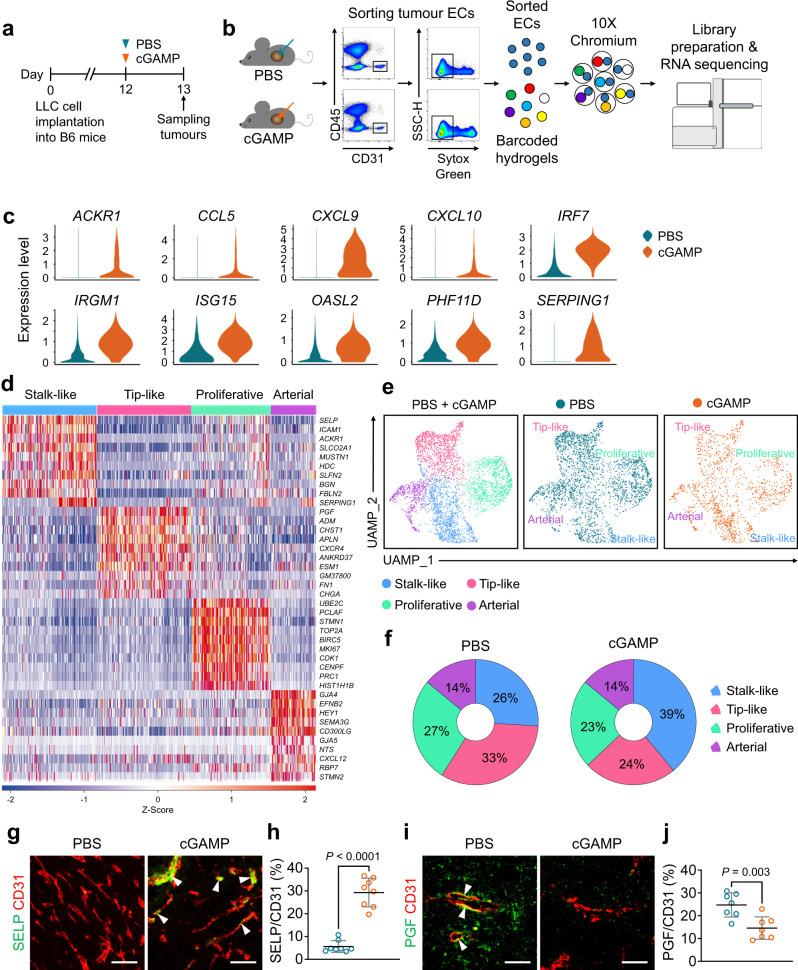
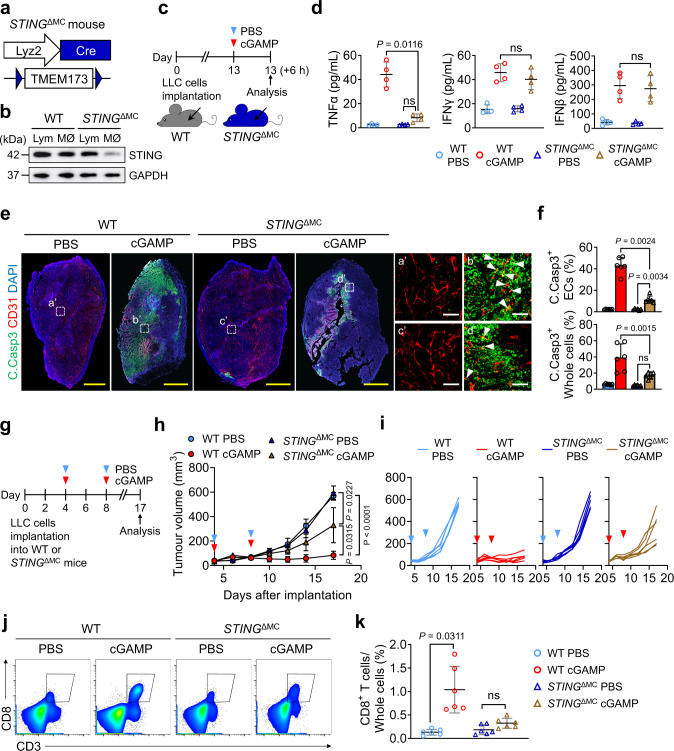
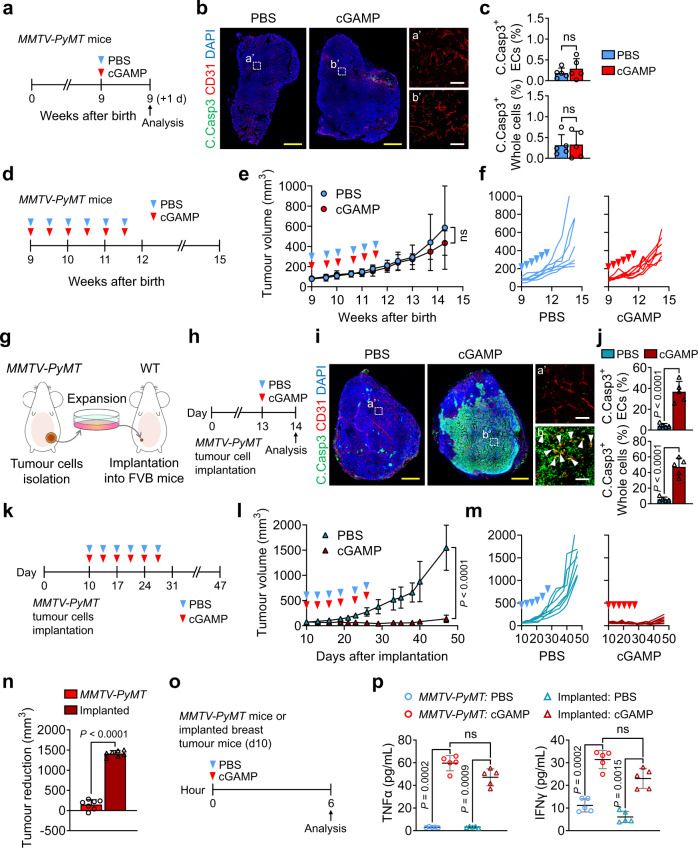
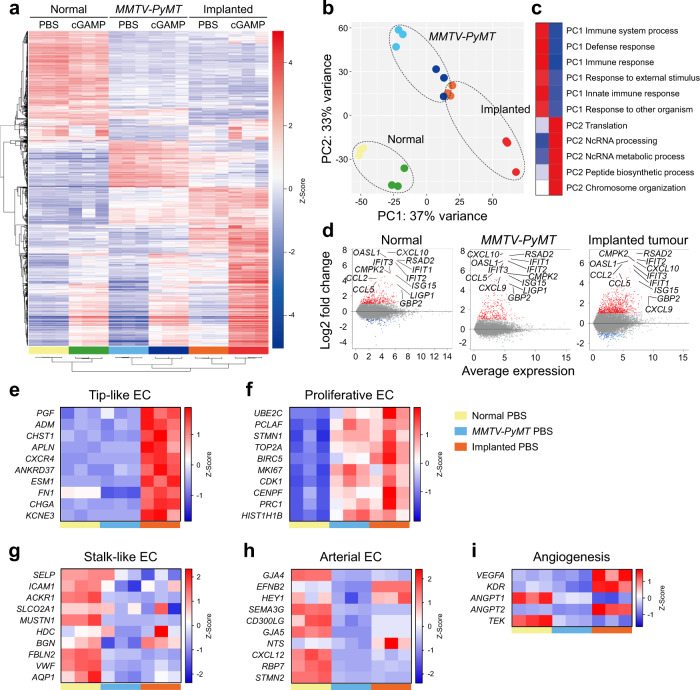
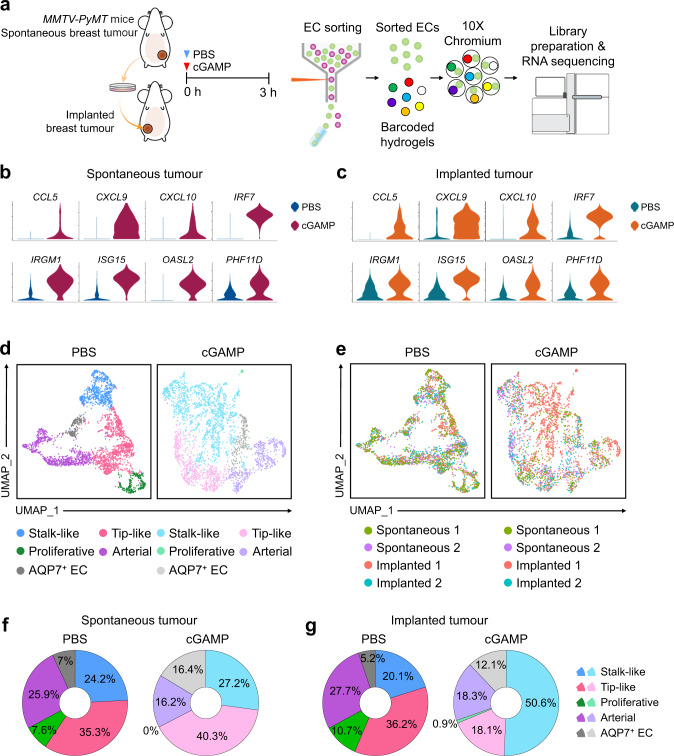
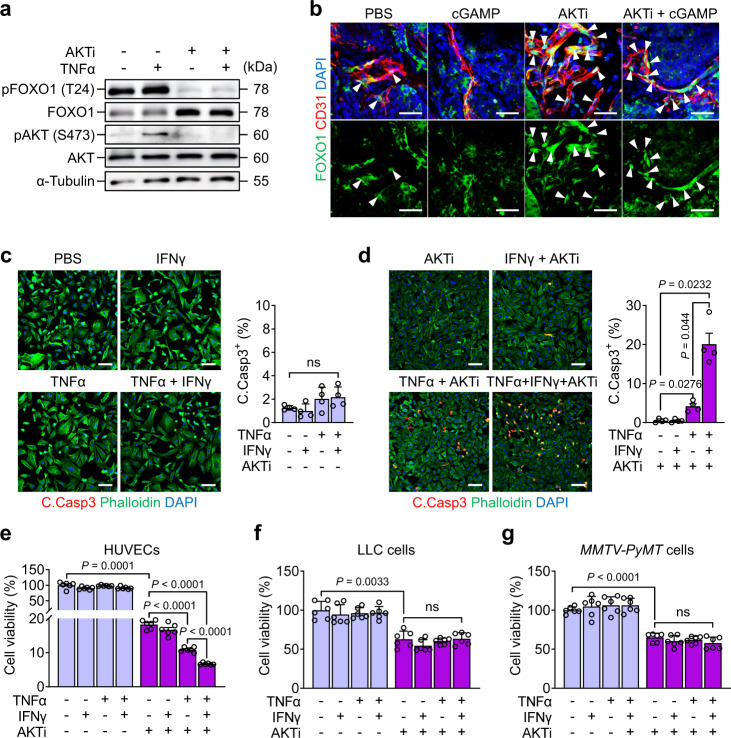
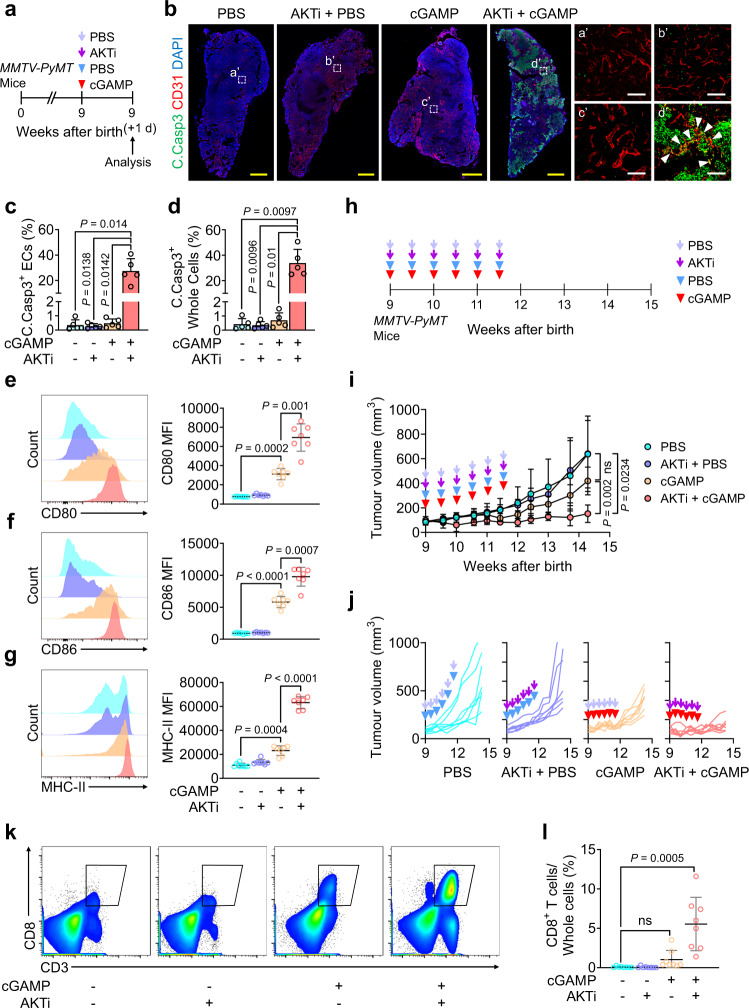
Stimulator of interferon genes (STING) promotes anti-tumour immunity by linking innate and adaptive immunity, but it remains unclear how intratumoural treatment with STING agonists yields anti-tumour effects. Here we demonstrate that intratumoural injection of the STING agonist cGAMP induces strong, rapid, and selective apoptosis of tumour endothelial cells (ECs) in implanted LLC tumour, melanoma and breast tumour, but not in spontaneous breast cancer and melanoma. In both implanted and spontaneous tumours, cGAMP greatly increases TNFα from tumour-associated myeloid cells. However, compared to spontaneous tumour ECs, implanted tumour ECs are more vulnerable to TNFα-TNFR1 signalling-mediated apoptosis, which promotes effective anti-tumour activity. The spontaneous tumour's refractoriness to cGAMP is abolished by co-treatment with AKT 1/2 inhibitor (AKTi). Combined treatment with cGAMP and AKTi induces extensive tumour EC apoptosis, leading to extensive tumour apoptosis and marked growth suppression of the spontaneous tumour. These findings propose an advanced avenue for treating primary tumours that are refractory to single STING agonist therapy.


Conflict of interest statement

The authors declare no competing interests.

Figures

Fig. 1
Fig. 1. Intratumoural injection of cGAMP strongly induces tumour vascular disruption in implanted LLC tumour.
a-c Diagram depicting generation of implanted LLC tumour in B6 mice and treatment schedule of intratumoural (i.t.) PBS or cGAMP. Comparison of LLC tumour growths. n = 6 mice/group from two independent experiments. Dots and bars indicate mean ± SD. Plot indicates each individual tumour growth. df Diagram depicting generation of LLC tumour, i.t. PBS or cGAMP treatment, and tumour sampling at 24 h later. Representative images and comparisons of apoptosis in tumour ECs and whole tumour cells (whole cells). Dashed lines demarcate tumour vascular lining, while white arrowheads indicate apoptotic ECs. Scale bars, 1.0 mm (yellow bars) and 50 μm (white bars). Each dot indicates a value from one mouse and n = 8 mice/group from two independent experiments. Vertical bars indicate mean ± SD. gk Representative images showing temporal responses of tumour ECs and whole tumour cells following i.t. cGAMP treatment in implanted LLC tumour. n = 6 mice/group. Note that progressive tumour EC apoptosis followed by extensive tumour cell apoptosis. Scale bars, 50 μm (g). Representative flow cytometry plots and comparisons showing gradual changes of live EC and dead cell populations. Each dot indicates a value from one mouse and n = 6 mice/group from three independent experiments. Vertical bars indicate mean ± SD. l, m Impaired vascular function 24 h after i.t. cGAMP treatment. Representative Images and comparisons of dextran leakage (n = 4 images/4 mice), TER119+ RBC leakage (n = 7 images/7 mice), lectin+ vascular perfusion (n = 5 images/5 mice) and GLUT1+ hypoxic area (n = 7 images/7 mice). Scale bars, 100 μm. Each dot indicates a value from one mouse from four independent experiments. Horizontal bars indicate mean ± SD. P values by two-tailed t-test (b, f, m), Kruskal–Wallis test followed by Dunn’s test (i) or Welch’s one-way ANOVA test followed by Dunnett’s T3 test (k). Source data are provided as a Source Data File.
Fig. 2
Fig. 2. cGAMP-induced tumour EC apoptosis is abrogated in STING KO mice.
ac Diagram depicting generation of implanted LLC tumour and treatment schedule of i.t. PBS or cGAMP in WT and STING KO mice. Comparison of LLC tumour growths. n = 6 mice/group from three independent experiments. Dots and bars indicate mean ± SD. Plot indicates each individual tumour growth. P values by Welch’s one-way ANOVA test followed by Dunnett’s T3 test. ns, not significant. dj Diagram depicting generation of implanted LLC tumour in STING KO mice, i.t. PBS or cGAMP treatment, and sampling of tumours at 24 h later. Representative images and comparisons of apoptosis in tumours EC and whole tumour cells (whole cells). Each dotted-line box region is magnified and displayed in the right panels. Scale bars, 1.0 mm (yellow) and 100 μm (white). Each dot indicates a value from one mouse and n = 4 mice/group from two independent experiments (f). Representative flow cytometry plots and comparisons of populations of live ECs and dead cells in whole tumour cells. Each dot indicates a value from one mouse and n = 5 mice from two independent experiments (h, j). Vertical bars indicate mean ± SD. P values by two-tailed t-test. ns, not significant. Source data are provided as a Source Data file.
Fig. 3
Fig. 3. STING pathway of tumour cells is not required for cGAMP-induced tumour EC apoptosis.
a, b mRNA and protein levels of STING in cultured LLC cells transduced with nothing (NOT), shControl (shCon) or shSTING. Each dot indicates a value from one sample and n = 3 from two independent experiments. Vertical bars indicate mean ± SD. ce Diagram depicting generation of implanted LLC tumour by injection of the LLC cells transduced with NOT, shCon or shSTING, and treatment schedule of i.t. PBS or cGAMP in B6 mice. Comparison of LLC tumour growths. n = 6 mice/group from three independent experiments. Dots and bars indicate mean ± SD. Plot indicates each individual tumour growth. fi Diagram depicting generation of implanted LLC tumour by injection of the LLC cells transduced with shCon or shSTING, i.t. PBS or cGAMP treatment, and sampling of tumours at 24 h later. Representative images and comparisons of apoptosis in tumour ECs and whole tumour cells (whole cells). White arrowheads indicate apoptotic ECs. Scale bars, 1.0 mm (yellow) and 100 μm (white). Each dot indicates a value from one mouse and n = 6 mice from four independent experiments. Vertical bars indicate mean ± SD. P values by Welch’s one-way ANOVA test followed by Dunnett’s T3 test (a, d, i). ****P < 0.0001; ns, not significant. Source data are provided as a Source Data file.
Fig. 4
Fig. 4. Tumour ECs of implanted LLC tumours are vulnerable to STING activation-induced apoptosis.
a, b Diagrams depicting generation of LLC tumour, i.t. PBS or cGAMP treatment, tumour sampling at 24 h after the treatment, isolation of tumour ECs by FACS, and scRNA-seq analysis using a droplet-based platform. c Violin plots depicting the normalized expression levels of top-ranked differentially expressed genes between PBS- and cGAMP- treated tumour ECs. d Heatmap visualizing distinctive expression profiles of tumour EC subpopulations. Scaled expression levels of top ten differentially expressed genes for the indicated each cluster are shown. e UMAP plots comparing four clusters of tumour ECs derived from PBS- or cGAMP-treated tumours by unsupervised clustering of integrated dataset. Each dot represents a single EC. f Donut plot showing composition and difference in tumour EC subpopulations between PBS- and cGAMP- treated tumour ECs. gj Representative images and comparisons of SELP+/CD31+ stalk-like ECs and PGF+/CD31+ tip-like ECs (white arrowheads) between PBS- and cGAMP-treated tumour ECs. Scale bars, 50 μm. Each dot indicates a value from one mouse and n = 8 mice/group for (g, h) and 7 mice/group for (i, j) from four independent experiments. Horizontal bars indicate mean ± SD. P values by two-tailed t-test. Source data are provided as a Source Data file.
Fig. 5
Fig. 5. TAMCs-derived TNFα is a crucial mediator for STING agonist-induced apoptosis of Tumour ECs.
a, b Diagram depicting generation of myeloid cell-specific STING-deleted (STINGΔMC) mice. Confirmation of STING depletion in macrophages (MØ) but not in lymphocytes (Lym) of STINGΔMC mice by immunoblotting from two independent experiments. c, d, Diagram depicting generation of implanted LLC tumour in WT and STINGΔMC mice, i.t. PBS or cGAMP treatment, and sampling of tumours at 6 h later. Comparisons of TNFα, IFNγ and IFNβ protein levels in tumour lysates treated with PBS or cGAMP between WT and STINGΔMC mice. Each dot indicates a value from one mouse and n = 4 mice/group from four independent experiments. Horizontal bars indicate mean ± SD. e, f LLC tumours were sampled 24 h after i.t. PBS or cGAMP injection in WT and STING ΔMC mice. Representative images and comparisons of apoptosis in tumour ECs (white arrowheads) and whole tumour cells (whole cells). Scale bars, 1.0 mm (yellow bars) and 100 μm (white bars). Each dot indicates a value from one mouse and n = 6 mice/group from four independent experiments. Vertical bars indicate mean ± SD. gk Diagram depicting schedule of LLC cells implantation, treatment, and sampling in WT and STINGΔMC mice. Comparisons of tumour growth. n = 6 mice/group from four independent experiments. Dots and bars indicate mean ± SD. Plot indicates each individual tumour growth. Representative flow cytometry plots and comparisons showing tumour infiltrating CD8+ T cell populations in whole tumour cells. n = 6 mice/group from four independent experiments. Horizontal bars indicate mean ± SD. P values by Welch’s one-way ANOVA test followed by Dunnett’s T3 test (d, f, h, k). ns, not significant. Source data are provided as a Source Data file.
Fig. 6
Fig. 6. cGAMP fails to induce tumour EC apoptosis and anti-tumour growth in MMTV-PyMT spontaneous breast cancer.
ac Diagram depicting treatment and sampling in 9 weeks-old MMTV-PyMT mice. Representative images and comparisons of apoptosis in tumour ECs and whole tumour cells (whole cells). Scale bars, 1.0 mm (yellow bars) and 100 μm (white bars). n = 5 mice/group from two independent experiments. Vertical bars indicate mean ± SD. df Diagram depicting treatment and sampling in 9 weeks-old MMTV-PyMT mice. Comparison of tumour growths. n = 7 mice/group from two independent experiments. Plots and bars indicate mean ± SD. Plot indicates each individual tumour growth. g Diagram depicting generation of an orthotopic implanted breast tumour in syngeneic FVB mice. h-j Diagram depicting treatment and sampling in implanted breast tumour mice. Representative images and comparisons of apoptosis in tumour ECs (white arrowheads) and whole tumour cells. Scale bars, 1.0 mm (yellow bars) and 100 μm (white bars). n = 5 mice/group from two independent experiments. Vertical bars indicate mean ± SD. km Diagram depicting treatment and tumour growth in implanted breast tumour mice. Comparisons of tumour growths. n = 7 mice/group from two independent experiments. Plot and bars indicate mean ± SD. Plot indicates each individual tumour growth. n Comparison of reduction of tumour volume by cGAMP treatment between spontaneous and implanted breast tumours at day 47 after the implantation. o, p Diagram depicting treatment and sampling 6 h later in 9-week-old MMTV-PyMT mice and its implanted breast tumour mice 10 day (d10) after implantation. Comparisons of TNFα and IFNγ levels in tumour lysates. n = 5 mice/group from four independent experiments. Horizontal bars indicate mean ± SD. P values by two-tailed t-test (c, e, j, l, n) or Welch’s one-way ANOVA test followed by Dunnett’s T3 test (p). ns, not significant. Source data are provided as a Source Data file.
Fig. 7
Fig. 7. Implanted breast tumour ECs exhibit angiogenic and inflammatory transcriptome profiles.
a Heatmap of the RNA-seq data of ECs from normal mammary pads, MMTV-PyMT spontaneous breast tumours, and implanted breast tumours (see Fig. 6). n = 3 mice/group from three independent experiments. b Principal component analysis (PCA) of the RNA-seq data. c Gene ontology analysis of PCA axis. d MA plots showing differentially expressed genes by cGAMP treatment in each group. ei Heatmaps comparing genes related to tip-like ECs, proliferative ECs, stalk-like ECs, arterial ECs, and angiogenesis in the ECs of normal mammary pads and spontaneous and implanted tumours treated with PBS.
Fig. 8
Fig. 8. Implanted, but not spontaneous, breast tumour ECs are vulnerable to STING activation-induced apoptosis.
a Schematic diagram for depicting treatment, sampling, and scRNA-seq of tumour ECs in MMTV-PyMT spontaneous and their implanted breast tumours treated with i.t. PBS or cGAMP. n = 2 mice/each group. b, c Violin plots depicting the normalized expression levels of top-ranked differentially expressed genes in spontaneous and implanted tumour ECs. d UMAP plots comparing five clusters of tumour ECs by unsupervised clustering, integrating datasets in spontaneous and implanted tumour ECs between PBS and cGAMP treatment. e The origin of datasets in each cluster. Each dot represents single cell. f, g Compositional differences of tumour EC subpopulations by treatments in spontaneous and implanted tumour ECs.
Fig. 9
Fig. 9. AKT inhibitor sensitizes cultured HUVECs to TNFα-induced apoptosis.
a Immunoblot analysis of FOXO1, phosphorylated FOXO1 at threonine 24 [pFOXO1 (T24)], AKT, phosphorylated AKT at serine 473 [pAKT (S473)] and α-tubulin in cultured HUVECs at 30 min after indicated treatments. Three independent experiments showed similar findings. b Representative images of FOXO1 subcellular localization in the ECs of LLC tumour. PBS (70 μl), cGAMP (14 μg/70 μl) or AKTi (50 mg/kg) was injected 3 h before sampling. White arrowheads indicate nuclear localization of FOXO1. Scale bars, 50 μm. Five independent experiments showed similar findings. c, d Representative images and comparison of apoptosis in cultured HUVECs treated with indicated agents. TNFα (200 ng/ml), IFNγ (300 ng/ml) or AKTi (10 μM) was added and incubated for 6 h. Scale bars, 100 μm. Dots indicate values from four independent experiments. Vertical bars indicate mean ± SD. P values by Welch’s one-way ANOVA test followed by Dunnett’s T3 test. ns, not significant. eg Viabilities of cultured HUVECs, LLC cells, and MMTV-PyMT tumour cells by indicated treatments. TNFα (200 ng/ml), IFNγ (300 ng/ml) or AKTi (10 μM) was added and incubated for 24 h. Dots indicate values from six independent experiments. Vertical bars indicate mean ± SD. P values by Welch’s one-way ANOVA test followed by Dunnett’s T3 test. ns, not significant. Source data are provided as a Source Data file.
Fig. 10
Fig. 10. AKT inhibitor potentiates STING activation-induced tumour EC apoptosis and anti-tumour effect in MMTV-PyMT spontaneous breast cancer.
ag Diagram depicting treatment and tumour sampling in MMTV-PyMT mice. b–d, Representative images of tumour vessels and apoptosis. Each dotted-line box region is magnified and displayed in right panels. White arrowheads indicated tumour EC apoptosis. Scale bars, 1.0;mm (yellow bars) and 100 μm (white bars). Comparisons of apoptosis of tumour ECs and whole tumour cells. Each dot indicates a value from one mouse and n = 5 mice/group from four independent experiments (c, d). Vertical bars indicate mean ± SD. eg Representative flow cytometry plots and comparisons of CD80, CD86, and MHC-II expression on the DCs in each TDLN. Each dot indicates a value from one mouse and n = 7 mice/group from four independent experiments (eg). Horizontal bars indicate mean ± SD. hj Diagram depicting treatment schedule in MMTV-PyMT mice. Comparisons of tumour growths. n = 7 mice/group from four independent experiments. Vertical bars indicate mean ± SD. Plots indicate each individual tumour growth. k, l AKTi or cGAMP was injected twice with 3-day interval in 9-week-old MMTV-PyMT mice and tumours were sampled 1 week later. Representative flow cytometry plots and comparison of CD8+ T cells. Each dot indicates a value from one mouse and n = 8 mice/group from four independent experiments. Horizontal bars indicate mean ± SD. P values by Welch’s one-way ANOVA test followed by Dunnett’s T3 test (cg, i) or Kruskal–Wallis test followed by Dunn’s test (l). ns, not significant. Source data are provided as a Source Data file.

References

    1. Vanpouille-Box C, Demaria S, Formenti SC, Galluzzi L. Cytosolic DNA sensing in organismal tumor control. Cancer Cell. 2018;34:361–378. doi: 10.1016/j.ccell.2018.05.013. - DOI - PubMed
    1. Barber GNSTING. Infection, inflammation and cancer. Nat. Rev. Immunol. 2015;15:760–770. doi: 10.1038/nri3921. - DOI - PMC - PubMed
    1. Bakhoum SF, et al. Chromosomal instability drives metastasis through a cytosolic DNA response. Nature. 2018;553:467–472. doi: 10.1038/nature25432. - DOI - PMC - PubMed
    1. Ablasser A, et al. Cell intrinsic immunity spreads to bystander cells via the intercellular transfer of cGAMP. Nature. 2013;503:530–534. doi: 10.1038/nature12640. - DOI - PMC - PubMed
    1. Sun L, Wu J, Du F, Chen X. Cyclic GMP-AMP synthase is a cytosolic DNA sensor that activates the type I interferon pathway. Science. 2013;339:786–791. doi: 10.1126/science.1232458. - DOI - PMC - PubMed

Publication types

MeSH terms

Substances