. 2021 Jul 20;11(1):14749.
doi: 10.1038/s41598-021-94201-9.

Modulation of spatial and temporal modules in lower limb muscle activations during walking with simulated reduced gravity

Affiliations

Modulation of spatial and temporal modules in lower limb muscle activations during walking with simulated reduced gravity

Shota Hagio et al. Sci Rep. .

Abstract

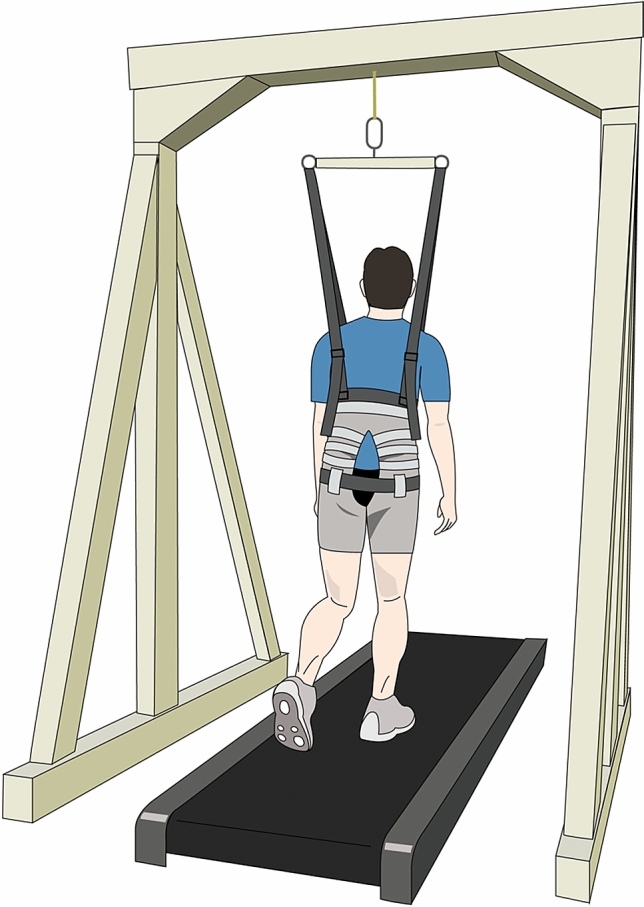
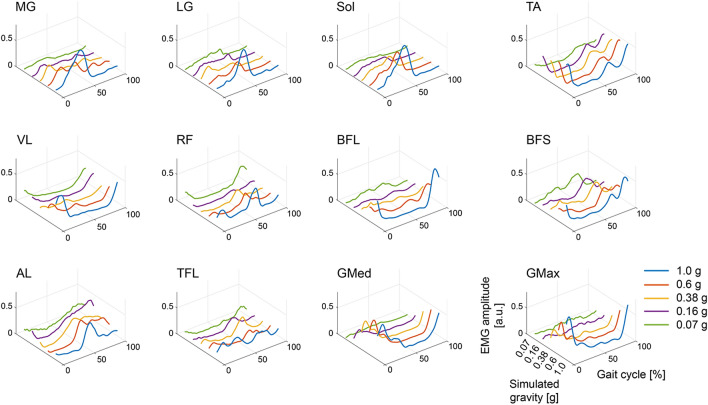
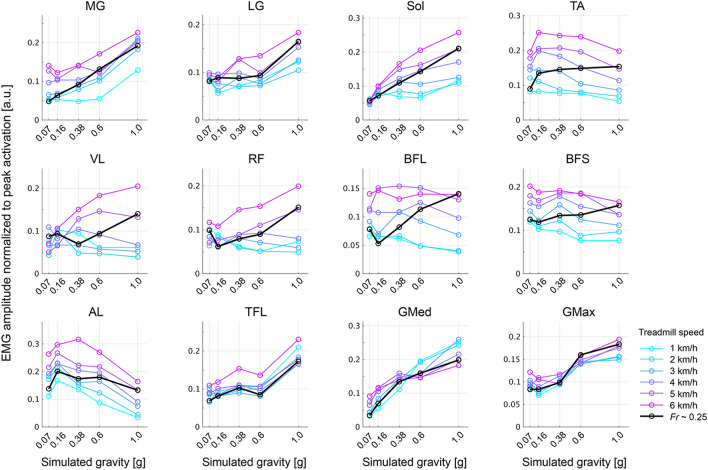
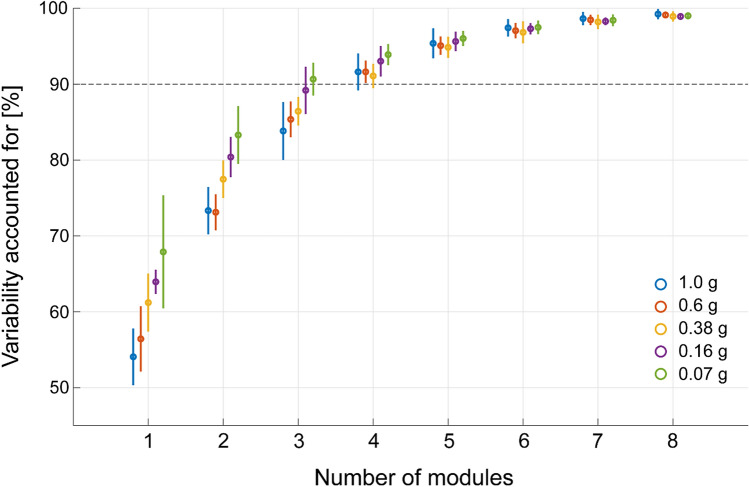
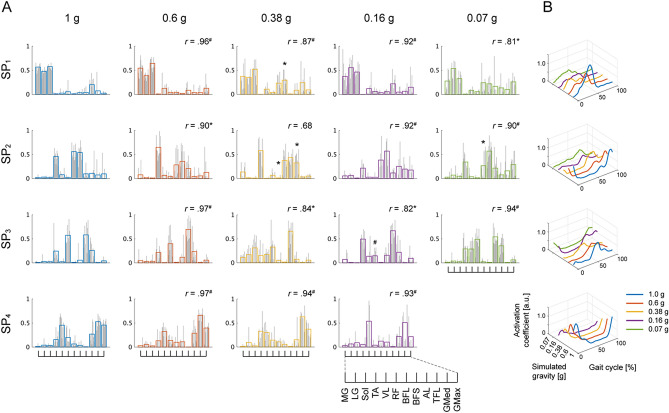
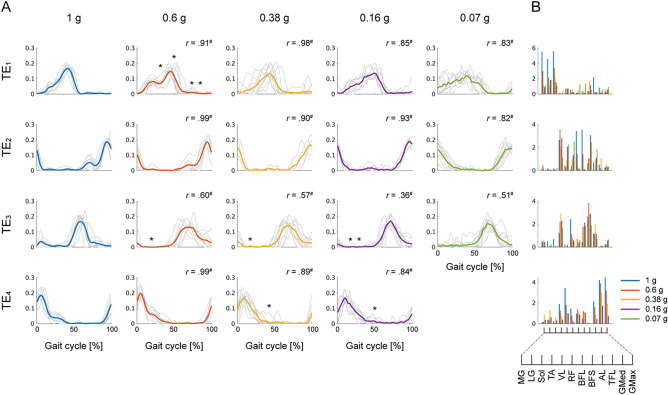
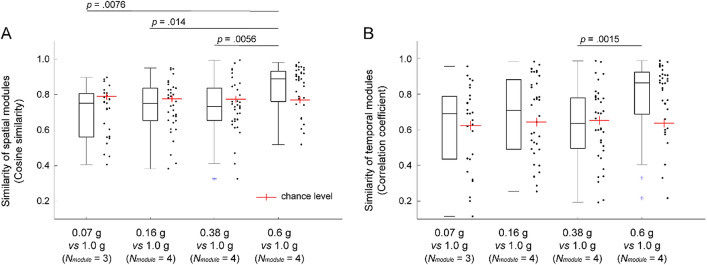
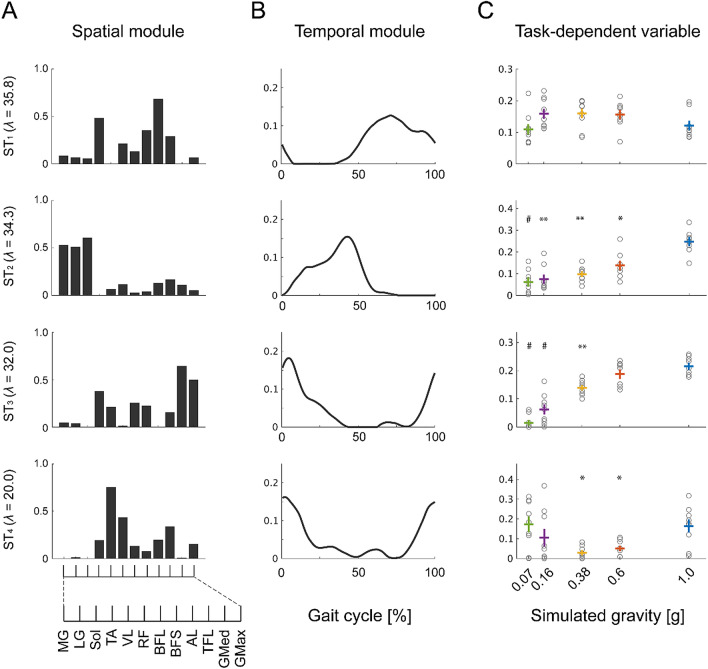
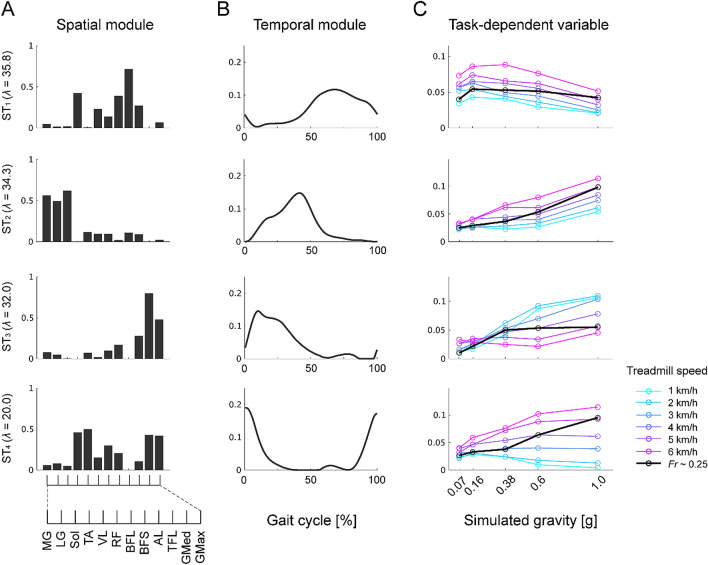
Gravity plays a crucial role in shaping patterned locomotor output to maintain dynamic stability during locomotion. The present study aimed to clarify the gravity-dependent regulation of modules that organize multiple muscle activities during walking in humans. Participants walked on a treadmill at seven speeds (1-6 km h-1 and a subject- and gravity-specific speed determined by the Froude number (Fr) corresponding to 0.25) while their body weight was partially supported by a lift to simulate walking with five levels of gravity conditions from 0.07 to 1 g. Modules, i.e., muscle-weighting vectors (spatial modules) and phase-dependent activation coefficients (temporal modules), were extracted from 12 lower-limb electromyographic (EMG) activities in each gravity (Fr ~ 0.25) using nonnegative matrix factorization. Additionally, a tensor decomposition model was fit to the EMG data to quantify variables depending on the gravity conditions and walking speed with prescribed spatial and temporal modules. The results demonstrated that muscle activity could be explained by four modules from 1 to 0.16 g and three modules at 0.07 g, and the modules were shared for both spatial and temporal components among the gravity conditions. The task-dependent variables of the modules acting on the supporting phase linearly decreased with decreasing gravity, whereas that of the module contributing to activation prior to foot contact showed nonlinear U-shaped modulation. Moreover, the profiles of the gravity-dependent modulation changed as a function of walking speed. In conclusion, reduced gravity walking was achieved by regulating the contribution of prescribed spatial and temporal coordination in muscle activities.


Conflict of interest statement

The authors declare no competing interests.

Figures

Figure 1
Figure 1
Reduced gravity simulator during walking. Participants walked on a treadmill while a body weight support system vertically pulled up on the participants’ torsos using a harness attached to their thighs and waist to reduce the load on supporting legs corresponding to 0, 40, 62, 84, or 93% of their body weights. This figure was created by one of the authors of this paper, Shota Hagio, using Adobe Illustrator 2020 (Adobe Inc., San Jose, CA, USA; https://www.adobe.com/jp/products/illustrator.html).
Figure 2
Figure 2
Muscle activity across each gravity. Rectified and filtered electromyographic (EMG) activity normalized to the peak activity in a gravity condition of 1 g are shown. The activation profiles for the individual gravity levels (1 g, 0.6 g, 0.38 g, 0.16 g, and 0.07 g) are distinguished by colour. Each data point is an average across all participants and 10 gait cycles (from the onset of the right leg to the next; normalized to 200 time bins) at a walking speed corresponding to the Froude number (Fr) ~ 0.25. The abbreviations of the muscles are as follows: medial head of the gastrocnemius muscle (MG), lateral head of the gastrocnemius muscle (LG), soleus (SOL), tibialis anterior (TA), vastus intermedius (VL), rectus femoris (RF), biceps femoris (long head, BFL), biceps femoris (short head, BFS), adductor longus (AL), tensor fasciae latae (TFL), gluteus medius (GMed), and gluteus maximus (GMax).
Figure 3
Figure 3
Mean muscle activity over time for all gravity levels and treadmill speeds. The processed EMGs shown in Fig. 2 are averaged across a series of gait cycles. The circles and lines for the individual treadmill speeds (1–6 km/h and speed corresponding to Fr ~ 0.25) are distinguished by colour.
Figure 4
Figure 4
Goodness of fit of the EMG data reconstruction. The variability of the original EMG data matrix accounted for by 1–8 modules is shown. The circles and lines for the individual gravity levels are distinguished by colour. Each data point and bar are an average ± standard deviation across participants at a speed corresponding to Fr ~ 0.25.
Figure 5
Figure 5
Modules clustered based on the spatial modules. Modules extracted from the EMG data matrix at Fr ~ 0.25 are shown. (A) The bar graphs represent weighting vectors for each muscle, i.e., a spatial module. Spatial modules identified from all participants were classified into a set of 4 clusters in each gravity level. The grey individual bar graph indicates a spatial module identified in each participant, and the coloured solid bar graph indicates the average over participants. (B) The line plots indicate the amplitude of the activation coefficient, i.e., a temporal module, averaged across participants. The different columns of the spatial modules and different colours of the temporal modules denote the 5 different gravity levels. The spatial modules corresponding to the same cluster, i.e., SP1 to SP4, and the corresponding temporal modules are arranged in the same row. The similarity of the spatial modules between the gravity condition of 1 g and each of the other gravity levels in each cluster (SP1-4) is shown as the cosine similarity (r). Symbols (*, #) indicate a significant difference in the weighting vectors of all or each muscle; *p < 0.05 and #p < 0.01.
Figure 6
Figure 6
Modules clustered based on the temporal modules. Modules extracted from the EMG data matrix at Fr ~ 0.25 are shown. (A) The line plots represent a temporal module. Temporal modules identified from all participants were classified into a set of 4 clusters in each gravity level. The grey individual line indicates a temporal module identified in each participant, and the coloured solid line indicates the average. (B) The bar graphs indicate spatial modules averaged across participants. The different columns of the temporal modules and different colours of the spatial modules represent the 5 different gravity levels. The temporal modules corresponding to the same cluster, i.e., TE1 to TE4, and the corresponding spatial modules are arranged in the same row. The similarity of the temporal modules between the gravity condition of 1 g and each of the other gravity levels in each cluster (TE1-4) is shown as the correlation coefficient (r). Symbols (*, #) indicate a significant difference in the activation coefficients of all or each phase; *p < 0.05 and #p < 0.01.
Figure 7
Figure 7
Structural change in the modules. The similarity of the spatial (A) and temporal (B) modules between the gravity condition of 1 g and each of the remaining gravity levels was calculated across all pairs of modules that were matched to each other by maximizing the cosine similarity between each spatial module pair and the correlation coefficient between each temporal module pair. Each dot indicates the similarity of each module pair, and the boxplot represents their distribution. The red crossed line indicates the chance level.
Figure 8
Figure 8
Spatial and temporal modules and task-dependent variables. Spatial (A) and temporal (B) modules and corresponding task-dependent variables (C) extracted from the EMG data tensor at Fr ~ 0.25 are shown. λ denotes the scaling factor. Each circle of the task-dependent variables indicates the data for individual participants. The mean and standard error of the means are represented as horizontal and vertical lines of a coloured crossed line in each gravity level. Symbols (*, #) indicate a significant difference in the task-dependent variables between a gravity condition of 1 g and the other gravity levels; *p < 0.05, **p < 0.01 and #p < 0.001.
Figure 9
Figure 9
Spatial and temporal modules and task-dependent variables across walking speeds. Spatial (A) and temporal (B) modules and corresponding task-dependent variables (C) extracted from the EMG data tensor at 7 walking speeds (1–6 km/h and a speed corresponding to Fr ~ 0.25) are shown. λ denotes the scaling factor. The circles and lines for the task-dependent variables in the individual treadmill speed are distinguished by colour.

Similar articles

Cited by

References

    1. Lacquaniti F, et al. Human locomotion in hypogravity: From basic research to clinical applications. Front. Physiol. 2017;8:1293–1318. doi: 10.3389/fphys.2017.00893. - DOI - PMC - PubMed
    1. Sylos-Labini F, Lacquaniti F, Ivanenko YP. Human locomotion under reduced gravity conditions: Biomechanical and neurophysiological considerations. Biomed. Res. Int. 2014;2014:1–12. doi: 10.1155/2014/547242. - DOI - PMC - PubMed
    1. Ritzmann, R., Gollhofer, A. & Freyler, K. In Sensory Motor and Behavioral Research in Space (eds Hilbig, R. et al.) 1–36 (Springer International Publishing, 2017).
    1. White RJ, Averner M. Humans in space. Nature. 2001;409:1115–1118. doi: 10.1038/35059243. - DOI - PubMed
    1. White O, et al. Towards human exploration of space: The THESEUS review series on neurophysiology research priorities. npj Microgravity. 2016;2:1. doi: 10.1038/npjmgrav.2016.23. - DOI - PMC - PubMed

Publication types