. 2022 Jan;16(1):178-189.
doi: 10.1038/s41396-021-01053-2. Epub 2021 Jul 20.

Seasonal niche differentiation among closely related marine bacteria

Affiliations

Seasonal niche differentiation among closely related marine bacteria

Adrià Auladell et al. ISME J. 2022 Jan.

Abstract

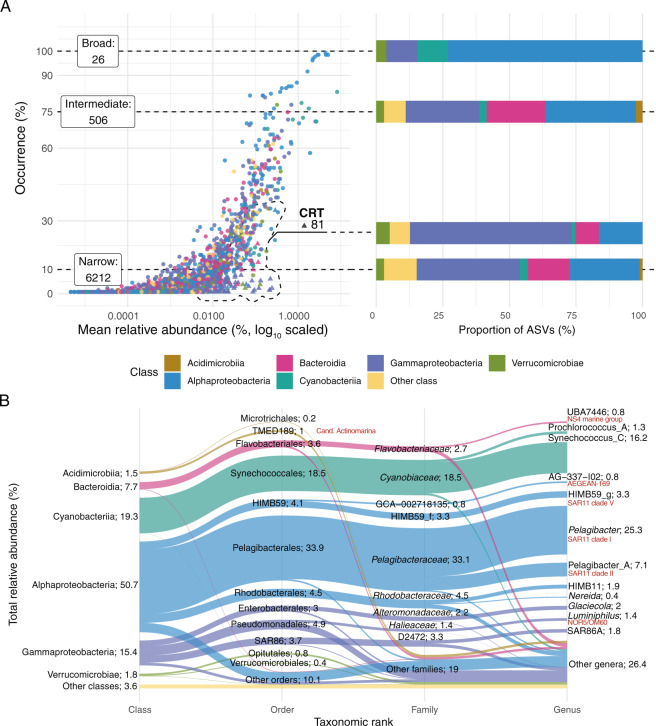
Bacteria display dynamic abundance fluctuations over time in marine environments, where they play key biogeochemical roles. Here, we characterized the seasonal dynamics of marine bacteria in a coastal oligotrophic time series station, tested how similar the temporal niche of closely related taxa is, and what are the environmental parameters modulating their seasonal abundance patterns. We further explored how conserved the niche is at higher taxonomic levels. The community presented recurrent patterns of seasonality for 297 out of 6825 amplicon sequence variants (ASVs), which constituted almost half of the total relative abundance (47%). For certain genera, niche similarity decreased as nucleotide divergence in the 16S rRNA gene increased, a pattern compatible with the selection of similar taxa through environmental filtering. Additionally, we observed evidence of seasonal differentiation within various genera as seen by the distinct seasonal patterns of closely related taxa. At broader taxonomic levels, coherent seasonal trends did not exist at the class level, while the order and family ranks depended on the patterns that existed at the genus level. This study identifies the coexistence of closely related taxa for some bacterial groups and seasonal differentiation for others in a coastal marine environment subjected to a strong seasonality.


Conflict of interest statement

The authors declare no competing interests.

Figures

Fig. 1
Fig. 1. Community structure in the Blanes Bay Microbial Observatory.
A Distribution of the different ASV types (broad, narrow or intermediate, and conditionally rare taxa, CRT). The X axis indicates the occurrence (% of samples) and the Y axis corresponds to the mean relative abundance (%) over the time series. Dotted lines delimitate the distributions (the numbers of ASVs of each type are displayed in the label) and connect to a box indicating the number of ASVs for each distribution and a bar plot colored by taxonomy at the class rank. CRT taxa are following a bimodal distribution and present ≥1% relative abundance in at least one sample. B Alluvial plot showing the total relative abundance distribution of Blanes Bay taxa across different taxonomic ranks (class, order, family, and genus). The height of the sections displays the relative abundance (indicated in the text; the total is 100%). The SILVA nomenclature is displayed in red next to the corresponding GTDB database nomenclature.
Fig. 2
Fig. 2. Examples of seasonal differentiation among closely related ASVs conforming the same OTU at 99% clustering.
A Temporal abundance trends. The X axis presents the month and the Y axis presents the centered logarithm ratio abundance. A generalized additive model smooth is adjusted to the data points. B Heatmaps presenting the nucleotide divergence between each ASV pair (number of mismatches after alignment). Five nucleotide divergence equals to a median sequence identity of 98.8%.
Fig. 3
Fig. 3. Relationship between the proportionality of change (Rho, Y axis) and the nucleotide divergence (mismatches after alignment, X axis).
Only genera with more than 3 ASVs at less than 5 nucleotide divergences were evaluated. Gray and black lines represent the linear relationship between the two variables (black indicates statistical significance). The p value and the R2 are displayed for the significant regressions. See Supplementary Table 2 for the correspondence between GTDB and SILVA nomenclature.
Fig. 4
Fig. 4
A Significant models among ASVs from HIMB59, Pelagibacter, Pelagibacter_A, SAR86 and Synechococcus genera (rows) and various environmental parameters (columns). The coefficient estimate indicates positive or negative responses to the parameter and is shown with a 95% confidence interval. The color corresponds to the different ASVs within a genus (only the top 8 more abundant ASVs are colored, the other ASVs are shown in gray). ASVs are ordered through a hierarchical clustering based on nucleotide divergence. B Generalized additive model fits between the ASV centered logarithm ratio abundances and the parameter value distribution for the significant ASVs in the upper plot. Panels and ASV colors shown as in A. PNF Phototrophic nanoflagellates, HNF Heterotrophic nanoflagellates.
Fig. 5
Fig. 5. Density distribution of the peak normalized power statistic (as proxy for seasonality) for each rank level in the Alphaproteobacteria, Gammaproteobacteria, and Bacteroidia classes.
The dotted lines indicate the used threshold for seasonality (q ≤ 0.05 and PN ≥ 10).

References

    1. Fuhrman JA, Cram JA, Needham DM. Marine microbial community dynamics and their ecological interpretation. Nat Rev Microbiol. 2015;13:133–46. - PubMed
    1. Falkowski P. Ocean science: the power of plankton. Nature. 2012;483:S17–20. - PubMed
    1. Bunse C, Pinhassi J. Marine bacterioplankton seasonal succession dynamics. Trends Microbiol. 2017;25:1–12. - PubMed
    1. Buttigieg PL, Fadeev E, Bienhold C, Hehemann L, Offre P, Boetius A. Marine microbes in 4D-using time series observation to assess the dynamics of the ocean microbiome and its links to ocean health. Curr Opin Microbiol. 2018;43:169–85. - PubMed
    1. Eiler A, Hayakawa DH, Rappé MS. Non-random assembly of bacterioplankton communities in the subtropical North Pacific Ocean. Front Microbiol. 2011;2. - PMC - PubMed

Publication types

Substances