

Identification of Underlying Hub Genes Associated with Hypertrophic Cardiomyopathy by Integrated Bioinformatics Analysis
- PMID: 34285551
- PMCID: PMC8285300
- DOI: 10.2147/PGPM.S314880
Identification of Underlying Hub Genes Associated with Hypertrophic Cardiomyopathy by Integrated Bioinformatics Analysis
Abstract
Background: Considered as one of the major reasons of sudden cardiac death, hypertrophic cardiomyopathy (HCM) is a common inherited cardiovascular disease. However, effective treatment for HCM is still lacking. Identification of hub gene may be a powerful tool for discovering potential therapeutic targets and candidate biomarkers.
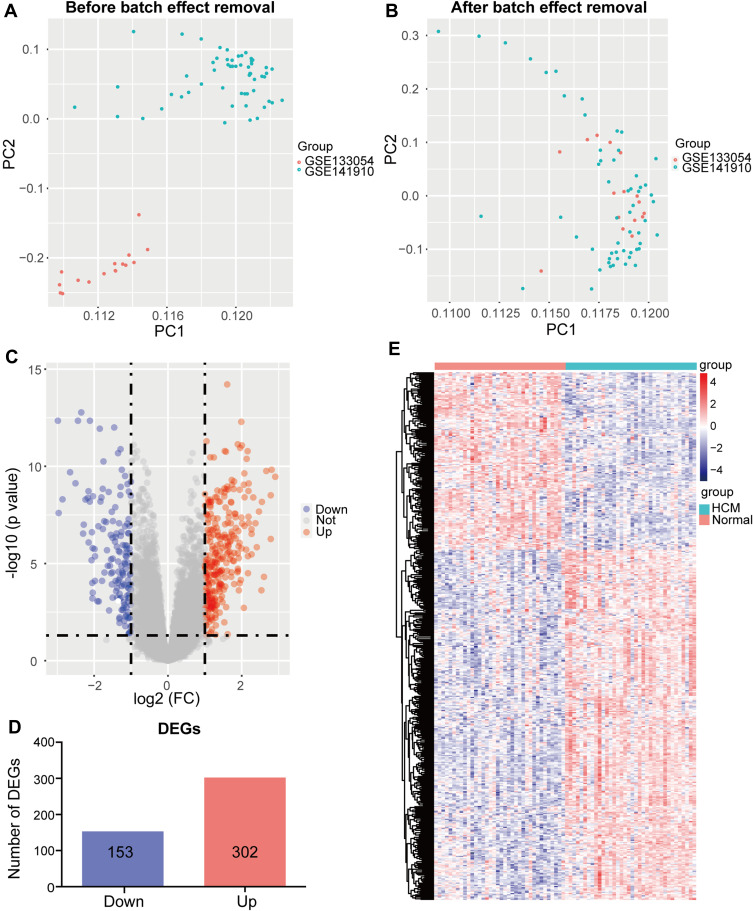
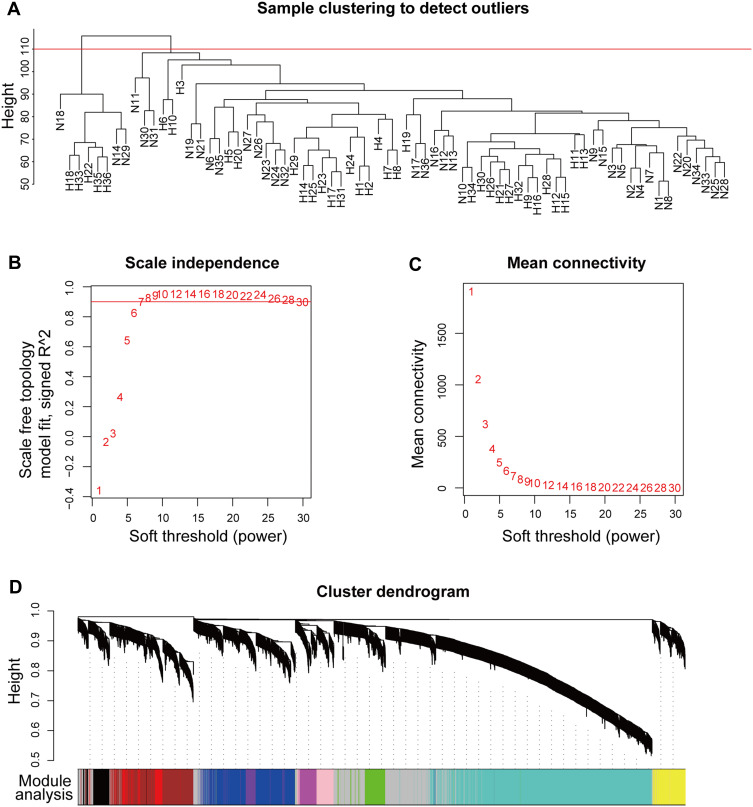
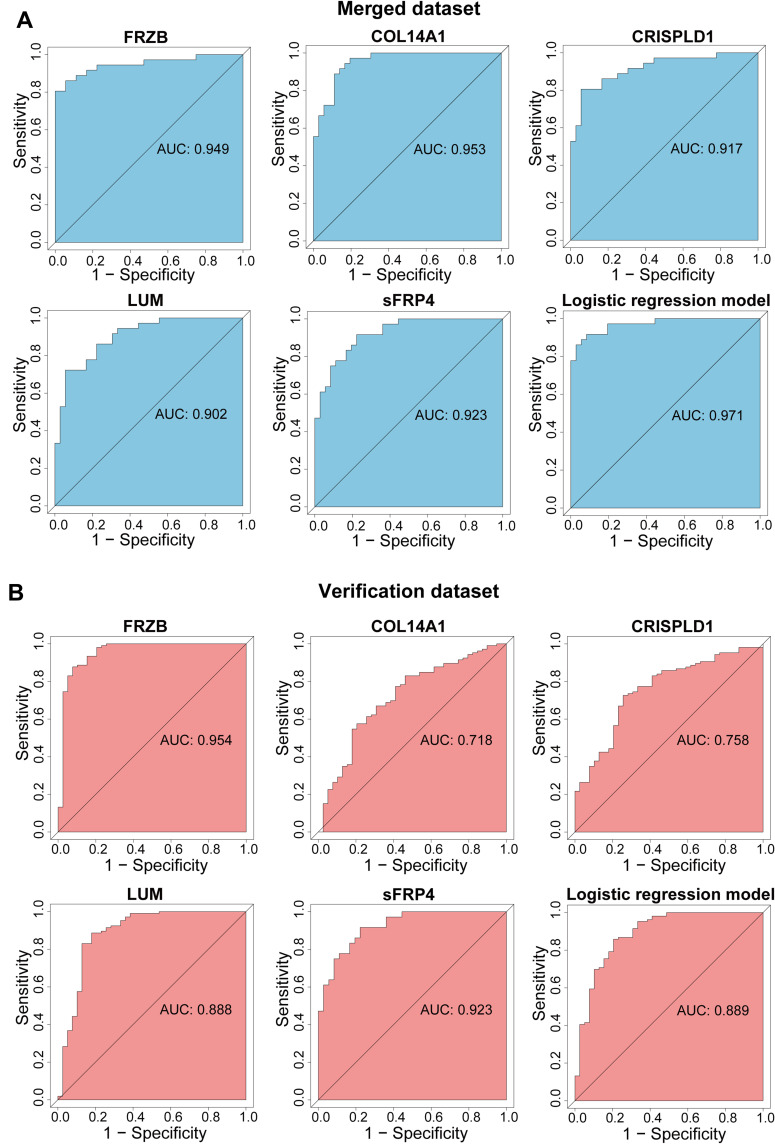
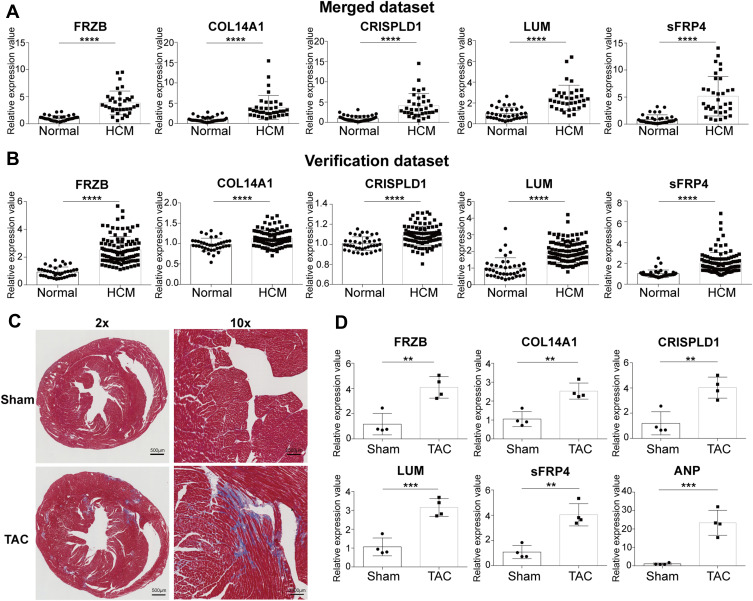
Methods: We analysed three gene expression datasets for HCM from the Gene Expression Omnibus. Two of them were merged by "sva" package. The merged dataset was used for analysis while the other dataset was used for validation. Following this, a weighted gene coexpression network analysis (WGCNA) was performed, and the key module most related to HCM was identified. Based on the intramodular connectivity, we identified the potential hub genes. Then, a receiver operating characteristic curve analysis was performed to verify the diagnostic values of hub genes. Finally, we validated changes of hub genes, for genetic transcription and protein expression levels, in datasets of HCM patients and myocardium of transverse aortic constriction (TAC) mice.
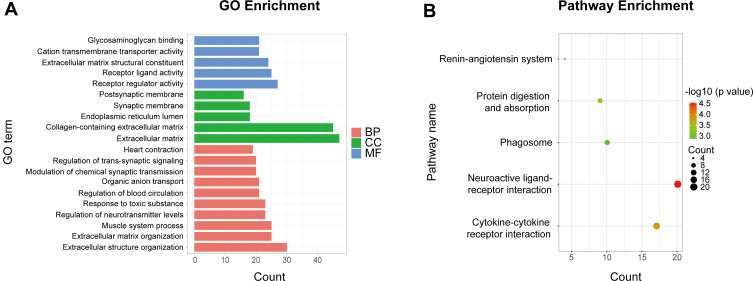
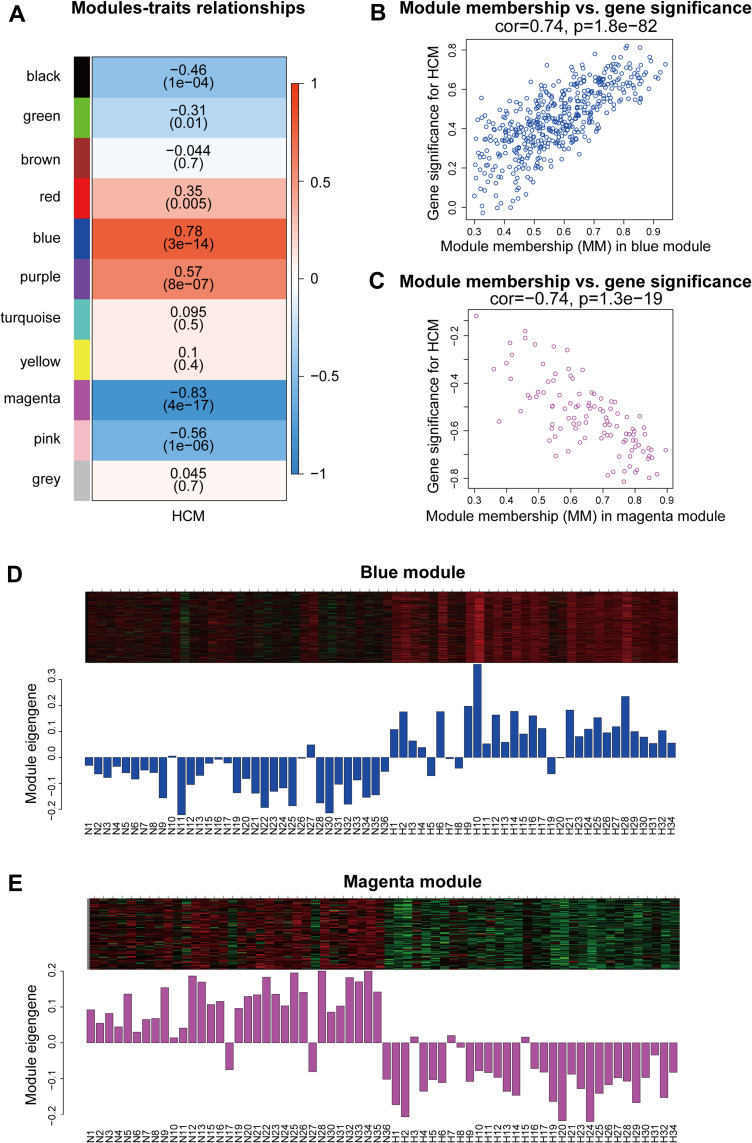
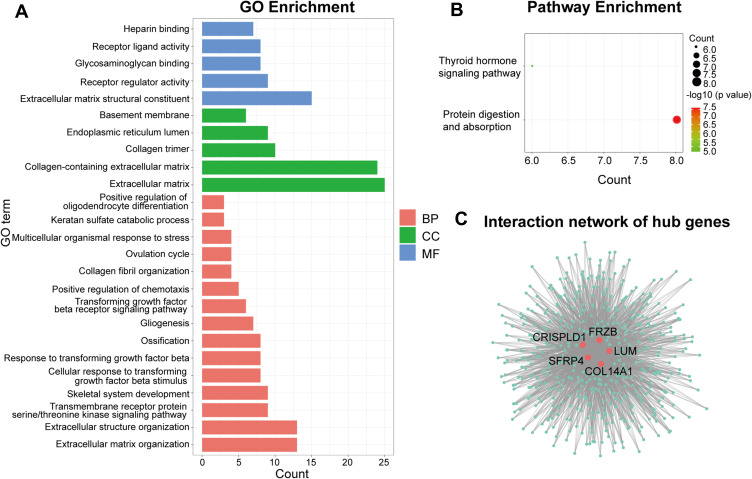
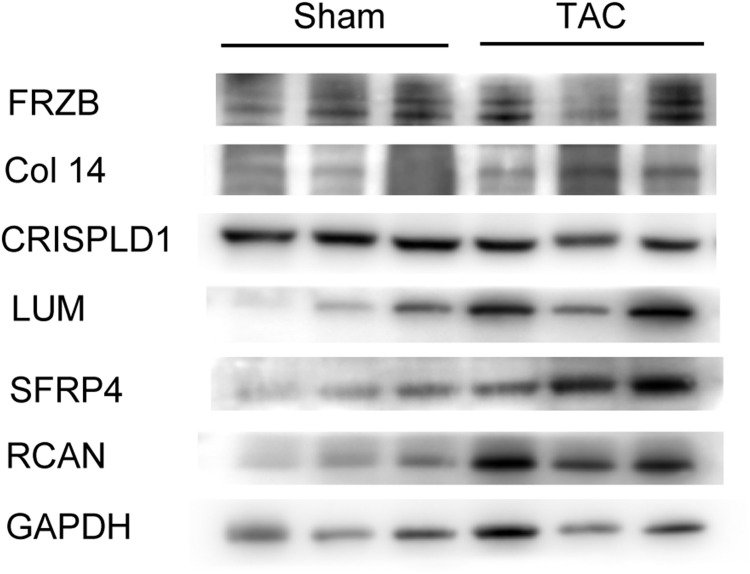
Results: In the merged dataset, a total of 455 differentially expressed genes (DEGs) were identified from normal and hypertrophic myocardium. In WGCNA, the blue module was identified as the key module and the genes in this module showed a high positive correlation with HCM. Functional enrichment analysis of DEGs and key module revealed that the extracellular matrix, fibrosis, and neurohormone pathways played important roles in HCM. FRZB, COL14A1, CRISPLD1, LUM, and sFRP4 were identified as hub genes in the key module. These genes showed a good predictive value for HCM and were significantly up-regulated in HCM patients and TAC mice. We also found protein expression of LUM and sFRP4 increased in myocardium of TAC mice.
Conclusion: This study revealed that five hub genes are involved in the occurrence and development of HCM, and they are potentially to be used as therapeutic targets and biomarkers for HCM.
Keywords: HCM; WGCNA; bioinformatics analysis; biomarkers; hub gene; hypertrophic cardiomyopathy; weighted gene coexpression network analysis.
© 2021 Ma et al.
Conflict of interest statement
The authors declare that they have no conflict of interest.
Figures
Similar articles
-
Identification of the Immune Status of Hypertrophic Cardiomyopathy by Integrated Analysis of Bulk- and Single-Cell RNA Sequencing Data.Comput Math Methods Med. 2022 Oct 4;2022:7153491. doi: 10.1155/2022/7153491. eCollection 2022. Comput Math Methods Med. 2022. Retraction in: Comput Math Methods Med. 2023 Nov 29;2023:9865861. doi: 10.1155/2023/9865861. PMID: 36238494 Free PMC article. Retracted.
-
Weighted gene co-expression network analysis revealed key biomarkers associated with the diagnosis of hypertrophic cardiomyopathy.Hereditas. 2020 Oct 24;157(1):42. doi: 10.1186/s41065-020-00155-9. Hereditas. 2020. PMID: 33099311 Free PMC article.
-
Dysfunctional network of hub genes in hypertrophic cardiomyopathy patients.Am J Transl Res. 2022 Dec 15;14(12):8918-8933. eCollection 2022. Am J Transl Res. 2022. PMID: 36628247 Free PMC article.
-
Identification of biomarkers correlated with hypertrophic cardiomyopathy with co-expression analysis.J Cell Physiol. 2019 Dec;234(12):21999-22008. doi: 10.1002/jcp.28762. Epub 2019 May 6. J Cell Physiol. 2019. PMID: 31059139
-
Identification and verification of promising diagnostic biomarkers in patients with hypertrophic cardiomyopathy associate with immune cell infiltration characteristics.Life Sci. 2021 Nov 15;285:119956. doi: 10.1016/j.lfs.2021.119956. Epub 2021 Sep 11. Life Sci. 2021. PMID: 34520765
Cited by
-
Exploration of Key Immune-Related Transcriptomes Associated with Doxorubicin-Induced Cardiotoxicity in Patients with Breast Cancer.Cardiovasc Toxicol. 2023 Oct;23(9-10):329-348. doi: 10.1007/s12012-023-09806-5. Epub 2023 Sep 8. Cardiovasc Toxicol. 2023. PMID: 37684436 Free PMC article.
-
Identifying OGN as a Biomarker Covering Multiple Pathogenic Pathways for Diagnosing Heart Failure: From Machine Learning to Mechanism Interpretation.Biomolecules. 2024 Feb 2;14(2):179. doi: 10.3390/biom14020179. Biomolecules. 2024. PMID: 38397416 Free PMC article.
-
Transcriptomic analysis and machine learning modeling identifies novel biomarkers and genetic characteristics of hypertrophic cardiomyopathy.Front Genet. 2025 Jun 17;16:1596049. doi: 10.3389/fgene.2025.1596049. eCollection 2025. Front Genet. 2025. PMID: 40599543 Free PMC article.
-
Identification MNS1, FRZB, OGN, LUM, SERP1NA3 and FCN3 as the potential immune-related key genes involved in ischaemic cardiomyopathy by random forest and nomogram.Aging (Albany NY). 2023 Feb 27;15(5):1475-1495. doi: 10.18632/aging.204547. Epub 2023 Feb 27. Aging (Albany NY). 2023. PMID: 36863704 Free PMC article.
-
GeneCompete: an integrative tool of a novel union algorithm with various ranking techniques for multiple gene expression data.PeerJ Comput Sci. 2023 Nov 15;9:e1686. doi: 10.7717/peerj-cs.1686. eCollection 2023. PeerJ Comput Sci. 2023. PMID: 38077583 Free PMC article.
References
-
- Hensley N, Dietrich J, Nyhan D, Mitter N, Yee MS, Brady M. Hypertrophic cardiomyopathy: a review. Anesth Analg. 2015;120(3):554–569. - PubMed
-
- Maron BJ, Maron MS. Hypertrophic cardiomyopathy. Lancet (London, England). 2013;381(9862):242–255. - PubMed
-
- Maron BJ, Maron MS, Semsarian C. Genetics of hypertrophic cardiomyopathy after 20 years: clinical perspectives. J Am Coll Cardiol. 2012;60(8):705–715. - PubMed
-
- MacIntyre C, Lakdawala NK. Management of atrial fibrillation in hypertrophic cardiomyopathy. Circulation. 2016;133(19):1901–1905. - PubMed
LinkOut - more resources
Full Text Sources
Miscellaneous
