. 2021 Jul 5:2021:5533886.
doi: 10.1155/2021/5533886. eCollection 2021.

Modeling the Effect of Binding Kinetics in Spatial Drug Distribution in the Brain

Affiliations

Modeling the Effect of Binding Kinetics in Spatial Drug Distribution in the Brain

Nelson Kashaju et al. Comput Math Methods Med. .

Abstract

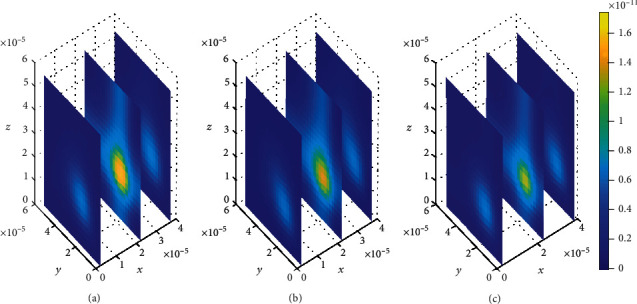
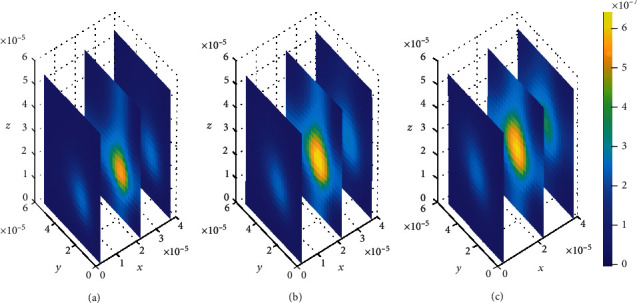
A 3-dimensional mathematical model is developed to determine the effect of drug binding kinetics on the spatial distribution of a drug within the brain. The key components, namely, transport across the blood-brain barrier (BBB), drug distribution in the brain extracellular fluid (ECF), and drug binding kinetics are coupled with the bidirectional bulk flow of the brain ECF to enhance the visualization of drug concentration in the brain. The model is developed based on the cubical volume of a brain unit, which is a union of three subdomains: the brain ECF, the BBB, and the blood plasma. The model is a set of partial differential equations and the associated initial and boundary conditions through which the drug distribution process in the mentioned subdomains is described. Effects of drug binding kinetics are investigated by varying the binding parameter values for both nonspecific and specific binding sites. All variations of binding parameter values are discussed, and the results show the improved visualization of the effect of binding kinetics in the drug distribution within the brain. For more realistic visualization, we suggest incorporating more brain components that make up the large volume of the brain tissue.


Conflict of interest statement

The authors declare that there is no conflict of interest regarding the publication of this paper.

Figures

Figure 1
Figure 1
3D brain unit domain, Win, Wout domains, and bulk flow directions.
Figure 2
Figure 2
Drug exchange between Wpl and WECF.
Figure 3
Figure 3
Drug transport in brain capillaries and active transport across the BBB into the brain ECF (a). A cubical lattice (blue) represents a piece of 3-dimensional brain tissue. The cubical lattice is formed of the network of smaller cubic lattices (red). The arrows indicate the bidirectional bulk flow of the brain ECF (b).
Figure 4
Figure 4
Drug distribution in blood plasma (μ) for P = 0.1 × 10⁻⁷ms−1 and vblood=1 × 10⁻⁶ms−1. The plots (a), (b), and (c) indicate the distribution of drug in the blood plasma (μ) for t = 2s, t = 8s, and t = 14s, respectively.
Figure 5
Figure 5
Drug distribution in blood plasma (μ) for P = 0.5 × 10⁻⁷ms−1 and vblood=1.5 × 10⁻⁶ms−1. The plots (a), (b), and (c) indicate the distribution of drug in the blood plasma (μ) for t = 2s, t = 8s, and t = 14s, respectively.
Figure 6
Figure 6
Drug distribution in blood plasma (μ) for P = 2 × 10−6.9ms−1 and vblood=1 × 10⁻⁶ms−1. The plots (a), (b), and (c) indicate the distribution of drug in the blood plasma (μ) for t = 2s, t = 8s, and t = 14s, respectively.
Figure 7
Figure 7
Drug distribution in blood plasma (μ) for P = 0.1 × 10⁻⁷ms−1 and vblood=1.1 × 10−5.95ms−1. The plots (a), (b), and (c) indicate the distribution of drug in the blood plasma (μ) for t = 2s, t = 8s, and t = 14s, respectively.
Figure 8
Figure 8
Drug distribution in brain ECF (ρ) for k1on = 1 × 10⁻¹(μmolL−1s)−1, k2on = 1 × 10⁻²(μmolL−1s)−1, k1off = 1 × 10⁻²s−1, and k2off = 1 × 10⁻¹s−1. The plots (a), (b), and (c) indicate the distribution of drug in the brain ECF (ρ) for t = 2s, t = 8s, and t = 14s, respectively.
Figure 9
Figure 9
Drug distribution in brain ECF (ρ) for k1on = 1 × 10⁻¹(μmolL−1s)−1, k2on = 1 × 10⁻²(μmolL−1s)−1, k1off = 5 × 10⁻¹s−1, and k2off = 3 × 10−0.2s−1. The plots (a), (b), and (c) indicate the distribution of drug in the brain ECF (ρ) for t = 2s, t = 8s, and t = 14s, respectively.
Figure 10
Figure 10
Drug distribution in the brain ECF (ρ) for k1on = 1 × 10⁻²(μmolL−1s)−1, k2on = 1 × 10⁻³(μmolL−1s)−1, k1off = 1 × 10⁻²s−1, and k2off = 1 × 10⁻¹s−1. The plots (a), (b), and (c) indicate the distribution of drug in the brain ECF (ρ) for t = 2s, t = 8s, and t = 14s, respectively.
Figure 11
Figure 11
Drug distribution in the brain ECF (ρ) for k1on = 0.5(μmolL−1s)−1, k2on = 1 × 10⁻²(μmolL−1s)−1, k1off = 2 × 10⁻¹s−1, and k2off = 1 × 10⁻¹s−1. The plots (a), (b), and (c) indicate the distribution of drug in the brain ECF (ρ) for t = 2s, t = 8s, and t = 14s, respectively.
Figure 12
Figure 12
Drug distribution in the brain ECF (ρ) for k1on = 1 × 10⁻¹(μmolL−1s)−1, k2on = 2.5 × 10⁻⁴(μmolL−1s)−1, k1off = 1 × 10⁻²s−1, and k2off = 1.5 × 10⁻³s−1. The plots (a), (b), and (c) indicate the distribution of drug in the brain ECF (ρ) for t = 2s, t = 8s, and t = 14s, respectively.
Figure 13
Figure 13
Drug distribution in specific binding sites (B1) for k1on = 1 × 10⁻¹(μmolL−1s)−1, k2on = 1 × 10⁻²(μmolL−1s)−1, k1off = 1 × 10⁻²s−1, and k2off = 1 × 10⁻¹s−1. The plots (a), (b), and (c) indicate the distribution of drug in specific binding sites (B1) for t = 2 s, t = 8 s, and t = 14 s, respectively.
Figure 14
Figure 14
Drug distribution in non-specific binding sites (B2) for k1on = 1 × 10⁻¹(μmolL−1s)−1, k2on = 1 × 10⁻²(μmolL−1s)−1, k1off = 1 × 10⁻²s−1, and k2off = 1 × 10⁻¹s−1. The plots (a), (b), and (c) indicate the distribution of drug in non-specific binding sites (B2) for t = 2 s, t = 8 s, and t = 14 s, respectively.
Figure 15
Figure 15
Drug distribution in non-specific binding sites (B2) for k1on = 1 × 10⁻¹(μmolL−1s)−1, k2on = 1 × 10⁻²(μmolL−1s)−1, k1off = 5 × 10⁻¹s−1, and k2off = 3 × 10−0.2s−1. The plots (a), (b), and (c) indicate the distribution of drug in non-specific binding sites (B2) for t = 2 s, t = 8 s, and t = 14 s, respectively.
Figure 16
Figure 16
Drug distribution in specific binding sites (B1) for k1on = 1 × 10⁻¹(μmolL−1s)−1, k2on = 1 × 10⁻²(μmolL−1s)−1, k1off = 5 × 10⁻¹s−1, and k2off = 3 × 10−0.2s−1. The plots (a), (b), and (c) indicate the distribution of drug in specific binding sites (B1) for t = 2 s, t = 8 s, and t = 14 s, respectively.
Figure 17
Figure 17
Drug distribution in non-specific binding sites (B2) for k1on = 1 × 10⁻²(μmolL−1s)−1, k2on = 1 × 10⁻³(μmolL−1s)−1, k1off = 1 × 10⁻²s−1, and k2off = 1 × 10⁻¹s−1. The plots (a), (b), and (c) indicate the distribution of drug in non-specific binding sites (B2) for t = 2 s, t = 8 s, and t = 14 s, respectively.
Figure 18
Figure 18
Drug distribution in specific binding sites (B1) for k1on = 1 × 10⁻²(μmolL−1s)−1, k2on = 1 × 10⁻³(μmolL−1s)−1, k1off = 1 × 10⁻²s−1, and k2off = 1 × 10⁻¹s−1. The plots (a), (b), and (c) indicate the distribution of drug in specific binding sites (B1) for t = 2 s, t = 8 s, and t = 14 s, respectively.
Figure 19
Figure 19
Drug distribution in specific binding sites (B1) for k1on = 0.5(μmolL−1s)−1, k2on = 1 × 10⁻²(μmolL−1s)−1, k1off = 2 × 10⁻¹s−1, and k2off = 1 × 10⁻¹s−1. The plots (a), (b), and (c) indicate the distribution of drug in specific binding sites (B1) for t = 2 s, t = 8 s, and t = 14 s, respectively.
Figure 20
Figure 20
Drug distribution in non-specific binding sites (B2) for k1on = 0.5(μmolL−1s)−1, k2on = 1 × 10⁻²(μmolL−1s)−1, k1off = 2 × 10⁻¹s−1, and k2off = 1 × 10⁻¹s−1. The plots (a), (b), and (c) indicate the distribution of drug in non-specific binding sites (B2) for t = 2 s, t = 8 s, and t = 14 s, respectively.
Figure 21
Figure 21
Drug distribution in specific binding sites (B1) for k1on = 1 × 10⁻¹(μmolL−1s)−1, k2on = 2.5 × 10⁻⁴(μmolL−1s)−1, k1off = 1 × 10⁻²s−1, and k2off = 1.5 × 10⁻³s−1. The plots (a), (b), and (c) indicate the distribution of drug in specific binding sites (B1) for t = 2 s, t = 8 s, and t = 14 s, respectively.
Figure 22
Figure 22
Drug distribution in nonspecific binding sites (B2) for k1on = 1 × 10⁻¹(μmolL−1s)−1, k2on = 12.5 × 10⁻⁴(μmolL−1s)−1, k1off = 1 × 10⁻²s−1, and k2off = 1.5 × 10⁻³s−1. The plots (a), (b), and (c) indicate the distribution of drug in specific binding sites (B2) for t = 2 s, t = 8 s, and t = 14 s, respectively.

References

    1. Paul A. Introduction to Basics of Pharmacology and Toxicology. Springer; 2019. Drug distribution.
    1. Vendel E., Rottschäfer V., De Lange E. C. A 3d brain unit model to further improve prediction of local drug distribution within the brain. PLoS One. 2020;15(9, article e0238397) doi: 10.1371/journal.pone.0238397. - DOI - PMC - PubMed
    1. Sim D. S. M. Pharmacological Basis of Acute Care. Springer; 2015. Drug distribution.
    1. Olivier J.-C. Drug transport to brain with targeted nanoparticles. NeuroRx. 2005;2(1):108–119. doi: 10.1602/neurorx.2.1.108. - DOI - PMC - PubMed
    1. Sweeney M. D., Zhao Z., Montagne A., Nelson A. R., Zlokovic B. V. Blood-brain barrier: from physiology to disease and back. Physiological Reviews. 2019;99(1):21–78. doi: 10.1152/physrev.00050.2017. - DOI - PMC - PubMed

Substances