Alterations in Gene Expression of Renin-Angiotensin System Components and Related Proteins in Colorectal Cancer
- PMID: 34285715
- PMCID: PMC8277508
- DOI: 10.1155/2021/9987115
Alterations in Gene Expression of Renin-Angiotensin System Components and Related Proteins in Colorectal Cancer
Abstract
Materials and methods: Quantitative expression of the RNA of these 17 genes in normal and cancerous tissues obtained using chip arrays from the public functional genomics data repository, Gene Expression Omnibus (GEO) application, was compared statistically.
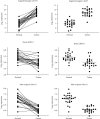
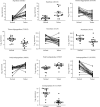
Results: Expression of four genes, AGT (angiotensinogen), ENPEP (aminopeptidase A) MME (neprilysin), and PREP (prolyl endopeptidase), was significantly upregulated in CRC specimens. Expression of REN (renin), THOP (thimet oligopeptidase), NLN (neurolysin), PRCP (prolyl carboxypeptidase), ANPEP (aminopeptidase N), and MAS1 (Mas receptor) was downregulated in CRC specimens.
Conclusions: Presuming gene expression parallel protein expression, these results suggest that increased production of the angiotensinogen precursor of angiotensin (ANG) peptides, with the reduction of the enzymes that metabolize it to ANG II, can lead to accumulation of angiotensinogen in CRC tissues. Downregulation of THOP, NLN, PRCP, and MAS1 gene expression, whose proteins contribute to the ACE2/ANG 1-7/Mas axis, suggests that reduced activity of this RAS branch could be permissive for oncogenicity. Components of the RAS may be potential therapeutic targets for treatment of CRC.
Copyright © 2021 Danial Mehranfard et al.
Conflict of interest statement
The authors declare that they have no conflicts of interest.
Figures


Similar articles
-
Regulation of the renin-angiotensin system (RAS) in BeWo and HTR-8/SVneo trophoblast cell lines.Placenta. 2012 Aug;33(8):634-9. doi: 10.1016/j.placenta.2012.05.001. Epub 2012 May 28. Placenta. 2012. PMID: 22647832
-
Differential Gene Expression Profile of Renin-Angiotensin System in the Left Atrium in Mitral Regurgitation Patients.Dis Markers. 2018 Nov 18;2018:6924608. doi: 10.1155/2018/6924608. eCollection 2018. Dis Markers. 2018. PMID: 30581499 Free PMC article.
-
Nuclear expression of renin-angiotensin system components in NRK-52E renal epithelial cells.J Renin Angiotensin Aldosterone Syst. 2015 Dec;16(4):1135-48. doi: 10.1177/1470320313515039. Epub 2014 Jun 24. J Renin Angiotensin Aldosterone Syst. 2015. PMID: 24961503 Free PMC article.
-
Levels of angiotensin and molecular biology of the tissue renin angiotensin systems.Regul Pept. 1993 Jan 22;43(1-2):1-20. doi: 10.1016/0167-0115(93)90403-u. Regul Pept. 1993. PMID: 8426906 Review.
-
Fifty years of research on the brain renin-angiotensin system: what have we learned?Clin Sci (Lond). 2021 Jul 30;135(14):1727-1731. doi: 10.1042/CS20210579. Clin Sci (Lond). 2021. PMID: 34291792 Review.
Cited by
-
Identification and evaluation of metabolic mRNAs and key miRNAs in colorectal cancer liver metastasis.Cancer Cell Int. 2025 Jul 16;25(1):265. doi: 10.1186/s12935-025-03903-x. Cancer Cell Int. 2025. PMID: 40671011 Free PMC article.
-
Definition and verification of novel metastasis and recurrence related signatures of ccRCC: A multicohort study.Cancer Innov. 2022 Aug 30;1(2):146-167. doi: 10.1002/cai2.25. eCollection 2022 Aug. Cancer Innov. 2022. PMID: 38090653 Free PMC article.
-
Emerging Role of Neutrophil Extracellular Traps in Gastrointestinal Tumors: A Narrative Review.Int J Mol Sci. 2022 Dec 25;24(1):334. doi: 10.3390/ijms24010334. Int J Mol Sci. 2022. PMID: 36613779 Free PMC article. Review.
References
-
- Globocan. International Agency for Research on Cancer, Worldwide Incidence of Colorectal Cancer. 2020. https://gco.iarc.fr/today/data/factsheets/cancers/10_8_9-Colorectum-fact....
-
- United States Centers for Disease Control and Prevention. Leading Cancer Cases and Deaths, All Races/Ethnicities, Male and Female. 2017. https://gis.cdc.gov/cancer/USCS/DataViz.html.
MeSH terms
Substances
LinkOut - more resources
Full Text Sources
Medical
Miscellaneous
