

A meta-analysis of the combined effects of elevated carbon dioxide and chronic warming on plant %N, protein content and N-uptake rate
- PMID: 34285792
- PMCID: PMC8286714
- DOI: 10.1093/aobpla/plab031
A meta-analysis of the combined effects of elevated carbon dioxide and chronic warming on plant %N, protein content and N-uptake rate
Abstract
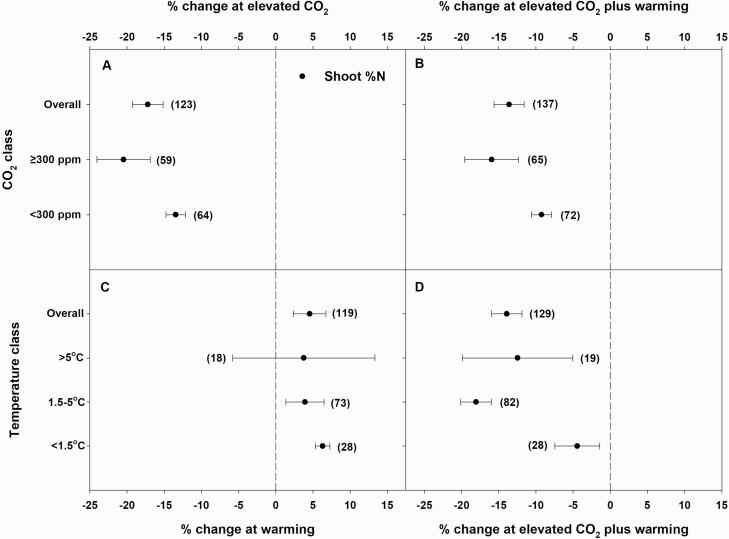
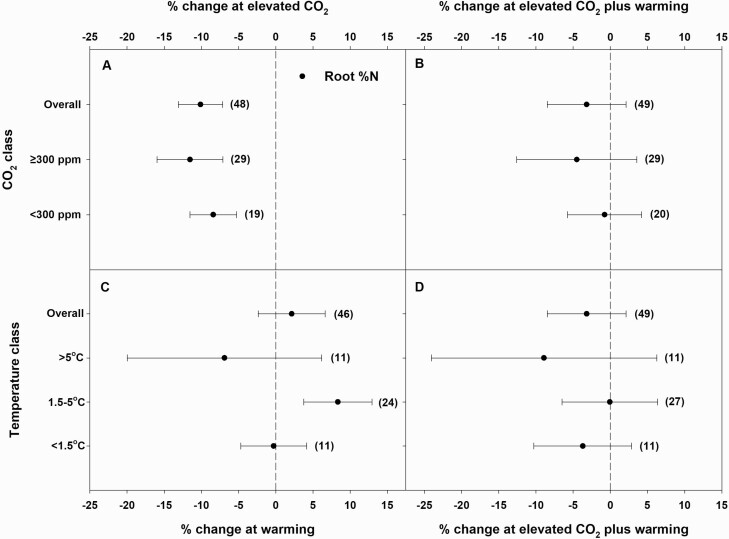
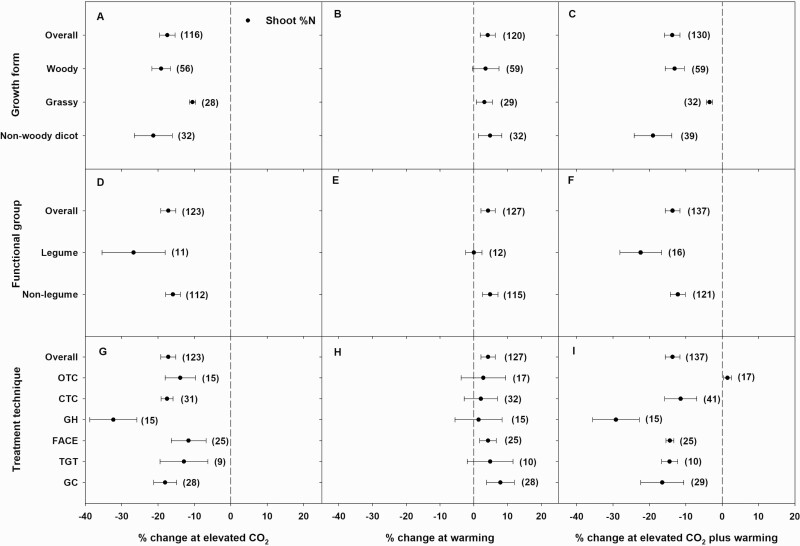
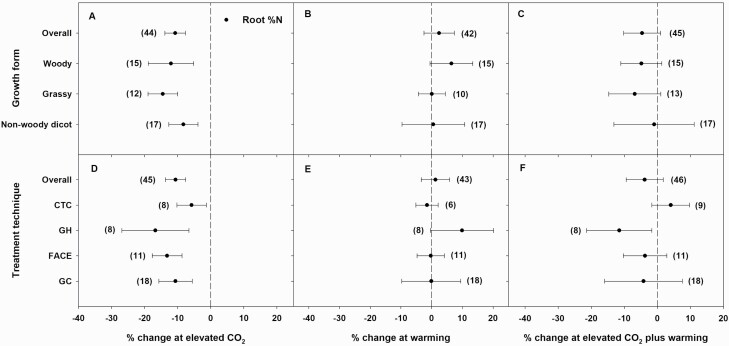
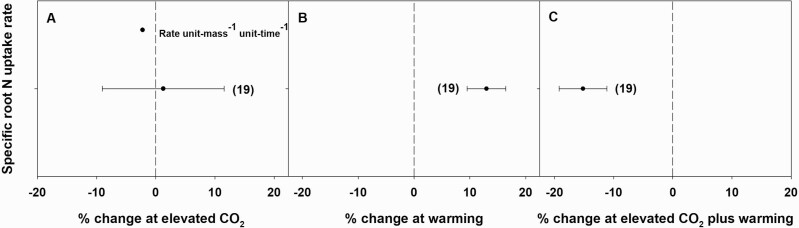
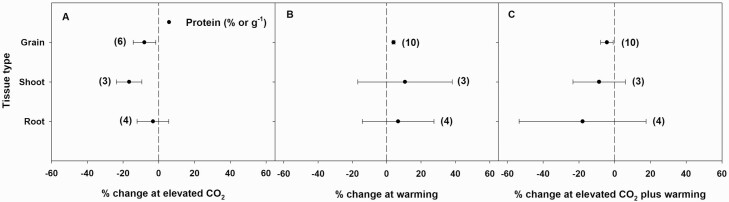
Elevated CO2 (eCO2) and high temperatures are known to affect plant nitrogen (N) metabolism. Though the combined effects of eCO2 and chronic warming on plant N relations have been studied in some detail, a comprehensive statistical review on this topic is lacking. This meta-analysis examined the effects of eCO2 plus warming on shoot and root %N, tissue protein concentration (root, shoot and grain) and N-uptake rate. In the analyses, the eCO2 treatment was categorized into two classes (<300 or ≥300 ppm above ambient or control), the temperature treatment was categorized into three classes (<1.5, 1.5-5 and >5 °C above ambient or control), plant species were categorized based on growth form and functional group and CO2 treatment technique was also investigated. Elevated CO2 alone or in combination with warming reduced shoot %N (more so at ≥300 vs. <300 ppm above ambient CO2), while root %N was significantly reduced only by eCO2; warming alone often increased shoot %N, but mostly did not affect root %N. Decreased shoot %N with eCO2 alone or eCO2 plus warming was greater for woody and non-woody dicots than for grasses, and for legumes than non-legumes. Though root N-uptake rate was unaffected by eCO2, eCO2 plus warming decreased N-uptake rate, while warming alone increased it. Similar to %N, protein concentration decreased with eCO2 in shoots and grain (but not roots), increased with warming in grain and decreased with eCO2 and warming in grain. In summary, any benefits of warming to plant N status and root N-uptake rate will generally be offset by negative effects of eCO2. Hence, concomitant increases in CO2 and temperature are likely to negate or decrease the nutritional quality of plant tissue consumed as food by decreasing shoot %N and shoot and/or grain protein concentration, caused, at least in part, by decreased root N-uptake rate.
Keywords: Climate change; elevated CO2; heat stress; meta-analysis; nitrogen metabolism; nitrogen translocation; nitrogen-uptake rate; protein; warming.
© The Author(s) 2021. Published by Oxford University Press on behalf of the Annals of Botany Company.
Figures
Similar articles
-
Elevated Carbon Dioxide and Chronic Warming Together Decrease Nitrogen Uptake Rate, Net Translocation, and Assimilation in Tomato.Plants (Basel). 2021 Apr 8;10(4):722. doi: 10.3390/plants10040722. Plants (Basel). 2021. PMID: 33917687 Free PMC article.
-
Effects of Elevated Carbon Dioxide and Chronic Warming on Nitrogen (N)-Uptake Rate, -Assimilation, and -Concentration of Wheat.Plants (Basel). 2020 Dec 1;9(12):1689. doi: 10.3390/plants9121689. Plants (Basel). 2020. PMID: 33271885 Free PMC article.
-
Elevated CO2 plus chronic warming reduce nitrogen uptake and levels or activities of nitrogen-uptake and -assimilatory proteins in tomato roots.Physiol Plant. 2017 Mar;159(3):354-365. doi: 10.1111/ppl.12532. Epub 2017 Jan 19. Physiol Plant. 2017. PMID: 27893161
-
Impacts of elevated CO2 on plant resistance to nutrient deficiency and toxic ions via root exudates: A review.Sci Total Environ. 2021 Feb 1;754:142434. doi: 10.1016/j.scitotenv.2020.142434. Epub 2020 Sep 21. Sci Total Environ. 2021. PMID: 33254908 Review.
-
Effects of Elevated CO2 and Heat on Wheat Grain Quality.Plants (Basel). 2021 May 20;10(5):1027. doi: 10.3390/plants10051027. Plants (Basel). 2021. PMID: 34065412 Free PMC article. Review.
Cited by
-
Species Survey of Leaf Hyponasty Responses to Warming Plus Elevated CO2.Plants (Basel). 2024 Jan 11;13(2):204. doi: 10.3390/plants13020204. Plants (Basel). 2024. PMID: 38256757 Free PMC article.
-
Change in mineral composition and cooking quality in legumes grown on semi-arid alfisols due to elevated CO2 and temperature.Front Nutr. 2025 Jan 6;11:1444962. doi: 10.3389/fnut.2024.1444962. eCollection 2024. Front Nutr. 2025. PMID: 39834453 Free PMC article.
References
-
- Abebe A, Pathak H, Singh SD, Bhatia A, Harit RC, Kumar V. 2016. Growth, yield and quality of maize with elevated atmospheric carbon dioxide and temperature in north-west India. Agriculture, Ecosystems & Environment 218:66–72.
-
- Ainsworth EA, Davey PA, Bernacchi CJ, Dermody OC, Heaton EA, Moore DJ, Morgan PB, Naidu SL, Yoora HS, Zhu XG, Curtis PS, Long SP. 2002. A meta-analysis of elevated [CO2] effects on soybean (Glycine max) physiology, growth and yield. Global Change Biology 8:695–709.
-
- Ainsworth EA, Leakey ADB, Ort DR, Long SP. 2008. FACE-ing the facts: inconsistencies and interdependence among field, chamber and modeling studies of elevated [CO2] impacts on crop yield and food supply. The New Phytologist 179:5–9. - PubMed
-
- Ainsworth EA, Long SP. 2005. What have we learned from 15 years of free-air CO2 enrichment (FACE)? A meta-analytic review of the responses of photosynthesis, canopy properties and plant production to rising CO2. The New Phytologist 165:351–371. - PubMed
-
- Ainsworth EA, Long SP. 2021. 30 years of free-air carbon dioxide enrichment (FACE): what have we learned about future crop productivity and its potential for adaptation? Global Change Biology 27:27–49. - PubMed
Publication types
LinkOut - more resources
Full Text Sources
