. 2021 Jul 3;7(7):e07481.
doi: 10.1016/j.heliyon.2021.e07481. eCollection 2021 Jul.

Apoptotic inducement of neuronal cells by codeine: possible role of disrupted redox state and caspase 3 signaling

Affiliations

Apoptotic inducement of neuronal cells by codeine: possible role of disrupted redox state and caspase 3 signaling

A F Ajayi et al. Heliyon. .

Abstract

Background: Codeine, a common drug of abuse, has been reported to induce organ damage; however, there are scanty available data on the effects of codeine on the brain.

Objective: Thus, we tested the hypothesis that redox dysregulation and inflammation of the brain induced by codeine exposure is 8-OHdG and/or caspase 3-dependent.

Methods: New Zealand White rabbits (Oryctolagus cuniculus) received vehicle (control; n = 7), low-dose codeine (4 mg/kg/day p.o; n = 6), or high-dose codeine (10 mg/kg/day p.o; n = 6) for six weeks. Body weight was checked before and after the study.

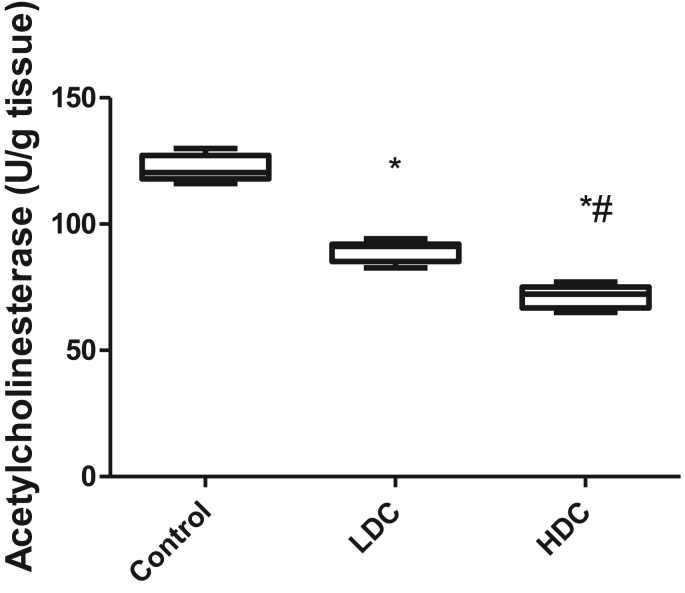
Results: Findings showed that codeine exposure resulted in redox dysregulation (evident by elevated MDA and H2O2 accompanied by reduced enzymatic antioxidant activities), elevated MPO activity, and distorted cytoarchitecture of the brain tissue. The observed codeine-induced redox imbalance and brain inflammation was accompanied by depletion of neuronal and purkinje cells, reduced AchE activity, and elevated 8-OHdG levels and caspase 3 activity.

Conclusions: The current study demonstrates that chronic codeine use induces oxido-inflammatory response and apoptosis of the brain tissue that is associated with neuronal and purkinje cells injury, and impaired AchE activity through 8-OHdG and/or caspase 3-dependent pathway.

Keywords: Apoptosis; Brain; Codeine; Drug abuse; Genotoxicity; Oxidative stress.


Conflict of interest statement

The authors declare no conflict of interest.

Figures

Figure 1
Figure 1
Effect of codeine on initial body weight (A), final body weight (B), body weight gain (C), brain weight (D), and brain organosomatic index, OSI (E). LDC: Low-dose codeine; HDC: High-dose codeine. Data were analyzed by ANOVA followed by Tukey's post hoc test. Values are expressed as mean ± SEM of 7 rats per group ∗p < 0.05 vs. control, #p < 0.05 vs LDC.
Figure 2
Figure 2
Photomicrographs of the H and E stain of the brain. LDC: Low-dose codeine; HDC: High-dose codeine. The control animals show normal hippocampus with normal neuronal cells (blue arrow). The structural organization of the CA1, CA2 and CA3 appear normal (white arrow) (A, D). The low dose codeine-treated animals show normal hippocampus with normal neuronal cells (blue arrow). The structural organization of the CA1, CA2 and CA3 appear normal (white arrow) (B, E). The high dose codeine-treated animals show normal hippocampus with moderately normal structural organization. However, the CA2 seen show moderate depletion black arrow, while other CA2, 3 and 4 appear normal (white arrow) (C, F). The control animals had cortex with normal laminae (spanned) and the neuronal cells appear normal. The capillaries seen are normal and the stroma also appear normal (slender arrow) (G, J). The low dose codeine-treated animals had cortex with normal laminae (spanned) and the neuronal cells appear normal. The capillaries seen are normal and the stroma also appear normal (slender arrow) (H, K). The animals that received high dose codeine had cortex with normal laminae (spanned) and the neuronal cells appear normal. The capillaries seen are moderately dilated and the stroma also appear normal (slender arrow) (I, L). The control animals had cerebellar cortex with normal folia. The molecular cell layer appear normal (white arrow), the purkinje cells layer show normal purkinje cells (black arrow), and granular layer appear normal (red arrow). The white matter appears normal (blue arrow). No pathological lesion was observed (M, P). The low dose codeine-treated animals had cerebellar cortex with normal folia. The molecular cell layer appear normal (white arrow), the purkinje cells layer show normal purkinje cells (black arrow), and granular layer appear normal (red arrow). The white matter also appears normal (blue arrow). No pathological lesion was seen (N, Q). The animals that received high dose codeine had cerebellar cortex with normal folia. The molecular cell layer appear normal (white arrow), the purkinje cells layer show mild depletion of purkinje cells (black arrow), and granular layer appear normal (red arrow) (O, R).
Figure 3
Figure 3
Effect of codeine on acetylcholinesterase activity. LDC: Low-dose codeine; HDC: High-dose codeine. Data were analyzed by ANOVA followed by Tukey's post hoc test. Values are expressed as mean ± SEM of 7 rats per group ∗p < 0.05 vs. control, #p < 0.05 vs LDC.
Figure 4
Figure 4
Effect of codeine on MDA (A), H2O2 (B), GSH (C), AGE (D), and MPO activity (E). LDC: Low-dose codeine; HDC: High-dose codeine. ∗ Data were analyzed by ANOVA followed by Tukey's post hoc test. Values are expressed as mean ± SEM of 7 rats per group ∗p < 0.05 vs. control, #p < 0.05 vs LDC.
Figure 5
Figure 5
Effect of codeine on the activities of SOD (A), catalase (B), GST (C), and GPx (D). LDC: Low-dose codeine; HDC: High-dose codeine. Data were analyzed by ANOVA followed by Tukey's post hoc test. Values are expressed as mean ± SEM of 7 rats per group ∗p < 0.05 vs. control, #p < 0.05 vs LDC.
Figure 6
Figure 6
Effect of codeine on 8OHdG (A), and caspase 3 activity (B). LDC: Low-dose codeine; HDC: High-dose codeine. Data were analyzed by ANOVA followed by Tukey's post hoc test. Values are expressed as mean ± SEM of 7 rats per group ∗p < 0.05 vs. control, #p < 0.05 vs LDC.

References

    1. Ajayi A.F., Akhigbe R.E. The physiology of male reproduction: impact of drugs and their abuse on male fertility. Andrologia. 2020 - PubMed
    1. Preuss C.V., Kalava A., King K.C.. Prescription of Controlled Substances: Benefits and Risks. https://www.statpearls.com/ArticleLibrary/viewarticle/40661. - PubMed
    1. Manbe D.A. Expert Committee on Drug Dependence; 2008. Crime and Drug Abuse Among Nigerian Youths: A Critical Examination in World Health Organization (WHO) 28th Report (unpublished)
    1. Fareo D.O. Drug abuse among Nigerian adolescents: strategies for counselling. J. Int. Soc. Res. 2012;5(20):341–347.
    1. Barnett J.H., Werners U., Secher S.M. Substance use in a population-based clinic sample of people with first episode psychosis. Br. J. Psychiatr. 2007;190:518–520. - PubMed