. 2021 May 4;3(1):vdab031.
doi: 10.1093/noajnl/vdab031. eCollection 2021 Jan-Dec.

Single-cell image analysis reveals a protective role for microglia in glioblastoma

Affiliations

Single-cell image analysis reveals a protective role for microglia in glioblastoma

Zoe Woolf et al. Neurooncol Adv. .

Abstract

Background: Microglia and tumor-associated macrophages (TAMs) constitute up to half of the total tumor mass of glioblastomas. Despite these myeloid populations being ontogenetically distinct, they have been largely conflated. Recent single-cell transcriptomic studies have identified genes that distinguish microglia from TAMs. Here we investigated whether the translated proteins of genes enriched in microglial or TAM populations can be used to differentiate these myeloid cells in immunohistochemically stained human glioblastoma tissue.

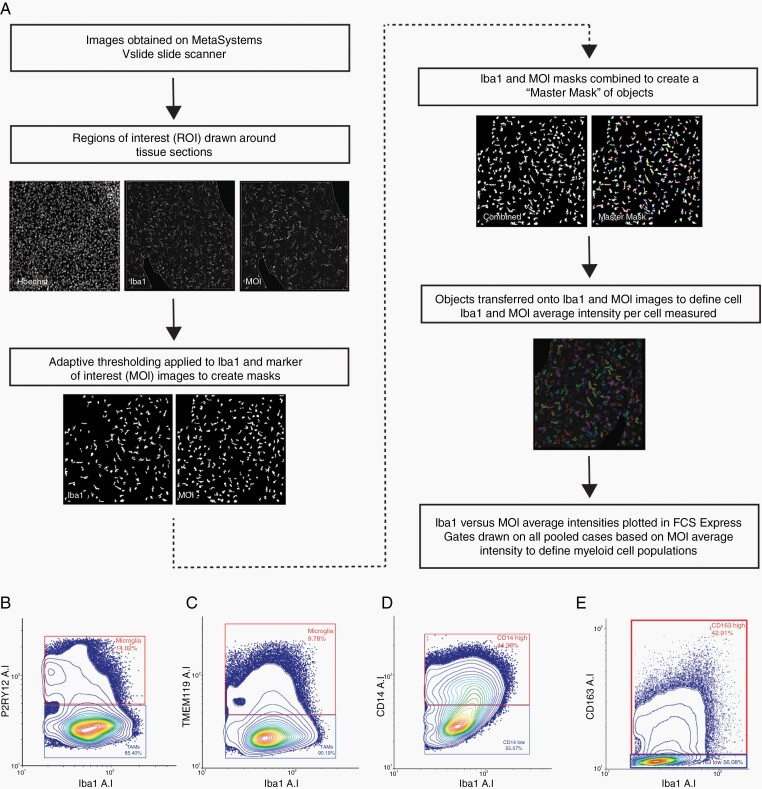
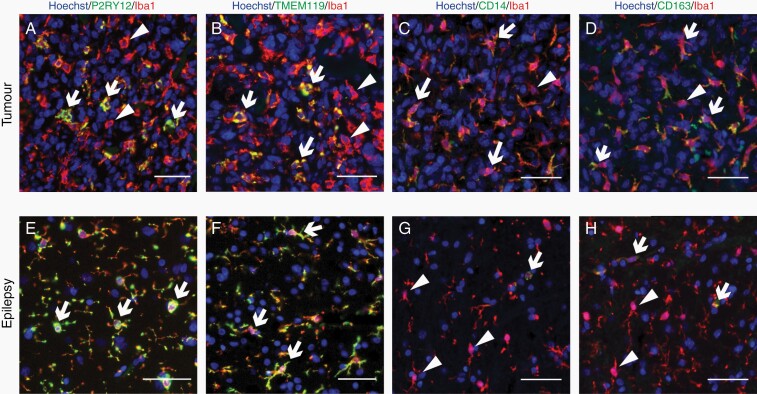
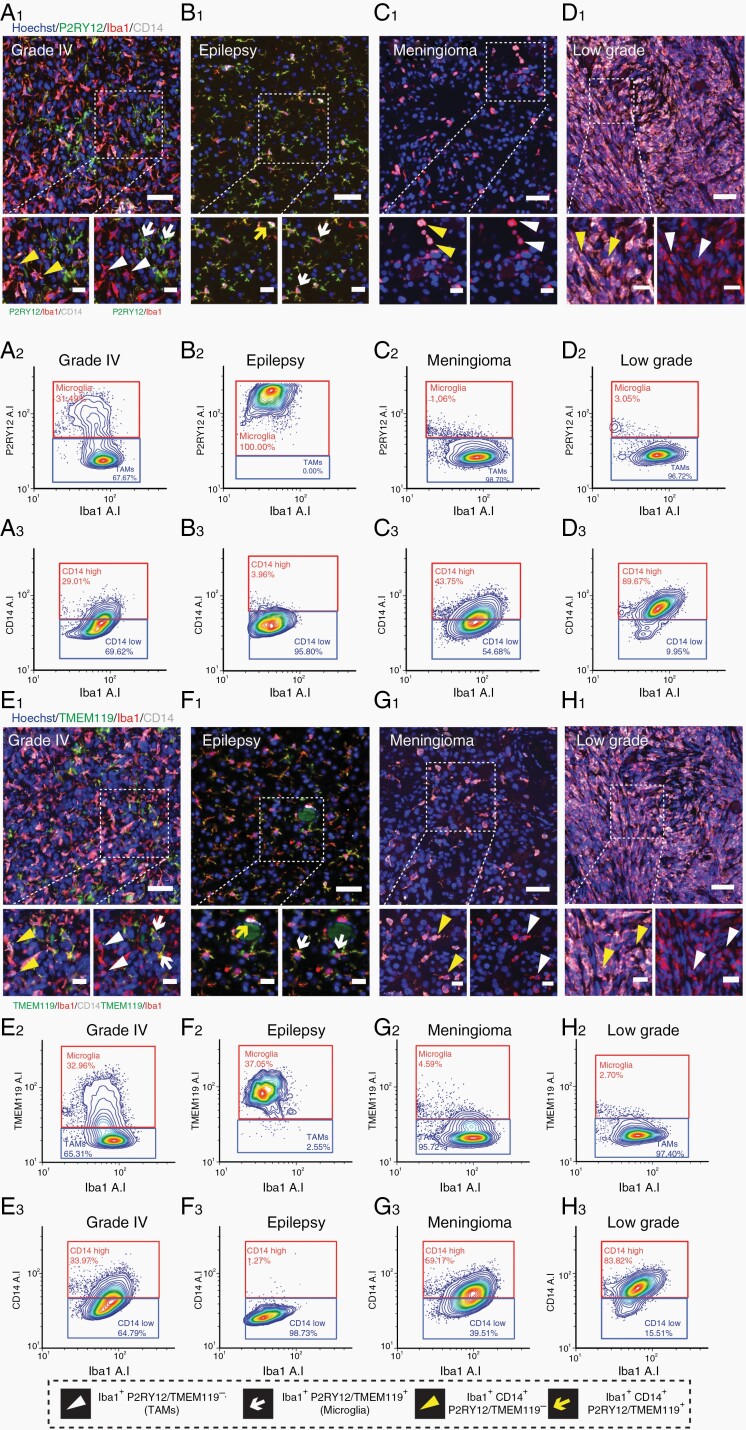
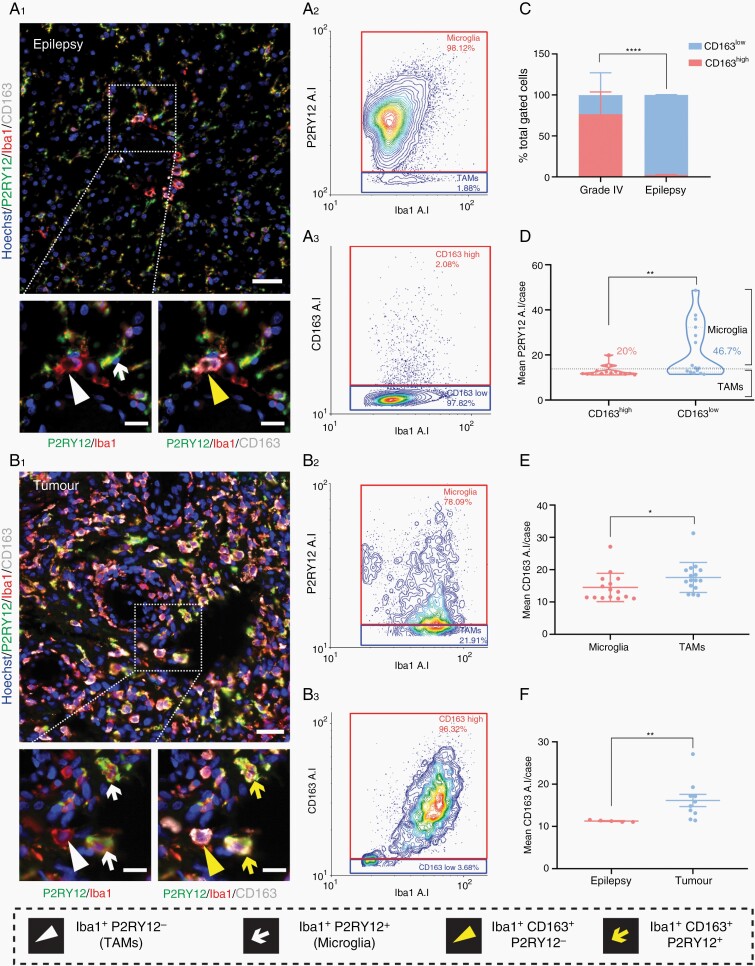
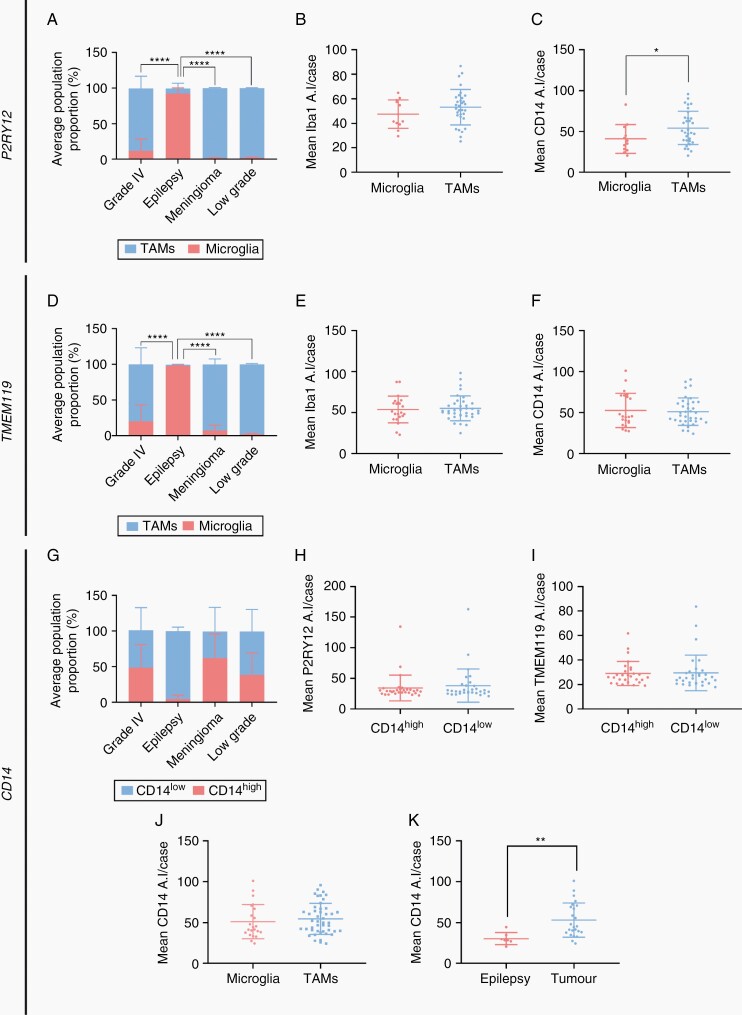
Methods: Tissue sections from resected low-grade, meningioma, and glioblastoma (grade IV) tumors and epilepsy tissues were immunofluorescently triple-labeled for Iba1 (pan-myeloid marker), CD14 or CD163 (preferential TAM markers), and either P2RY12 or TMEM119 (microglial-specific markers). Using a single-cell-based image analysis pipeline, we quantified the abundance of each marker within single myeloid cells, allowing the identification and analysis of myeloid populations.

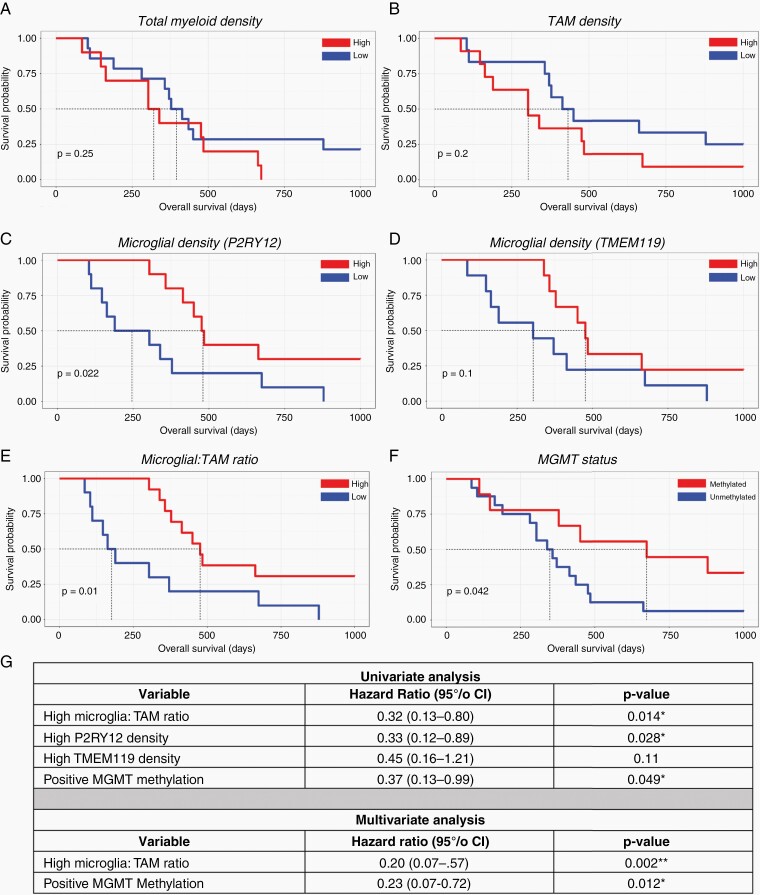
Results: P2RY12 and TMEM119 successfully discriminated microglia from TAMs in glioblastoma. In contrast, CD14 and CD163 expression were not restricted to invading TAMs and were upregulated by tumor microglia. Notably, a higher ratio of microglia to TAMs significantly correlated with increased patient survival.

Conclusions: We demonstrate the validity of previously defined microglial-specific genes P2RY12 and TMEM119 as robust discriminators of microglia and TAMs at the protein level in human tissue. Moreover, our data suggest that a higher proportion of microglia may be beneficial for patient survival in glioblastoma. Accordingly, this tissue-based method for myeloid population differentiation could serve as a useful prognostic tool.

Keywords: immunosuppression; microglia; tumor immunology; tumor-associated macrophages.


Figures

Figure 1.
Figure 1.
Analysis pipeline summary of MetaMorph custom journal and gating on single-cell average intensity. (A) Cells from all tumor and epilepsy cases were pooled on an XY scatter plot based on Iba1 and marker of interest (MOI) average intensity (P2RY12, TMEM119, CD14, or CD163). Gates were applied to contour plots to define microglia and TAM populations by P2RY12 and TMEM119 average intensity (B and C) and to define CD14high or CD163high and CD14low or CD163low populations (D and E).
Figure 2.
Figure 2.
Microglial markers P2RY12 and TMEM119 are present in a subset of tumor myeloid cells. Paraffin-embedded tumor (A–D) and epilepsy (E–H) tissue sections were fluorescently colabeled with pan-marker Iba1, alongside either microglial-specific markers P2RY12 or TMEM119, or proposed TAM-specific markers CD14 or CD163. White arrows denote double-positive cells, while white triangular arrowheads represent single-positive, Iba1-only cells. Scale bars = 50 µm.
Figure 3.
Figure 3.
Immunofluorescent identification and gating of microglia and TAM populations using microglial-specific marker expression. Representative immunofluorescent triple labeling using microglial-specific markers P2RY12 with Iba1 and CD14 in grade IV, epilepsy, meningioma, and low-grade tumor tissue (A1–D1). Cell population identification by cell-specific marker expression is defined in the figure key. Scale bars = 50 µm, 20 µm zoom. Image analysis and cell-by-cell gating using FCS Express for the above representative cases, with P2RY12 (A2–D2) and CD14 (A3–C3) plotted against Iba1 average intensity. Representative immunofluorescent triple labeling using microglial-specific markers TMEM119 with Iba1 and CD14 in grade IV, epilepsy, meningioma, and low-grade tumor tissue (E1–H1). Image analysis and cell-by-cell gating for representative cases, with Iba1 plotted against TMEM119 average intensity (E2–H2) and CD14 average intensity (E3–H3).
Figure 4.
Figure 4.
CD163 is not a specific marker for TAMs in human glioblastoma tissue and is upregulated by tumor microglia. Representative immunofluorescent triple labeling with P2RY12, Iba1, and CD163 in epilepsy and grade IV tumor tissue (A1, B1). Cell population classification by cell-specific marker expression is defined in the figure key. Scale bar 50 µm, 20 µm zoom. Corresponding single-cell resolution gating on Iba1 against P2RY12 or CD163 average intensity to define microglia and TAM populations (A2, B2), or CD163high and CD163low populations (A3, B3). Comparison of the mean percentage of CD163high and CD163low cells in grade IV and epilepsy cases using a two-way ANOVA with Tukey’s multiple comparison test (C). Data are presented as mean ± SD, ****P < .0001. Comparison of the mean single-cell average intensity, per case, of P2RY12 for classified CD163high and CD163low cells using a Mann–Whitney test, data are presented as mean ± SD, **P = .0099 (D). Comparison of mean CD163 single-cell average intensity in classified microglia (gated on P2RY12) and TAMs per grade IV tumor case (E). Comparison of mean single-cell CD163 average intensity per case of gated microglia between epilepsy and grade IV tumor tissue (F). Data are presented as mean ± SD; Mann–Whitney test, *P < .0149, **P = .0013.
Figure 5.
Figure 5.
P2RY12 and TMEM119, but not CD14, discriminate 2 myeloid populations in glioblastoma. Using cell-by-cell gating analysis, pooled cells from each case were gated on either P2RY12 (A–C) or TMEM119 average intensity (D–F) and classified as microglia or TAMs, respectively. Pooled cells were also gated based on CD14 average intensity (G–I) to classify cells as CD14high or CD14low. Comparison of the mean percentage of microglia and TAMs (or CD14high and CD14low cells) in grade IV, epilepsy, meningioma, and low-grade tumors using a two-way ANOVA with Tukey’s multiple comparison test (A, D, and G). Data are presented as mean ± SD, ****P < .0001. Comparison of the mean single-cell average intensity, per case, of Iba1 and CD14 for classified microglia and TAMs (B and C, E and F), and P2RY12 and TMEM119 for CD14high and CD14low cells (H and I) using a Mann–Whitney test, data are presented as mean ± SD, *P < .05. Comparison of mean CD14 single-cell average intensity per glioblastoma case in gated microglia (pooled P2RY12 and TMEM119) and TAMs (J). Comparison of mean CD14 single-cell average intensity per case of gated microglia between epilepsy and tumor tissue (K). Data are presented as mean ± SD; Mann–Whitney test, **P < .01.
Figure 6.
Figure 6.
Myeloid cell populations define glioblastoma patient survival. Kaplan–Meier curves exploring the relationship between cell density (cell numbers derived from cell gating/stained area in mm2) and patient survival. Total myeloid cell density (total gated cells per case/mm2) (A). Total TAM cell density (total gated TAMs per case/mm2) (B). Total microglia density (total gated microglia per case/mm2) using P2RY12 (C) and TMEM119 expression (D). The ratio of microglia: TAMs per case, utilizing combined P2RY12 and TMEM119 microglial density data (E). MGMT methylation status and patient survival (F). The median value for each variable was used to divide cases into high and low cohort groups. *P < .05. Exploratory univariate proportional hazards (Cox) regression analysis and multivariate analysis of dataset (G); *P < .05, **P < .01.

Similar articles

Cited by

References

    1. Wen PY, Kesari S. Malignant gliomas in adults. N Engl J Med. 2008;359(5):492–507. - PubMed
    1. Watters JJ, Schartner JM, Badie B. Microglia function in brain tumors. J Neurosci Res. 2005;81(3):447–455. - PubMed
    1. Chen Z, Hambardzumyan D. Immune microenvironment in glioblastoma subtypes. Front Immunol. 2018;9:1004. - PMC - PubMed
    1. Yin Y, Qiu S, Li X, Huang B, Xu Y, Peng Y. EZH2 suppression in glioblastoma shifts microglia toward M1 phenotype in tumor microenvironment. J Neuroinflammation. 2017;14(1):220. - PMC - PubMed
    1. Ginhoux F, Greter M, Leboeuf M, et al. . Fate mapping analysis reveals that adult microglia derive from primitive macrophages. Science. 2010;330(6005):841–845. - PMC - PubMed

LinkOut - more resources