. 2022 Jan;32(1):e13006.
doi: 10.1111/bpa.13006. Epub 2021 Jul 19.

Glycocalyx is critical for blood-brain barrier integrity by suppressing caveolin1-dependent endothelial transcytosis following ischemic stroke

Affiliations

Glycocalyx is critical for blood-brain barrier integrity by suppressing caveolin1-dependent endothelial transcytosis following ischemic stroke

Juan Zhu et al. Brain Pathol. 2022 Jan.

Abstract

The breakdown of the blood-brain barrier (BBB) is related to the occurrence and deterioration of neurological dysfunction in ischemic stroke, which leads to the extravasation of blood-borne substances, resulting in vasogenic edema and increased mortality. However, a limited understanding of the molecular mechanisms that control the restrictive properties of the BBB hinders the manipulation of the BBB in disease and treatment. Here, we found that the glycocalyx (GCX) is a critical factor in the regulation of brain endothelial barrier integrity. First, endothelial GCX displayed a biphasic change pattern, of which the timescale matched well with the biphasic evolution of BBB permeability to tracers within the first week after t-MCAO. Moreover, GCX destruction with hyaluronidase increased BBB permeability in healthy mice and aggravated BBB leakage in transient middle cerebral artery occlusion (t-MCAO) mice. Surprisingly, ultrastructural observation showed that GCX destruction was accompanied by increased endothelial transcytosis at the ischemic BBB, while the tight junctions remained morphologically and functionally intact. Knockdown of caveolin1 (Cav1) suppressed endothelial transcytosis, leading to reduced BBB permeability, and brain edema. Lastly, a coimmunoprecipitation assay showed that GCX degradation enhanced the interaction between syndecan1 and Src by promoting the binding of phosphorylated syndecan1 to the Src SH2 domain, which led to rapid modulation of cytoskeletal proteins to promote caveolae-mediated endocytosis. Overall, these findings demonstrate that the dynamic degradation and reconstruction of GCX may account for the biphasic changes in BBB permeability in ischemic stroke, and reveal an essential role of GCX in suppressing transcellular transport in brain endothelial cells to maintain BBB integrity. Targeting GCX may provide a novel strategy for managing BBB dysfunction and central nervous system drug delivery.

Keywords: blood-brain barrier; brain edema; caveolin1; glycocalyx; ischemia stroke; transcytosis.


Conflict of interest statement

The authors declare that they have no conflicts of interest. We confirm that we have read the Journal's position on issues involved in ethical publication and affirm that this report is consistent with those guidelines.

Figures
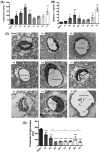
FIGURE 1
FIGURE 1
Evolutionary change pattern of endothelial GCX responded to ischemia‐reperfusion injury within the first week. Measurements of constitutional parts of the GCX, hyaluronan (A) and syndecan1 (B), in plasma at a series of discrete time points after t‐MCAO. (C) Transmission electron microscopic views of the cerebral capillaries endothelial GCX with lanthanum nitrate staining at different time points after t‐MCAO. Scale bar, 1 μm. The endothelial GCX densely covered the surface of vascular endothelium in sham group, while appeared to be sparse and thinner at different time points after ischemia, and obvious perivascular edema was visualized at 6 h, 1, 2 and 5 days. (D) Quantitative analysis of the thickness of endothelial GCX of cerebral capillaries. *p < 0.05, **p < 0.01, ***p < 0.001 and ****p < 0.0001 vs. sham group
FIGURE 2
FIGURE 2
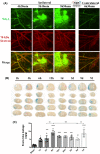
Dynamic evolution pattern of BBB permeability within the first week following cerebral ischemia/reperfusion onset. (A) Representative live two‐photon imaging within the cortical infarct region over time after t‐MCAO. The tracer leakage from blood vessels into the CNS parenchyma was visualized 30min after tail vein injection of lectin wheat germ agglutinin (WGA, green background) and 70 kDa dextran (red background). Scale bar, 50 μm. (B) Representative images showing EB extravasation over time after t‐ MCAO. A column of images represents different brain slices of the same mouse. (C) Quantitative analysis of EB. Differences between operated and sham‐operated controls were significant at the *p < 0.05, **p < 0.01, ***p < 0.001, ****p < 0.0001 levels
FIGURE 3
FIGURE 3
Continuous appearance of functional TJs structure throughout the period of BBB breakdown induced by t‐MCAO. At different time points after t‐MCAO, endothelial TJs showed no apparent ultrastructural defects and remained sealed, as assessed by electron‐dense lanthanum (black) diffused into intercellular clefts but stopped sharply at the junction (green arrows). Scale bar, 200 nm
FIGURE 4
FIGURE 4
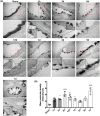
Active and abundant vesicular activity in cortical endothelium after ischemia and reperfusion. (A) Increased free vesicles (blue arrows) and lanthanum‐containing vesicles (red arrows) in endothelial cells appeared continuously during the whole course of BBB impairment. Sham endothelium displayed very few vesicles. Upper panel showed EM images (Scale bar, 500 nm) of individual capillary at different time points after reperfusion and the lower panel showed high magnification images of the areas boxed in upper panel, respectively. (B) Free vesicular density quantification. *p < 0.05, **p < 0.01 and ****p < 0.0001 vs. sham group
FIGURE 5
FIGURE 5
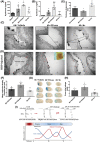
Further degradation of GCX activated more endothelial transcytosis and increased the BBB permeability after t‐MACO. (A, B) Serum levels of hyaluronan and syndecan1were measured in different treatment groups. *p < 0.05, **p < 0.01, ***p < 0.001, ****p < 0.0001 vs. the sham group; & p < 0.05, &&&& p < 0.0001 vs. the 6h‐vehicle group; ## p < 0.01, ### p < 0.001, #### p < 0.0001 vs. the 6h+HAase group. (C) Representative EM images at 6h after t‐MCAO revealed increased number of vesicles in HAase group. Scale bar, 500 nm. (D) Representative EM images of mice injected with HRP tracer illustrating increased HRP‐filled vesicles (red arrows). ECs of HAase‐treated mice at 6h after t‐MCAO possessed more HRP filled vesicles. Scale bar, 500 nm. (E) Quantification of lanthanum‐stained endothelial GCX of the cerebral capillaries in ischemic cortex at 6h after t‐MCAO. &p < 0.05 vs. the 6h‐vehicle group; ## p < 0.01 vs. the 6h+HAase group. (F) Quantification of endothelial vesicles. *p < 0.05 vs. the 6h group; ## p < 0.01 vs. the 6h+HAase group. (G, H) Representative images and quantitative analysis of EB extravasation from experimental groups. *p < 0.05 vs. the 6h‐vehicle group; ### p < 0.001 vs. the 6h+HAase group. (I) Schematic diagram of BBB biphasic events and GCX degradation and recovery associated with cerebral ischemia and reperfusion time‐course. Endothelial GCX displayed an evolutionary change pattern, whose timescale unexpectedly matched well to the biphasic evolution of BBB permeability to tracers, accompanying by increased number of endothelial vesicles and accelerated rates of transcytosis, during the first‐week mornitoring‐phase after t‐MCAO
FIGURE 6
FIGURE 6
Further degradation of GCX aggravated brain edema after t‐MACO. (A, B) Representative images and quantification of TTC‐ stained brain slices from each group. *p < 0.05 vs. the 6h‐vehicle group; # p < 0.05 vs. the 6h+HAase group. (C) Quantitative analysis of brain parenchymal water content in different groups. ****p < 0.0001 vs. the sham group; # p < 0.05, #### p < 0.0001 vs. the 6h‐vehicle group; &&&& p < 0.0001 vs. the 6h‐HAase group. (D) Representative T2‐weighted images of the tenth slice from each mouse in different groups. ADC images were re‐structured on DWI. Normal signal presented in the left undamaged hemisphere. (E, F) Quantification of edema formation based on MRI images. *p < 0.05, **p < 0.01 vs. the vehicle group; #p < 0.05 vs. the 6h‐HAase group
FIGURE 7
FIGURE 7
Endothelium displayed increased vesicular activity and evident transcytosis at 6h after enzymatic degradation of GCX under physiological condition. (A) Representative EM images were obtained after GCX was degraded by two enzymes (HAase and HPase) for 6 h. The lower panel showed high magnification images of the areas boxed in upper panel illustrating increased free vesicles (Black arrows). Scale bar, 500 nm. In addition, the EM images (the bottom panel, scale bar, 200 nm) in the HAase and HPase groups showed increased vesicles containing shedding GCX component (black arrowheads), indicating increased endothelial transcytosis. (B) Free vesicular density quantification revealed a significant increase in endothelial vesicle number after either HAase‐ or HPase‐induced GCX degradation. **p < 0.01, ***p < 0.001 vs. control group. (C) Increased transcytosis was evident in HRP‐injected HAase‐ or HPase‐treated mice. Right panel showed high magnification images of the areas boxed in left panel. Red arrows indicate single HRP‐filled vesicles (red arrows) either budding from the luminal membrane or traveling through the endothelial cytoplasm. ECs displayed functional TJs structure (green arrows). Scale bar, 1 μm on the left panel and 500 nm on the right panel. HAase, hyaluronidase; HPase, heparinase. (D) Histological analysis of 40 kDa FITC‐Dextran (green) leakage from isolectin‐B4 (IB4)‐ stained blood vessels (red) at 6 h after GCX degrasation induced by HAase. Upper and lower histological panels displayed BBB leakage in the cortex (Scale bar, 20 μm) and hippocampus (Scale bar, 50 μm), respectively. (E) IgG in the whole brain was visualized by peroxidase‐based immunohistochemistry. There was a macroscopically visible leakage of IgG in HAase group. Right histological panels displayed high magnifications. Scale bar, 100 μm
FIGURE 8
FIGURE 8
Cav1‐knockdown mice displayed reduced BBB permeability and lighter brain edema after t‐MCAO. (A) Six‐week‐old mice received intracerebroventricular injections of control virus (AAV9‐mCherry, two microliters of 1013 vg/ml) or one that decreased expression of Cav1(AAV9‐mCherry‐Cav1). Three weeks after injection, distribution of AAV9‐mCherry on brain sections were examined under confocal microscope. Red fluorescence was clearly seen in brain parenchyma. Comparison of mRNA levels (B) and protein levels (C, D) in cortical lysate from animals injected with either AAV9‐control or AAV9‐Cav1 showed significant decreases in Cav1 expression. *p < 0.05, **p < 0.0 vs. the AAV9‐control group. (E, F) Representative images and quantitative analysis of and EB extravasation at 6h after t‐MCAO between the AAV9‐control and AAV9‐Cav1 group. (G‐I) Representative T2‐weighted images and comparison of brain edema index in different groups. *p < 0.05, **p < 0.01 vs. the AAV9‐control group
FIGURE 9
FIGURE 9
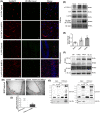
GCX degradation‐induced BBB disruption is Cav1‐dependent. (A) Histological analysis of 40 KD FITCDextran (green) leakage from isolectin‐B4 (IB4)‐stained blood vessels (red) in Cav1 knockdown mice at 6h after GCX degrasation induced by HAase. Upper and lower histological panels displayed BBB leakage in the cortex (Scale bar, 20 μm) and hippocampus (Scale bar, 50 μm), respectively. (B, C) EM evaluation of vesicles‐transport function showed that Cav1‐knockdown significantly reduced the the number of HRP‐filled vesicles in HAase treated mice, compared with the control group. **p < 0.01 vs. the AAV9‐control group. (D, E) Western blot results of p‐Cav1, p‐syndecan1. *p < 0.05 and ***p < 0.001vs. the sham group. (F) The association of syndecan1 and Src detected by immunoprecipitation at 6h after using HAase or t‐MCAO. (G) The direct interaction between syndecan1 and Src detected by GST pull down

Similar articles

Cited by

References

    1. Daneman R, Prat A. The blood‐brain barrier. Cold Spring Harb Perspect Biol. 2015;7(1):a020412. - PMC - PubMed
    1. Stokum JA, Gerzanich V, Simard JM. Molecular pathophysiology of cerebral edema. J Cereb Blood Flow Metab. 2016;36(3):513–38. - PMC - PubMed
    1. Andreone BJ, Chow BW, Tata A, Lacoste B, Ben‐Zvi A, Bullock K, et al. Blood‐brain barrier permeability is regulated by lipid transport‐dependent suppression of caveolae‐mediated transcytosis. Neuron. 2017;94(3):581–94.e5. - PMC - PubMed
    1. Sandoval KE, Witt KA. Blood‐brain barrier tight junction permeability and ischemic stroke. Neurobiol Dis. 2008;32(2):200–19. - PubMed
    1. Kuroiwa T, Ting P, Martinez H, Klatzo I. The biphasic opening of the blood‐brain barrier to proteins following temporary middle cerebral artery occlusion. Acta Neuropathol. 1985;68(2):122–9. - PubMed

Publication types