. 2021 Oct 1;22(19):2872-2879.
doi: 10.1002/cbic.202100301. Epub 2021 Jul 30.

Peptide-PAINT Enables Investigation of Endogenous Talin with Molecular Scale Resolution in Cells and Tissues

Affiliations

Peptide-PAINT Enables Investigation of Endogenous Talin with Molecular Scale Resolution in Cells and Tissues

Lisa S Fischer et al. Chembiochem. .

Abstract

Talin is a cell adhesion molecule that is indispensable for the development and function of multicellular organisms. Despite its central role for many cell biological processes, suitable methods to investigate the nanoscale organization of talin in its native environment are missing. Here, we overcome this limitation by combining single-molecule resolved PAINT (points accumulation in nanoscale topography) imaging with the IRIS (image reconstruction by integrating exchangeable single-molecule localization) approach, enabling the quantitative analysis of genetically unmodified talin molecules in cells. We demonstrate that a previously reported peptide can be utilized to specifically label the two major talin isoforms expressed in mammalian tissues with a localization precision of <10 nm. Our experiments show that the methodology performs equally well as state-of-the-art single-molecule localization techniques, and the first applications reveal a thus far undescribed cell adhesion structure in differentiating stem cells. Furthermore, we demonstrate the applicability of this peptide-PAINT technique to mouse tissues paving the way to single-protein imaging of endogenous talin proteins under physiologically relevant conditions.

Keywords: cell adhesion; peptides; protein-protein interactions; single-molecule studies; talin.


Conflict of interest statement

The authors declare no conflict of interest.

Figures

Figure 1
Figure 1
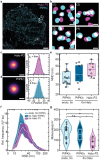
PIPKIγ‐PAINT allows single‐molecule resolved measurements in cells. a) Schematic overview of the PIPKIγ‐PAINT concept. The strategy uses a previously described,[ 19 , 20 ] 28 amino acid (aa) long peptide (PIPKIγ) with a Cy3b modification at the N‐terminus (Cy3b‐PIPKIγ). The peptide binds transiently through a distinct interaction motif (blue) to the FERM domain of talin. b) Side‐by‐side view of a diffraction‐limited (DL) image of paxillin localization in focal adhesions (FAs) and super‐resolved (SR) Cy3b‐PIPKIγ‐PAINT image of endogenous talin. c) Zoom‐in of the outlined area in b shows the diffraction limited paxillin image and a super‐resolved view of talin localization clouds in FAs. d) Single‐molecule detection of talin using an automated cluster detection algorithm based on a modified Ripley's K function. e) Distribution of the ON time (τb) for Cy3b‐PIPKIγ (mean τb=223 ms; n=10,843 localization clouds). f) The mean dark time of Cy3b‐PIPKIγ was determined by fitting the cumulative distribution function of the dark times (n=10,843 localization clouds). g) Evaluation of the localization precision by NeNA‐based analysis of all cells imaged with Cy3b‐PIPKIγ indicates an average localization precision of 9.6 nm (n=40 cells). h) Separation of distinct talin localization clouds and cross‐sectional histogram analysis reveals high‐resolution PAINT imaging using Cy3b‐PIPKIγ. Arrows indicate the plotting direction of the histogram, with arrowheads pointing towards the x‐axis. i) Average of 10,843 single talin localization clouds obtained by PIPKIγ‐PAINT aligned to their center‐of‐mass. Gaussian fit of aligned 10,843 single talin localization clouds indicates a localization precision of 11 nm. j) Quantitative PAINT evaluation of individual talin localization clouds reveals unimodal distribution of binding events (mean=24), indicating molecular resolution imaging (n=10,843 localization clouds). k) Side‐by‐side view of Exchange‐PAINT images acquired with Cy3b‐PIPKIγ and the scrambled control peptide (Cy3b‐control). l) Zoom‐in of outlined area in k shows repetitive binding events indicative of a specific interaction. m) Zoom‐in of outlined area in k reveals isolated, non‐repetitive binding events. Boxplots show median and 25th and 75th percentage with whiskers reaching to the last data point within 1.5×interquartile range. ON time distributions show mean±standard deviations. Scale bars: 6.5 μm (b), 3.5 μm (k), 200 nm (c, d), 130 nm (l, m) 40 nm (h) 20 nm (i).
Figure 2
Figure 2
PIPKIγ‐PAINT allows the detection of both major talin isoforms. a) Overlay of Exchange‐PAINT data from DNA‐PAINT and PIPKIγ‐PAINT of a talin‐1‐HaloTag expressing cell (Talin‐1). b) Zoom into the focal adhesion (FA) area outlined in a shows single‐labeled talin localization clouds acquired with a P3 imager strand and the corresponding image upon automated localization cloud detection. c) Zoom into FA area outlined in a shows single‐labeled talin localization clouds acquired with Cy3b‐PIPKIγ and the localization cloud detection using an automated analysis pipeline. d) Zoom‐ins highlighted in a reveal co‐localization of Cy3b‐PIPKIγ (blue) and DNA‐PAINT (magenta) signals both labeling talin‐1. e) Exchange‐PAINT experiment with a talin‐2‐Halo expressing cell (Talin‐2). Overlay displays a cell consecutively imaged with PIPKIγ‐PAINT and DNA‐PAINT. f) Zoom into FA area of a talin‐2 expressing cell outlined in e shows single‐labeled talin‐2 localization clouds acquired with P3 imager strand and detection of talin‐2‐HaloTag localization clouds. g) Zoom into FA area outlined in e shows single talin‐2 localization clouds acquired with Cy3b‐PIPKIγ in talin‐2 expressing cells and the corresponding cluster detection image. h) Zoom‐ins highlighted in e reveal co‐localization of Cy3b‐PIPKIγ (blue) and DNA‐PAINT (magenta) signals of talin‐2. Scale bars: 5 μm (a, e), 220 nm (b, c, f, g), 40 nm (d, h).
Figure 3
Figure 3
PIPKIγ‐PAINT enables high quality single‐molecule imaging matching DNA‐PAINT. a) Representative image of a talin‐1‐HaloTag expressing cell imaged with Cy3b‐PIPKIγ (blue) and DNA‐PAINT (Halo‐P3, magenta). b) Zoom‐ins highlighted in a reveal co‐localization of Cy3b‐PIPKIγ (blue) and DNA‐PAINT (magenta) signals. c) Aligned localization cloud from 100 individual talin‐1‐HaloTag localization clouds imaged with a P3 imager strand; cross‐sectional histogram with a Gaussian fit yielded a localization precision of 8 nm (n=100 localization clouds). d) Aligned talin localization cloud from 100 individual talin‐1‐HaloTag localization clouds obtained with PIPKIγ‐PAINT; cross‐sectional histogram with a Gaussian fit yielded a localization precision of 8.5 nm (n=100 localization clouds). e) Medians of nearest‐neighbor distances (NNDs) of endogenous talin in MEFs and talin‐1‐HaloTag in MKFs imaged with PIPKIγ‐PAINT and DNA‐PAINT (nwt‐PIPKI=20207; ntln‐Halo‐PIPKI=8215; ntln‐Halo‐P3=9077 talin NNDs; nwt‐PIPKI=17; ntln‐Halo‐PIPKI=9; ntln‐Halo‐P3=9 cells). f) PAINT‐based NND distributions (plotted as relative frequency (Rel. frequency) in arbitrary units (au)) in MEFs (light blue, PIPKIγ) and in talin‐1‐HaloTag expressing (Tln1 −/− Tln2 −/−) MKFs (dark blue, PIPKIγ) indicate a shift toward smaller distances when compared with DNA‐PAINT measurements (magenta, Halo) (nwt‐PIPKI=20207; ntln‐Halo‐PIPKI=8215; ntln‐Halo‐P3=9077 talin NNDs; nwt‐PIPKI=17; ntln‐Halo‐PIPKI=9; ntln‐Halo‐P3=9 cells). g) Analyzing the molecular density of talin in MEFs (light blue, PIPKIγ) and talin‐1‐HaloTag expressing MKFs (dark blue, PIPKIγ) indicates less efficient labeling by DNA‐PAINT (magenta, Halo). Imaging endogenous talin in MEFs using Cy3b‐PIPKIγ yields a molecular density in FAs of about 200 molecules/μm2 (nwt‐PIPKI=17; ntln‐Halo‐PIPKI=9; ntln‐Halo‐P3=9 cells; p‐valuewt‐PIPKI, tln‐Halo‐PIPKI=0.328; p‐valuetln‐Halo‐PIPKI, tln‐Halo‐P3=0.01801; p‐valuewt‐PIPKI, tln‐Halo‐P3=0.0033). Boxplots show median and 25th and 75th percentage with whiskers reaching to the last data point within 1.5×interquartile range. NND distributions show mean±standard deviations. Two‐sample t test: ** p≤0.01, * p≤0.05, n.s. (not significant) p>0.05. Scale bars: 2 μm (a), 40 nm (b), 18 nm (c, d).
Figure 4
Figure 4
Molecular‐scale imaging of endogenous talin proteins in cells and tissues. a) Side‐by‐side view of a diffraction‐limited (DL) image of vinculin‐YPet and a super‐resolved (SR) image obtained with PIPKIγ‐PAINT of endogenous talin in mesenchymal stem cells. bc) Zoom‐in of outlined area in a reveals distinct talin localization clouds in focal adhesions (FAs); a cluster detection algorithm indicates the individual talin molecules. d) Representative brightfield image of a mesenchymal stem cell differentiated by insulin treatment into an adipocyte; note the presence of lipid droplets indicating adipogenesis. e) Side‐by‐side view of a diffraction‐limited (DL) image of vinculin and the corresponding super‐resolved (SR) PAINT image of a Cy3b‐PIPKIγ‐labeled cell showing talin reorganization into punctate adhesion structures. f) Zoom‐in of outlined area in e reveals FA islands. g) Zoom‐in of outlined area in the Cy3b‐PIPKIγ image in e shows single talin molecules within the adhesion islands. h) Zoom‐in of outlined area in g showing single talin molecules within a distinct FA island. i) NND analysis of undifferentiated mesenchymal stem cells and adipocytes reveals that talin spacing (light blue) is unchanged despite an unusual large separation distance of individual FA islands (n‐insulin=18871; n+insulin=22855; n FA islands=1819 talin NNDs; n‐insulin=3; n+insulin=7; n FA islands=7 cells; p‐value=0.49). j) Distribution of the median from NND measurements (plotted as relative frequency (Rel. frequency) in arbitrary units (au)) of endogenous talin in mesenchymal stem cells and adipocytes upon insulin treatment; for comparison NND distributions of FA islands are shown (n‐insulin=18871; n+insulin=22855; n FA islands=1819 talin NNDs; n‐insulin=3; n+insulin=7; n FA islands=7 cells). k) Diffraction limited image of a kidney section from a homozygous talin‐1‐YPet mouse shows enrichment of talin‐1 at the basement membrane of renal tubules. l) Zoom‐in of marked area in k. m) PIPKIγ‐PAINT imaging reveals enrichment of talin molecules in the membrane of renal tubules. n) Exchange‐PAINT to the scrambled Cy3b‐control shows background binding events only. Boxplots show median and 25th and 75th percentage with whiskers reaching to the last data point within 1.5×interquartile range. NND distributions show mean±standard deviations. Two‐sample t test: n.s. (not significant) p>0.05. Scale bars: 10 μm (k), 7.5 μm (a), 7 μm (d, e), 1.4 μm (f, g), 250 nm (b, c), 150 nm (ln), 50 nm (h).

References

    1. Geiger B., Spatz J. P., Bershadsky A. D., Nat. Rev. Mol. Cell Biol. 2009, 10, 21. - PubMed
    1. Kechagia J. Z., Ivaska J., Roca-Cusachs P., Nat. Rev. Mol. Cell Biol. 2019, 20, 457. - PubMed
    1. Critchley D. R., Ann. Rev. Biophys. Bioeng. 2009, 38, 235. - PubMed
    1. Tadokoro S., Shattil S. J., Eto K., Tai V., Liddington R. C., de Pereda J. M., Ginsberg M. H., Calderwood D. A., Science 2003, 302, 103. - PubMed
    1. Austen K., Ringer P., Mehlich A., Chrostek-Grashoff A., Kluger C., Klingner C., Sabass B., Zent R., Rief M., Grashoff C., Nat. Cell Biol. 2015, 17, 1597. - PMC - PubMed

Publication types