

A Comprehensive Map of Mycobacterium tuberculosis Complex Regions of Difference
- PMID: 34287002
- PMCID: PMC8386458
- DOI: 10.1128/mSphere.00535-21
A Comprehensive Map of Mycobacterium tuberculosis Complex Regions of Difference
Abstract
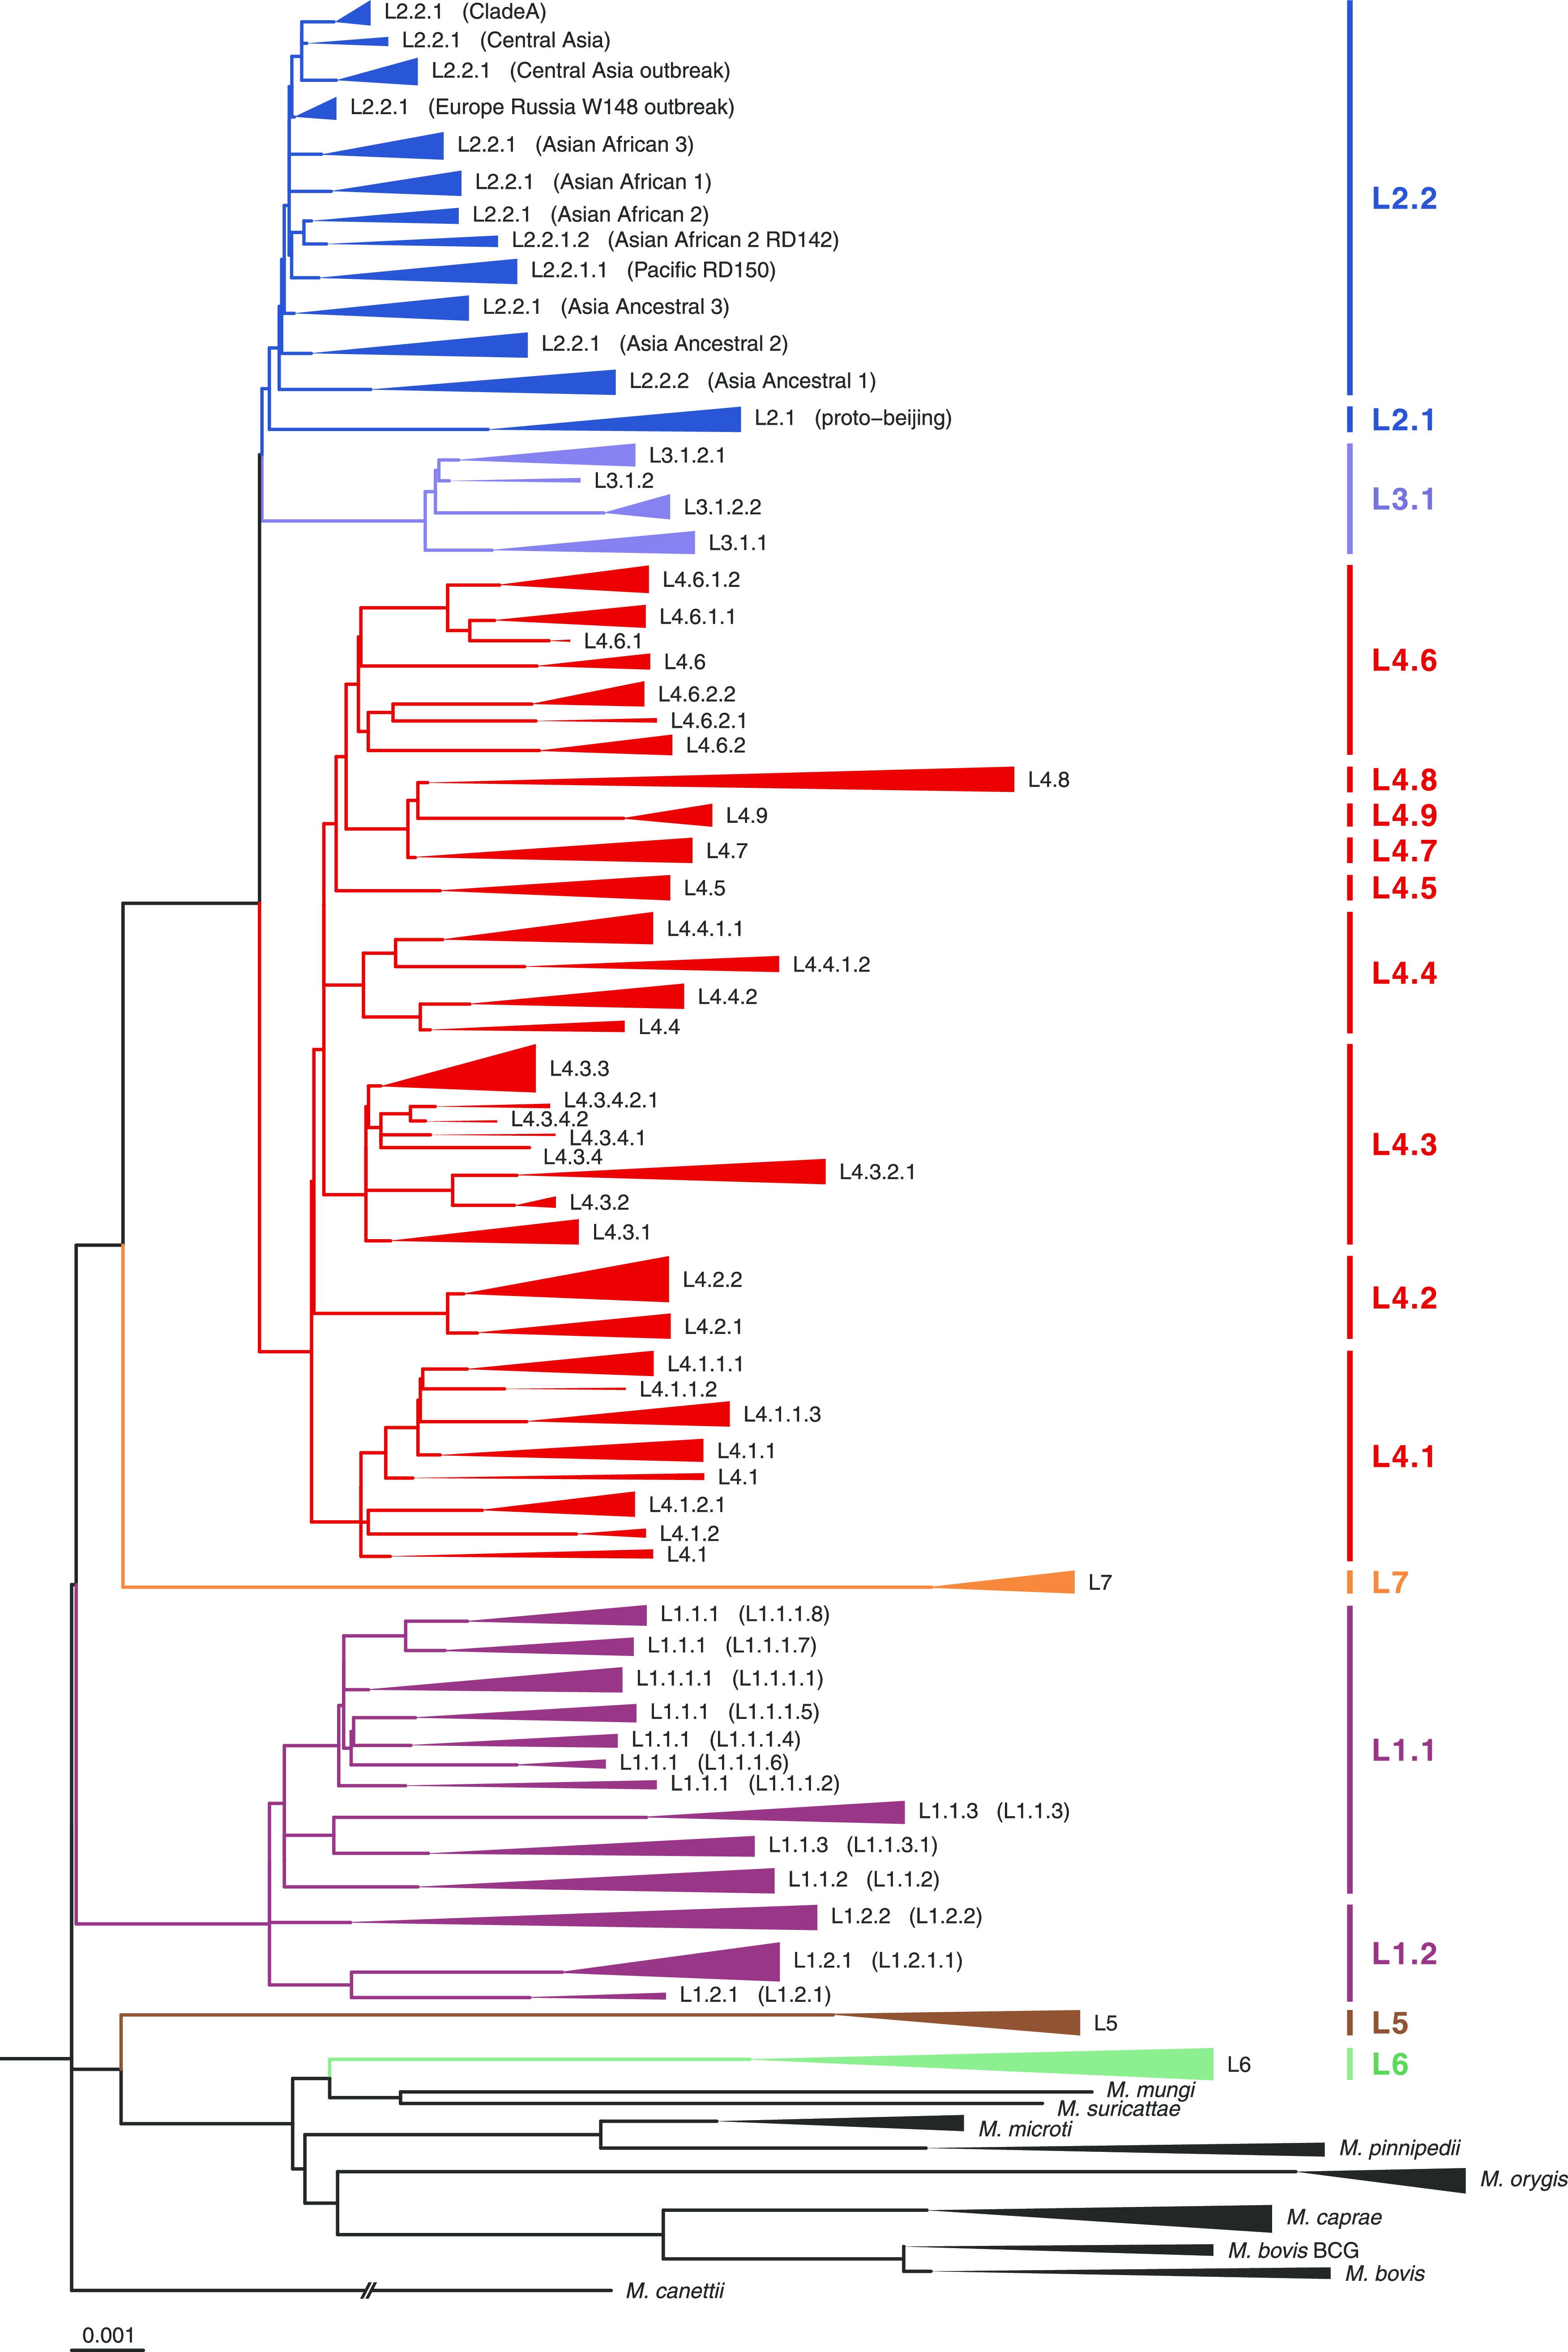
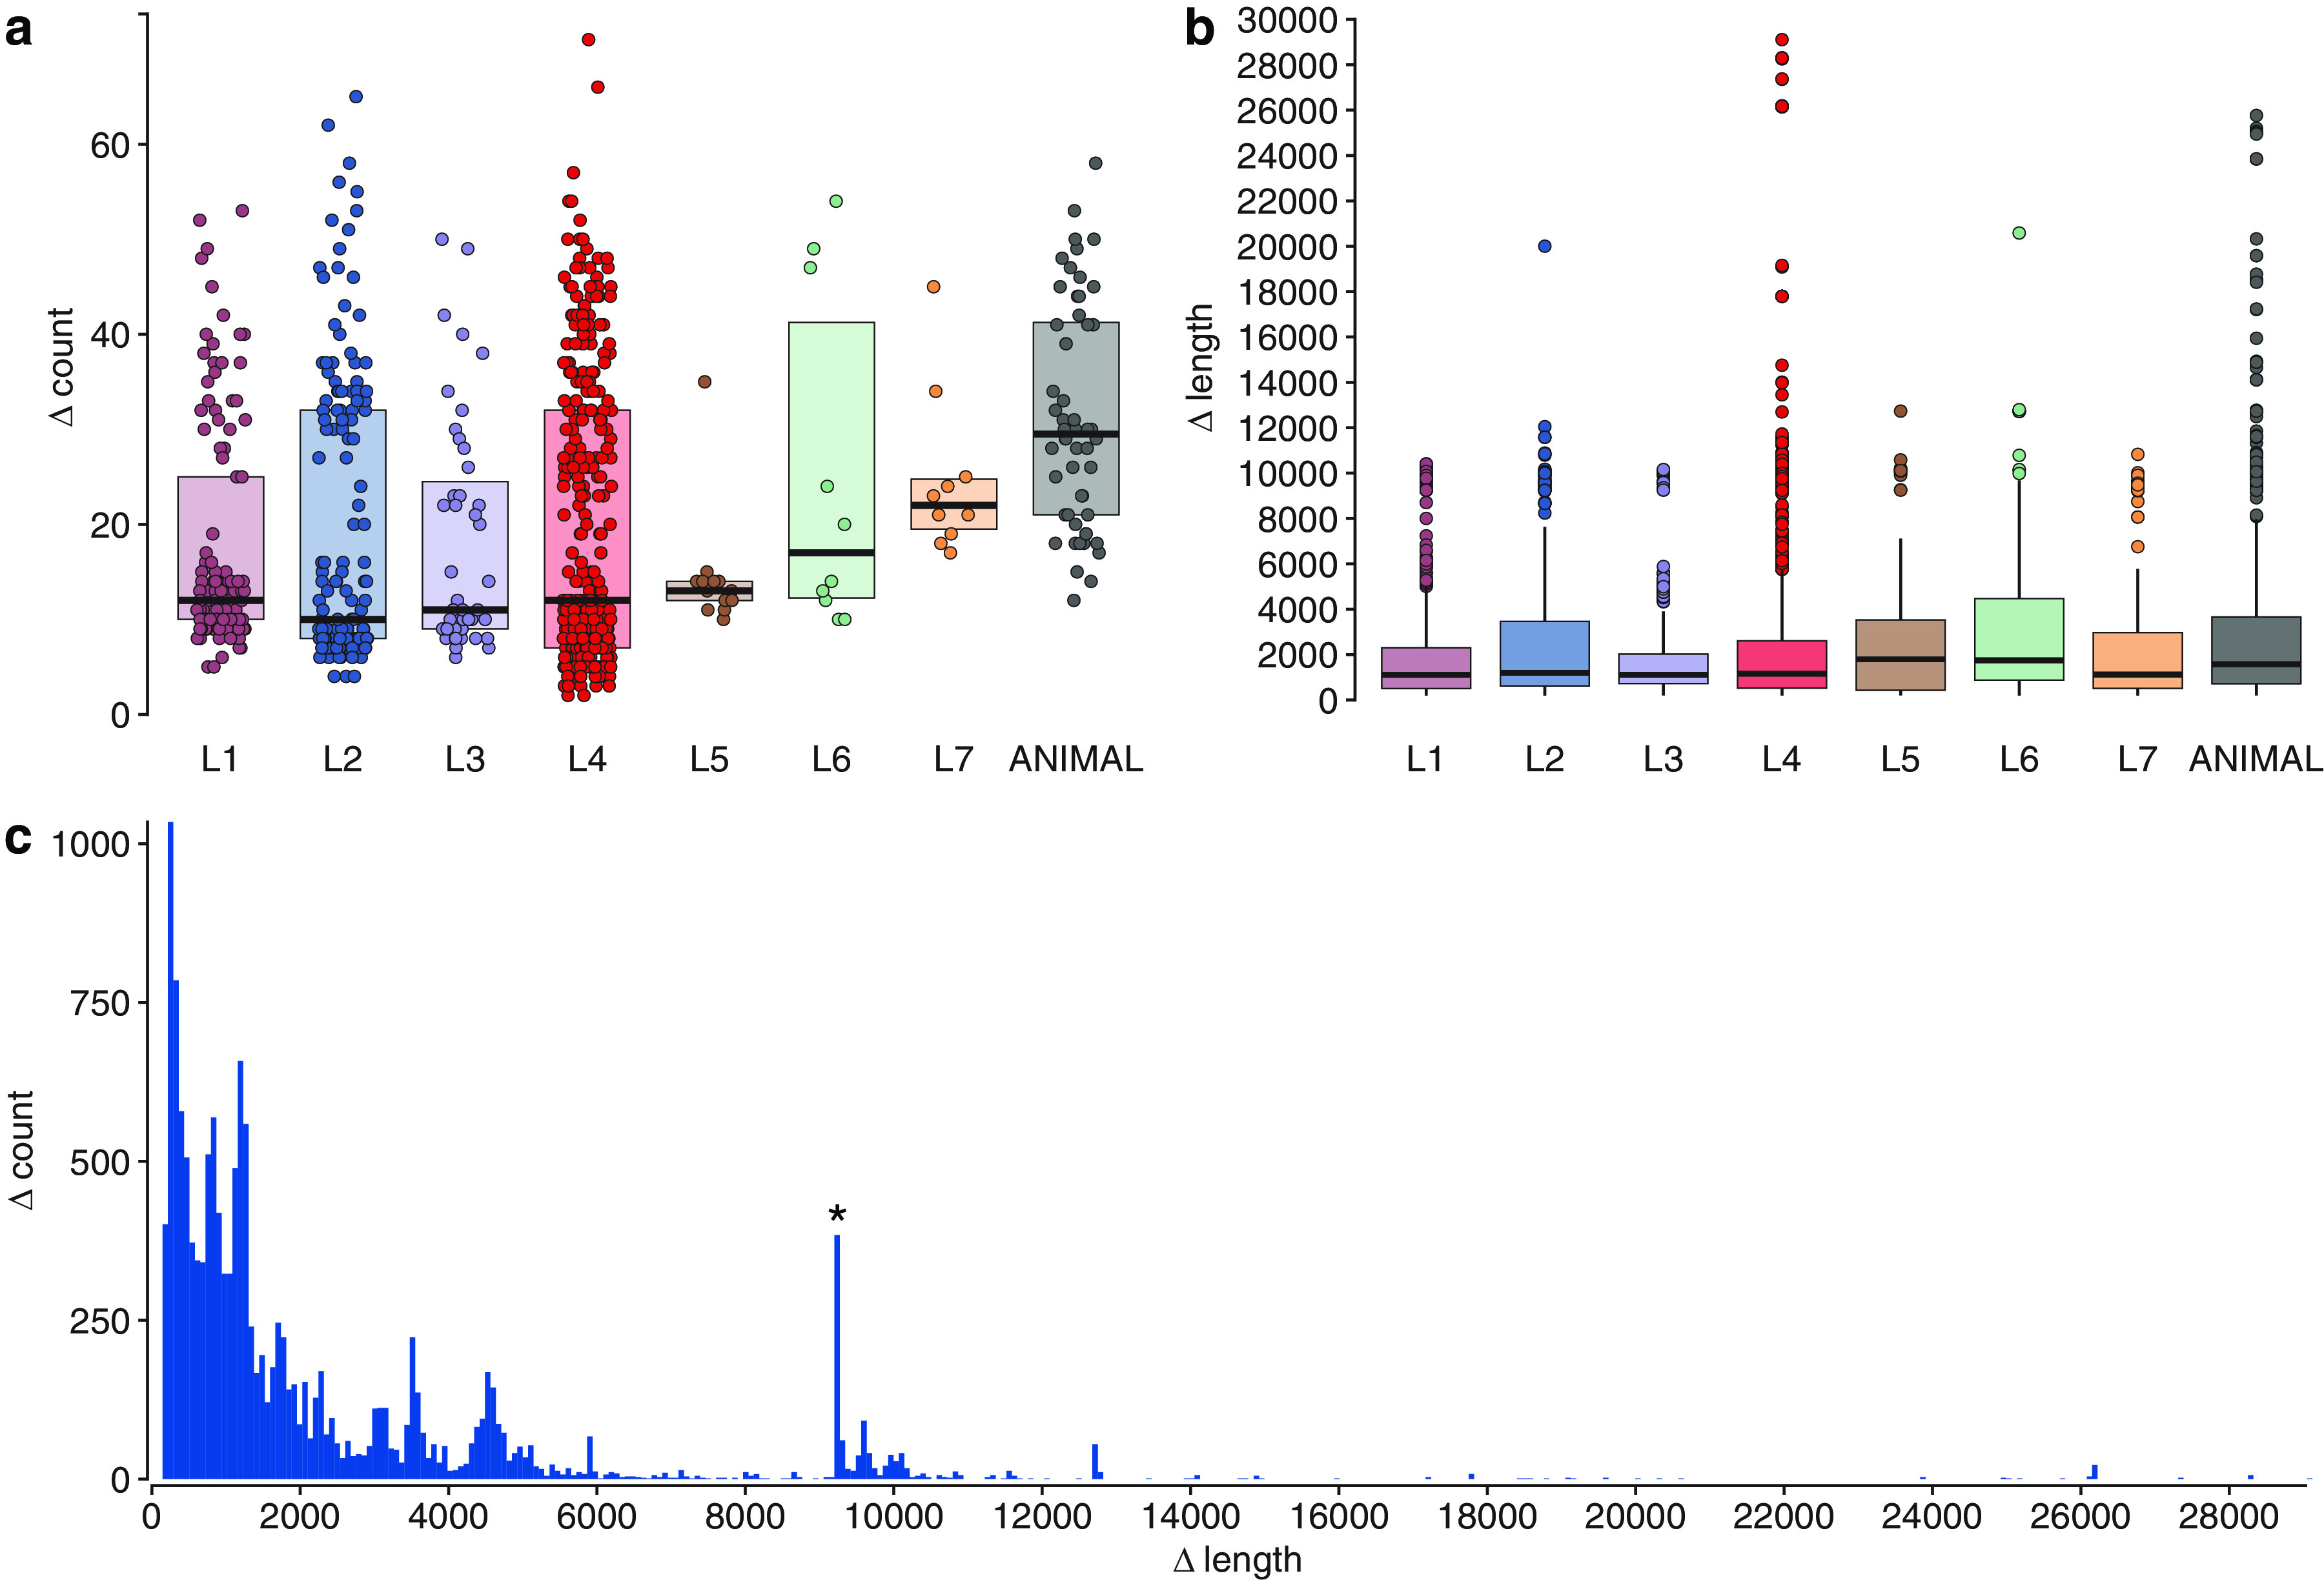
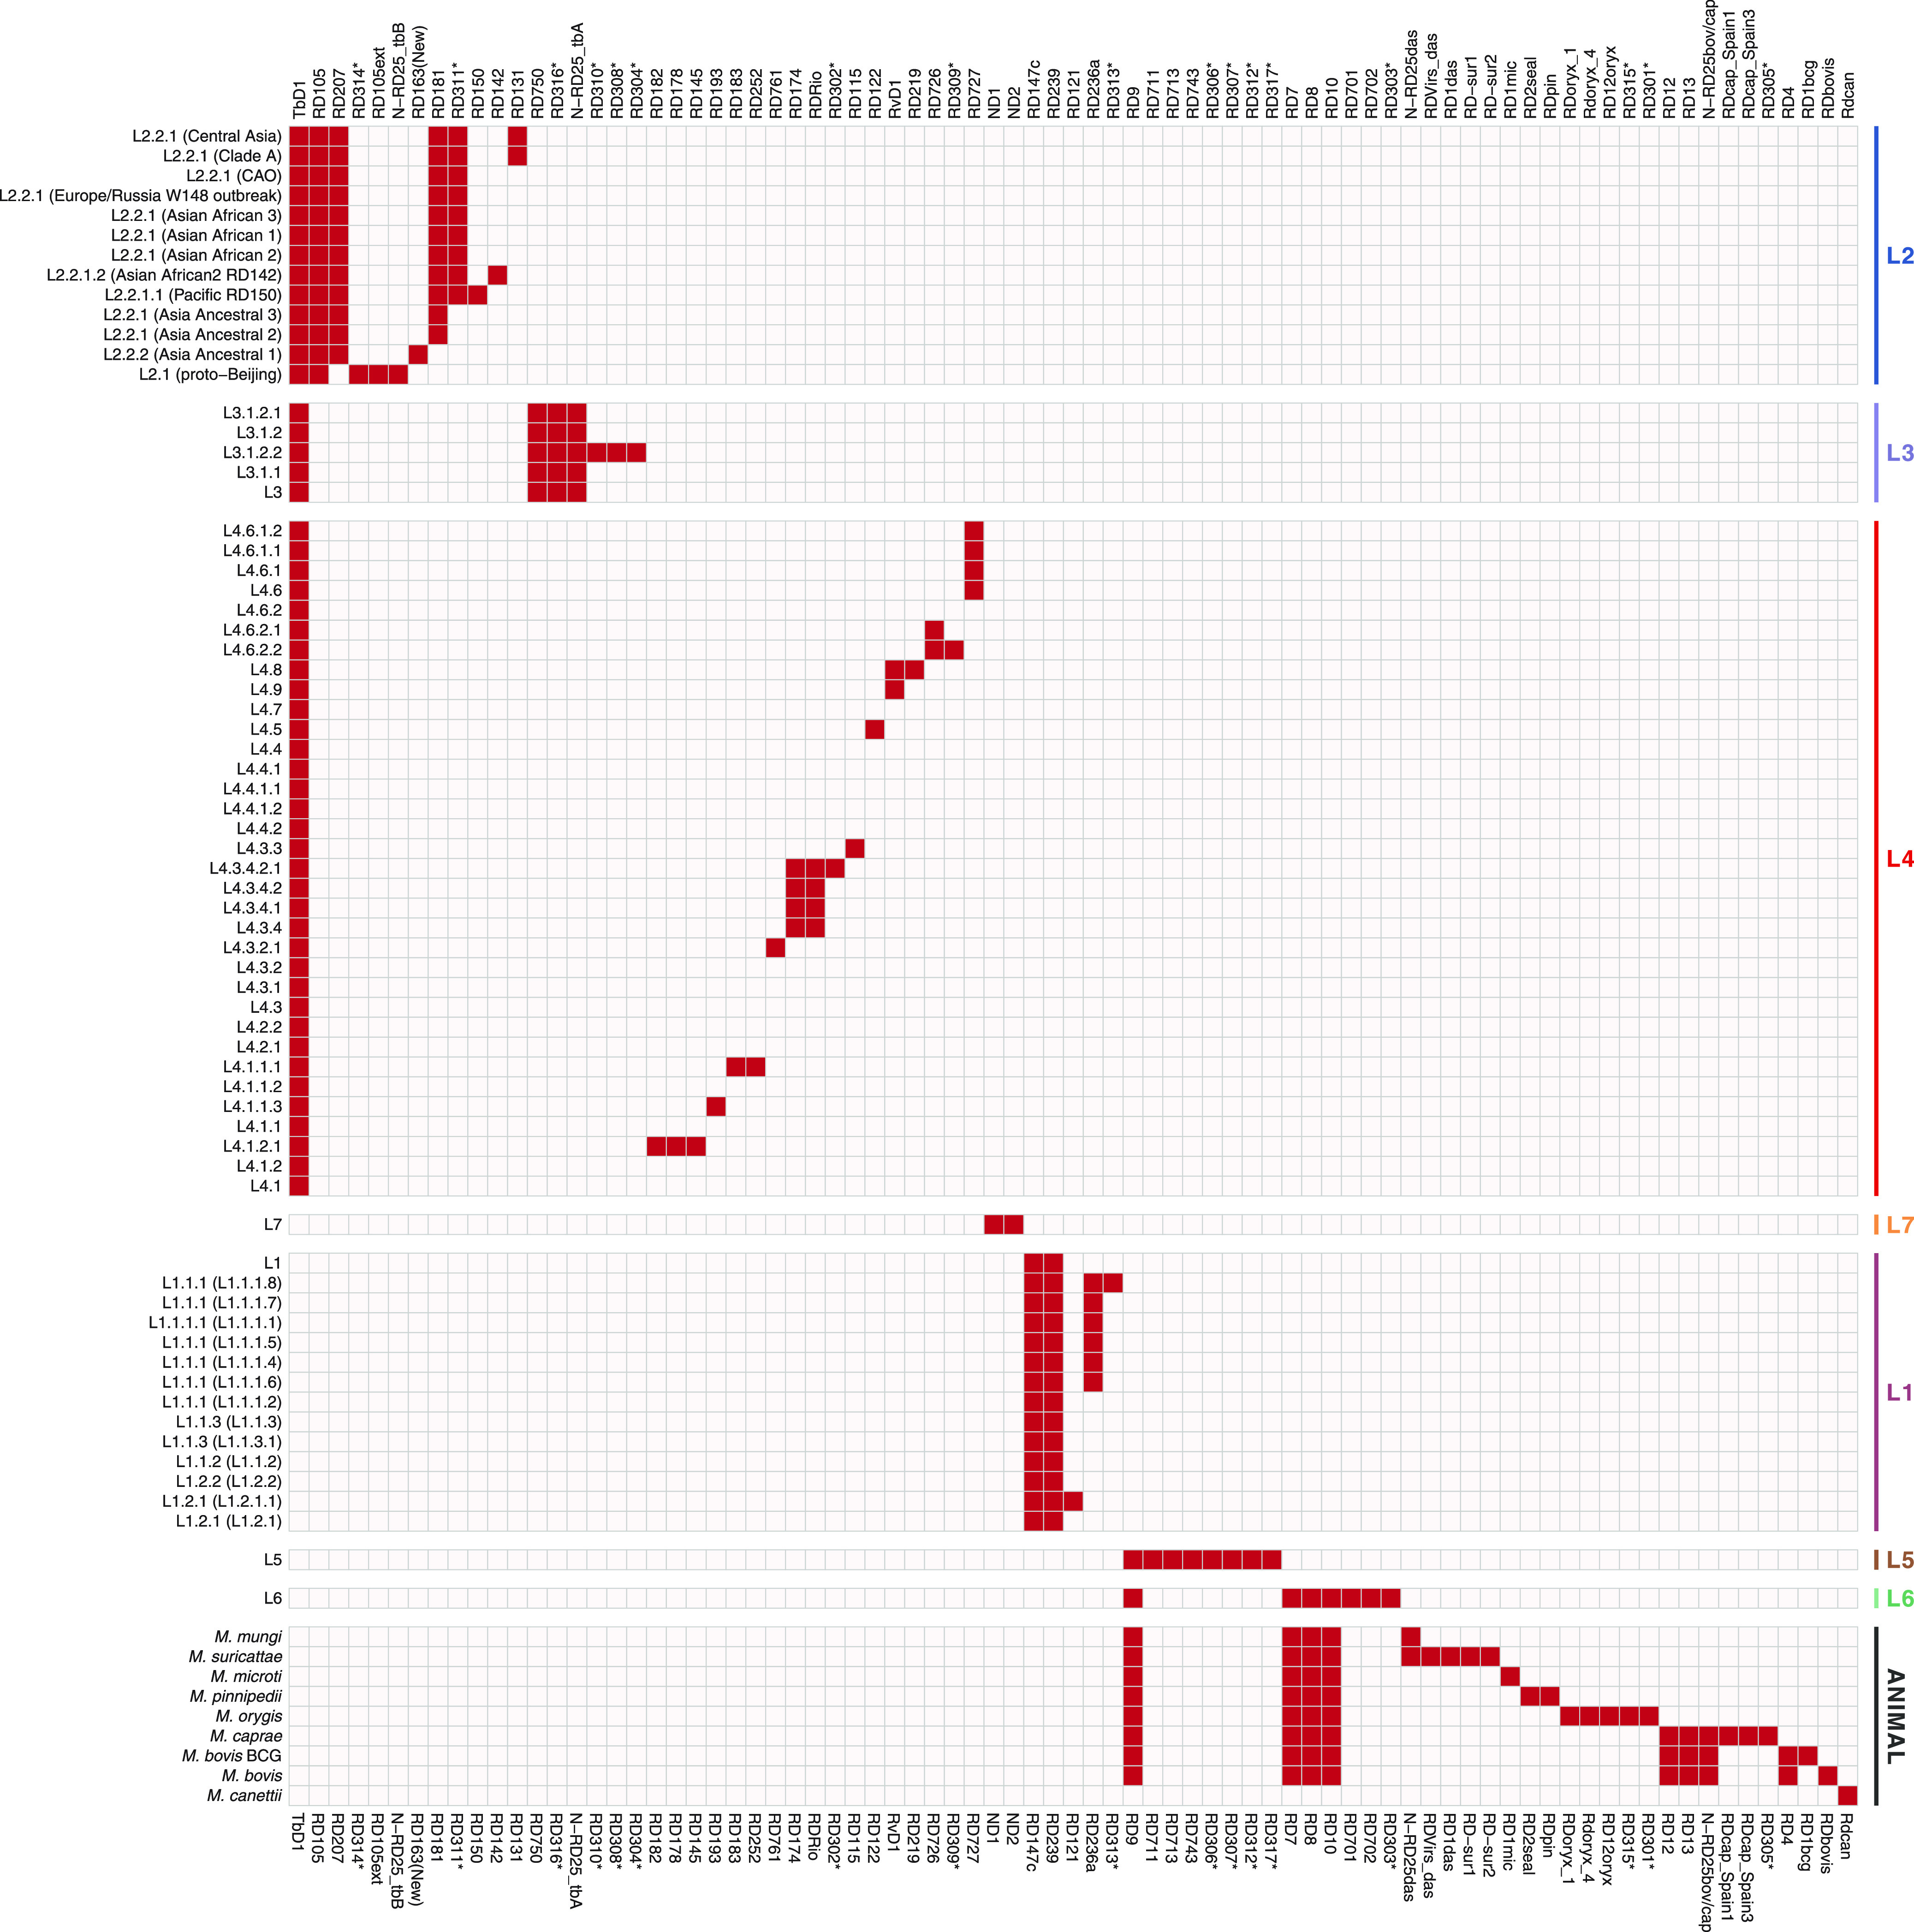
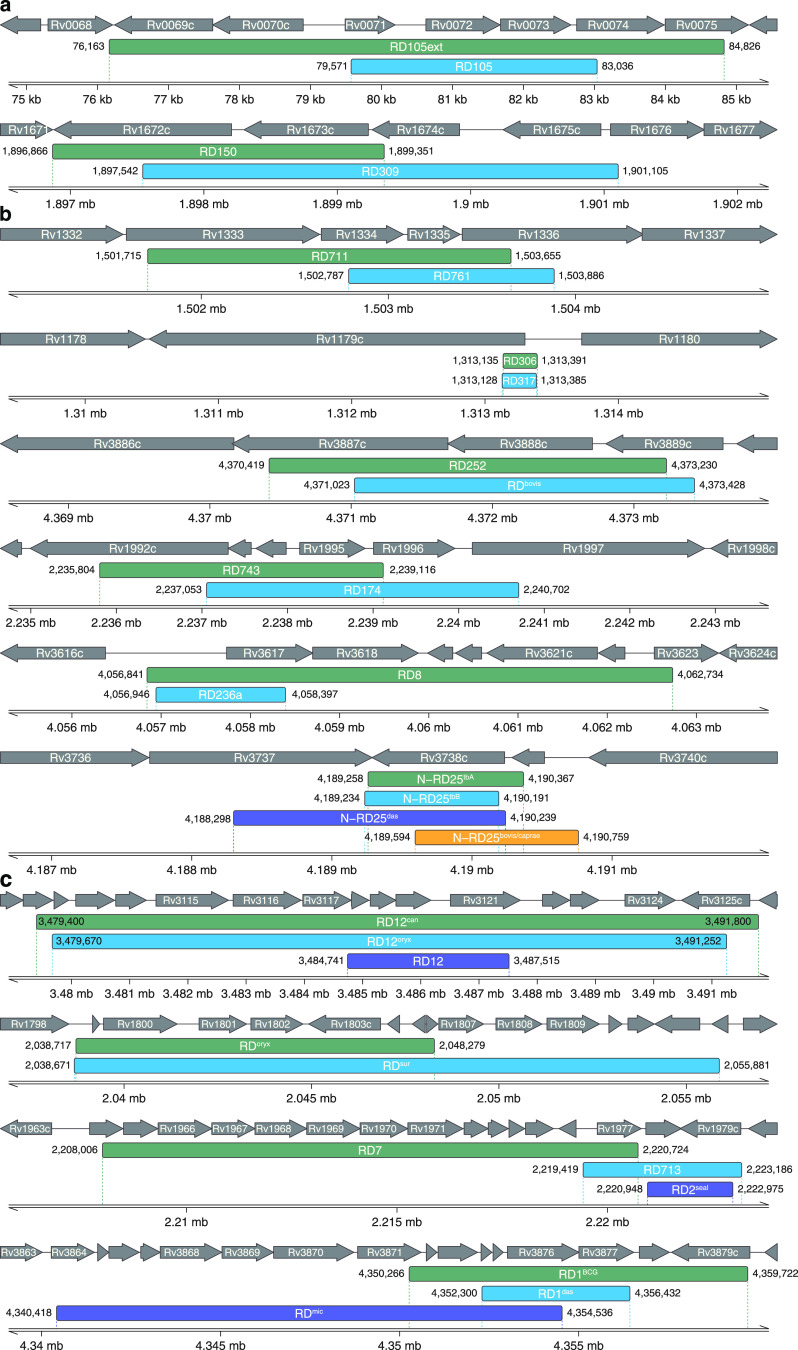
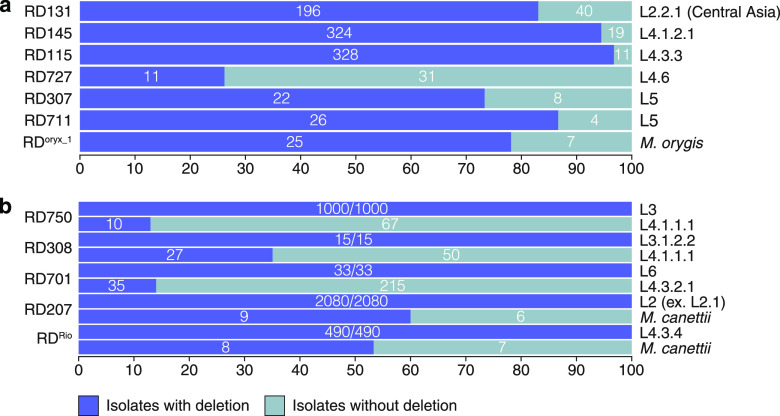
Mycobacterium tuberculosis complex (MTBC) species are classic examples of genetically monomorphic microorganisms due to their low genetic variability. Whole-genome sequencing made it possible to describe both the main species within the complex and M. tuberculosis lineages and sublineages. This differentiation is based on single nucleotide polymorphisms (SNPs) and large sequence polymorphisms in the so-called regions of difference (RDs). Although a number of studies have been performed to elucidate RD localizations, their distribution among MTBC species, and their role in the bacterial life cycle, there are some inconsistencies and ambiguities in the localization of RDs in different members of the complex. To address this issue, we conducted a thorough search for all possible deletions in the WGS data collection comprising 721 samples representing the full MTBC diversity. Discovered deletions were compared with a list of all previously described RDs. As with the SNP-based analysis, we confirmed the specificities of 79 regions at the species, lineage, or sublineage level, 17 of which are described for the first time. We also present RDscan (https://github.com/dbespiatykh/RDscan), an open-source workflow, which detects deletions from short-read sequencing data and correlates the results with high-specificity RDs, curated in this study. Testing of the workflow on a collection comprising ∼7,000 samples showed a high specificity of the found RDs. This study provides novel details that can contribute to a better understanding of the species differentiation within the MTBC and can help to determine how individual clusters evolve within various MTBC species. IMPORTANCE Reductive genome evolution is one of the most important and intriguing adaptation strategies of different living organisms to their environment. Mycobacterium offers several notorious examples of either naturally reduced (Mycobacterium leprae) or laboratory-reduced (Mycobacterium bovis BCG) genomes. Mycobacterium tuberculosis complex has its phylogeny unambiguously framed by large sequence polymorphisms that present unidirectional unique event changes. In the present study, we curated all known regions of difference and analyzed both Mycobacterium tuberculosis and animal-adapted MTBC species. For 79 loci, we have shown a relationship with phylogenetic units, which can serve as a marker for diagnosing or studying biological effects. Moreover, intersections were found for some loci, which may indicate the nonrandomness of these processes and the involvement of these regions in the adaptation of bacteria to external conditions.
Keywords: MTBC; Mycobacterium tuberculosis complex; RD; comparative genomics; deletions; large sequence polymorphisms; regions of difference; structural variants.
Figures
References
-
- Garnier T, Eiglmeier K, Camus JC, Medina N, Mansoor H, Pryor M, Duthoy S, Grondin S, Lacroix C, Monsempe C, Simon S, Harris B, Atkin R, Doggett J, Mayes R, Keating L, Wheeler PR, Parkhill J, Barrell BG, Cole ST, Gordon SV, Hewinson RG. 2003. The complete genome sequence of Mycobacterium bovis. Proc Natl Acad Sci U S A 100:7877–7882. doi:10.1073/pnas.1130426100. - DOI - PMC - PubMed
-
- van Soolingen D, Hoogenboezem T, de Haas PEW, Hermans PWM, Koedam MA, Teppema KS, Brennan PJ, Besra GS, Portaels F, Top J, Schouls LM, van Embden JDA. 1997. A novel pathogenic taxon of the Mycobacterium tuberculosis complex, Canetti: characterization of an exceptional isolate from Africa. Int J Syst Bacteriol 47:1236–1245. doi:10.1099/00207713-47-4-1236. - DOI - PubMed
-
- Niemann S, Richter E, Rüsch-Gerdes S. 2002. Biochemical and genetic evidence for the transfer of Mycobacterium tuberculosis subsp. caprae Aranaz et al. 1999 to the species Mycobacterium bovis Karlson and Lessel 1970 (approved list 1980) as Mycobacterium bovis subsp. caprae comb. nov. Int J Syst Evol Microbiol 52:433–436. doi:10.1099/00207713-52-2-433. - DOI - PubMed
Publication types
MeSH terms
LinkOut - more resources
Full Text Sources
Other Literature Sources
Research Materials
Miscellaneous
