. 2021 Aug 25;6(4):e0055221.
doi: 10.1128/mSphere.00552-21. Epub 2021 Jul 21.

Establishment of a Patient-Derived, Magnetic Levitation-Based, Three-Dimensional Spheroid Granuloma Model for Human Tuberculosis

Affiliations

Establishment of a Patient-Derived, Magnetic Levitation-Based, Three-Dimensional Spheroid Granuloma Model for Human Tuberculosis

Leigh A Kotze et al. mSphere. .

Abstract

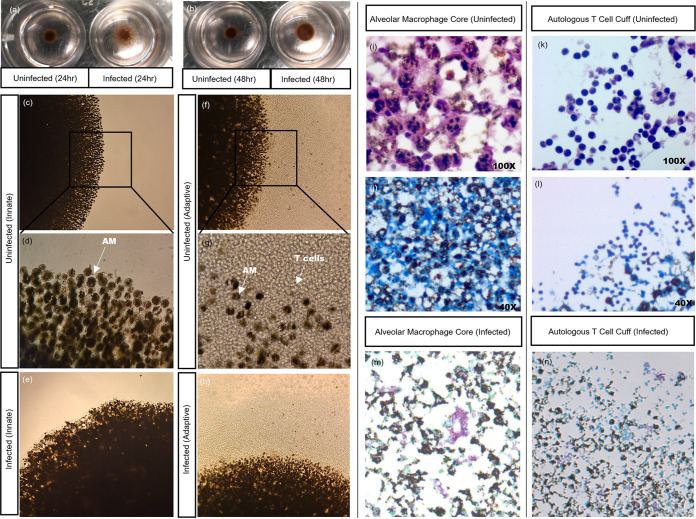
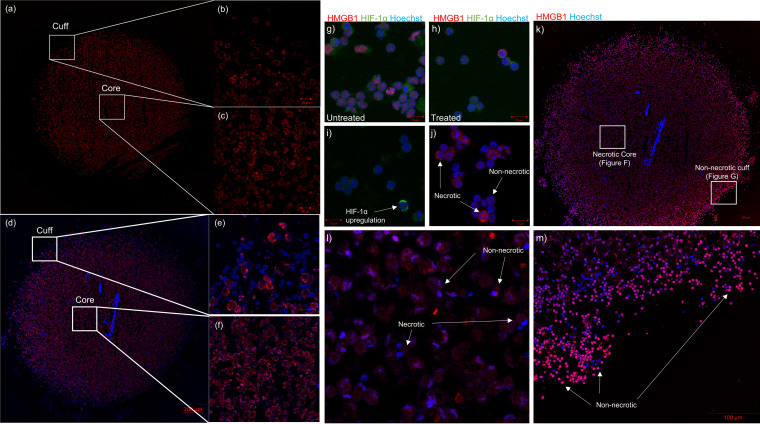
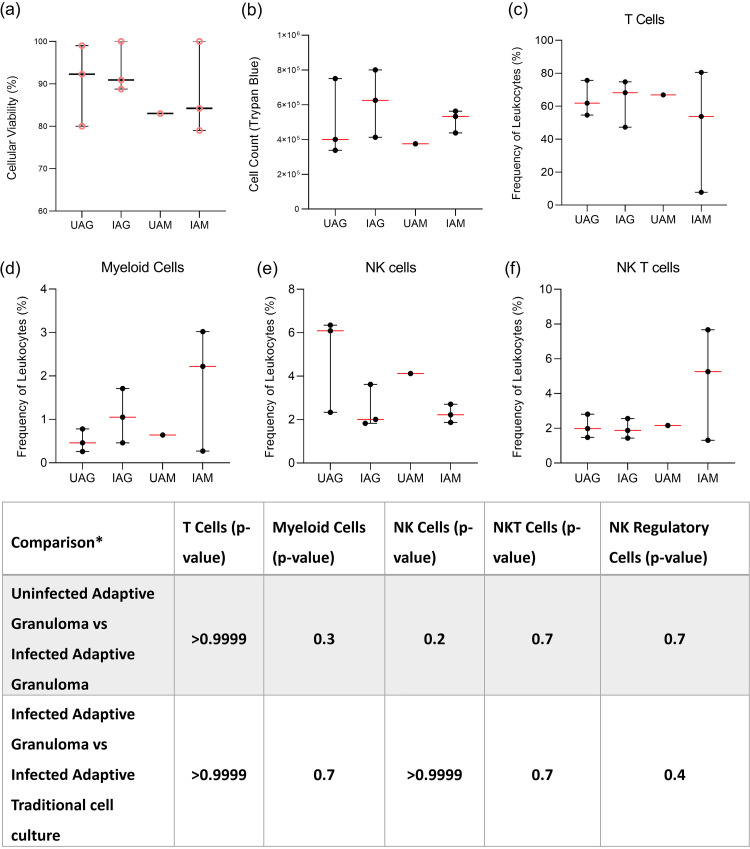
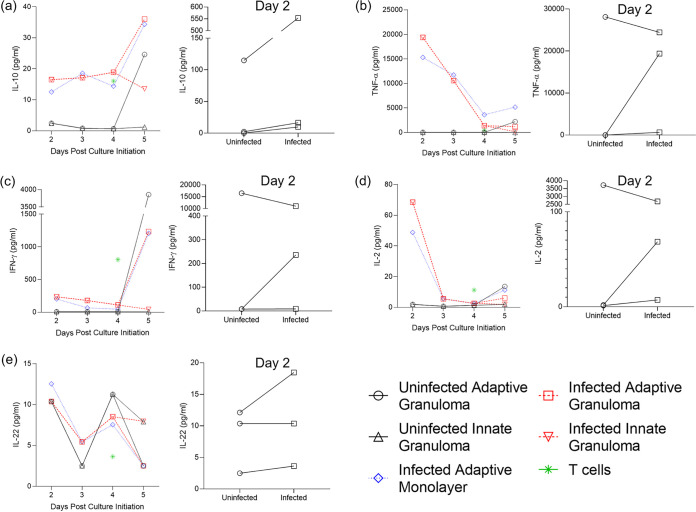
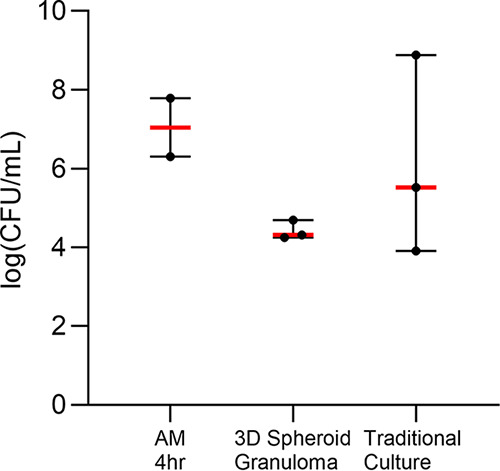
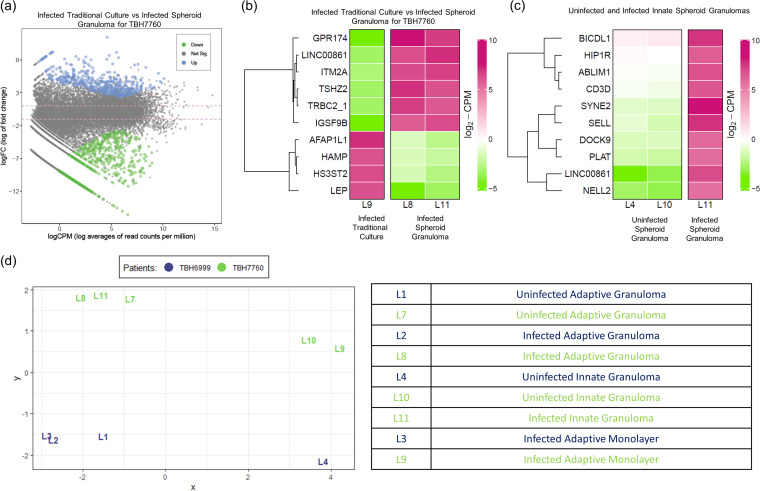
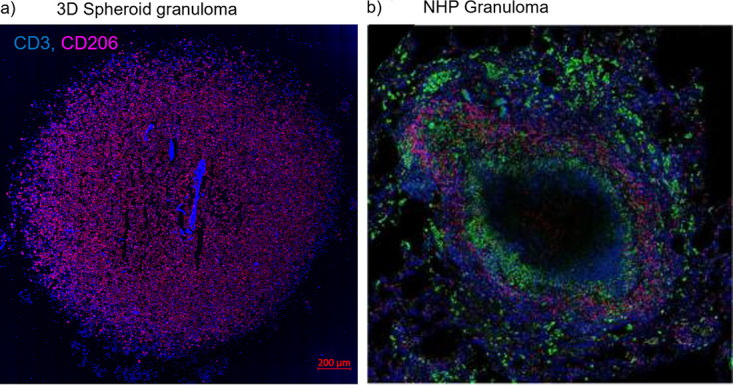
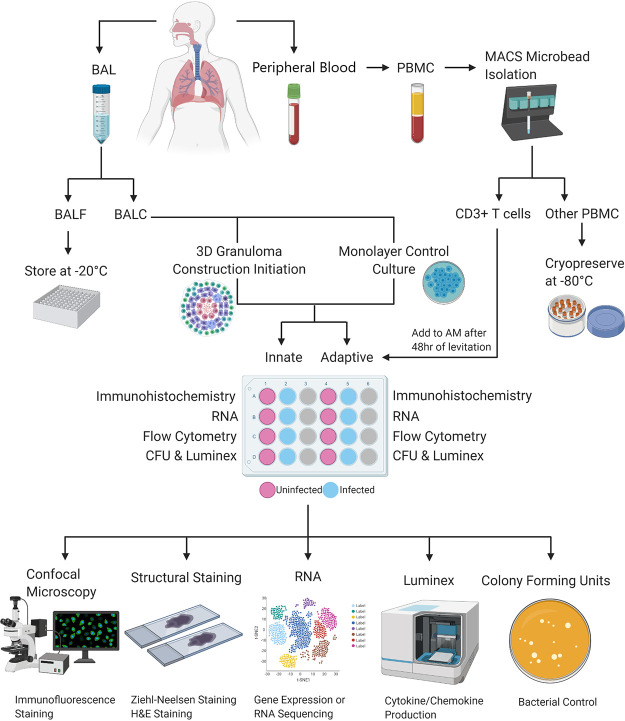
Tuberculous granulomas that develop in response to Mycobacterium tuberculosis (M. tuberculosis) infection are highly dynamic entities shaped by the host immune response and disease kinetics. Within this microenvironment, immune cell recruitment, polarization, and activation are driven not only by coexisting cell types and multicellular interactions but also by M. tuberculosis-mediated changes involving metabolic heterogeneity, epigenetic reprogramming, and rewiring of the transcriptional landscape of host cells. There is an increased appreciation of the in vivo complexity, versatility, and heterogeneity of the cellular compartment that constitutes the tuberculosis (TB) granuloma and the difficulty in translating findings from animal models to human disease. Here, we describe a novel biomimetic in vitro three-dimensional (3D) human lung spheroid granuloma model, resembling early "innate" and "adaptive" stages of the TB granuloma spectrum, and present results of histological architecture, host transcriptional characterization, mycobacteriological features, cytokine profiles, and spatial distribution of key immune cells. A range of manipulations of immune cell populations in these spheroid granulomas will allow the study of host/pathogen pathways involved in the outcome of infection, as well as pharmacological interventions. IMPORTANCE TB is a highly infectious disease, with granulomas as its hallmark. Granulomas play an important role in the control of M. tuberculosis infection and as such are crucial indicators for our understanding of host resistance to TB. Correlates of risk and protection to M. tuberculosis are still elusive, and the granuloma provides the perfect environment in which to study the immune response to infection and broaden our understanding thereof; however, human granulomas are difficult to obtain, and animal models are costly and do not always faithfully mimic human immunity. In fact, most TB research is conducted in vitro on immortalized or primary immune cells and cultured in two dimensions on flat, rigid plastic, which does not reflect in vivo characteristics. We have therefore conceived a 3D, human in vitro spheroid granuloma model which allows researchers to study features of granuloma-forming diseases in a 3D structural environment resembling in vivo granuloma architecture and cellular orientation.

Keywords: 3D cell culture; granuloma; spheroid; tuberculosis.


Figures

FIG 1
FIG 1
Visual differences in cellular organization between uninfected and BCG-infected granuloma structures can be observed after (a) 24 and (b) 48 h of magnetic levitation, with BCG-infected structures displaying less robust structural integrity (the magnetic levitation drive was removed briefly for these images to be taken). Differences in cellular organization could also be visualized using light microscopy, with uninfected innate granuloma structures at (c) lower (20×) and (d) higher (40×) magnifications and (e) BCG-infected innate granuloma structures displaying a clear lack of a lymphocytic cuff at the end of the culture period. Both the uninfected adaptive granuloma structures at (f) lower (20×) and (g) higher (40×) magnifications and (h) BCG-infected adaptive granuloma structures displayed the presence of a lymphocytic cuff (unlabeled, clear cells) surrounding the NanoShuttle-labeled AM core (darker cells) at the end of the culture period, during which time both magnetic levitation and magnetic bioprinting were used. These images were taken using an inverted light microscope. Light microscopy can also be used to investigate various staining methods. Using the H&E staining method, we corroborated our findings from the inverted microscope demonstrating (i) the alveolar macrophage core and (k) the CD3+ autologous T cell cuff. ZN staining of the sections demonstrated the uninfected nature of the structures, in both (j) the core and (l) the cuff, while ZN staining of infected sections demonstrated acid-fast bacilli both (m) in the core and (n) near the cuff of the structure.
FIG 2
FIG 2
Tile scan (14 by 14) of a 3D uninfected innate granuloma structure depicting (a) the entire structure, (b) the “cuff” devoid of autologous CD3+ T cells, and (c) the AM-dominant core. AM were stained with CD206 PE-CF594 (red). Nuclei were left unstained. A tile scan (18 by 18) of a 3D uninfected adaptive granuloma structure depicting (d) the entire structure, (e) the autologous CD3+ T cell-dominant cuff, and (f) the AM-dominant core. AM were stained with CD206 PE-CF594 (red), and autologous CD3+ T cells were stained with CD3 V450 (blue). Nuclei were left unstained. To confirm appropriate staining of the necrosis and hypoxic markers during optimization, confocal microscopy imaging was also performed on BAL cells (g) under basal culture conditions (untreated) and (h) under experimentally induced hypoxic conditions (treated) using traditional 2D culture methods, and BAL cells were stained with HMGB1 AF647 (red), HIF-1α AF488 (green), and Hoechst (nuclei). Single stains of (i) the HIF-1α and (j) the HMGB1 markers under chemically induced hypoxic conditions demonstrated unsuccessful capturing of HIF-1α nuclear translocation during hypoxia but successful capturing of cytoplasmic translocation of HMGB1 proteins, indicative of necrosis. Confocal microscopy imaging of (k) the entire 3D human TB granuloma section stained with HMGB1 (red) demonstrated the establishment of an oxygen gradient resulting in (l) an AM core of both necrotic and nonnecrotic cells and (m) a cuff of nonnecrotic cells.
FIG 3
FIG 3
From each granuloma structure from each participant, the viability of mechanically dissociated granuloma structure single cells could be determined using the (a) trypan blue exclusion method (pink, circular data points). (b) Viable cells could be counted using the trypan blue exclusion method, and using flow cytometry, the frequency of various immune cell phenotypes could be assessed after the 48-h adherence period to remove AM, including (c) CD3+ T cells, (d) CD3CD14+ myeloid cells, (e) CD3-CD16+ natural killer (NK) cells, and (f) CD3+ CD16+ NK T cells. Cell counts and viability data are representative of cellular integrity after the final 48-h incubation for adherence for both uninfected (n = 3) and infected (n = 3) granuloma structures, as well as uninfected (n = 1) and infected (n = 3) traditional cell cultures (monolayer). Each point represents a single data point; error bars are representative of the median and range. UAG, uninfected adaptive granuloma; IAG, infected adaptive granuloma; UAM, uninfected adaptive monolayer; IAM, infected adaptive traditional. Mann-Whitney t test results for comparisons between infection groups for each cellular phenotype are given in the table below the graphs. *, comparisons could not be made between the uninfected adaptive granuloma and uninfected adaptive monolayer groups and the uninfected adaptive monolayer and infected adaptive monolayer groups due to too few data points being available for the uninfected adaptive monolayer group.
FIG 4
FIG 4
Concentration (pg/ml) of the investigated cytokines released into the supernatant of the 3D granuloma structure and traditional cell culture control (monolayer) extracellular environments, as measured by Luminex analysis. The cytokines measured included (a) IL-10, (b) TNF-α, (c) IFN-γ, (d) IL-2, and (e) IL-22. Cytokine production was compared between initial production by uninfected and that by BCG-infected AM 2 days post culture initiation and subsequent release until the end of culture (5 days post culture initiation), as well as compared to the corresponding cytokine release by the BCG-infected chronic traditional cell culture control (monolayer) and autologous CD3+ T cells prior to addition to the AM culture. Each data point represents the median of three individual participants, with BCG infection occurring on day 1 after culture initiation (the day of culture initiation is considered day 0). The day 2 inset for each cytokine depicts the differences between cytokines released by uninfected and BCG-infected AM 2 days post culture initiation, i.e., 1 day postinfection (each data point represents a single individual from the three individual participants assessed).
FIG 5
FIG 5
BCG CFU were measured using the cell lysate of 3D spheroid granuloma structures and traditional cell culture control cultures (traditional cultures) and compared to the initial bacterial uptake of BCG into AM. Data were log-transformed prior to plotting.
FIG 6
FIG 6
RNA sequencing relative gene expression results displaying (a) a mean-difference (MD) plot of the differential gene expression between BCG-infected traditional control cultures and 3D spheroid granulomas (the distance between any two points is the leading log-fold change between those samples; the leading log2 fold change is the root mean square average of the largest log2 fold change between those samples), (b) a heatmap of the differential gene expression of BCG-infected cells in traditional culture (labeled “Control”) versus that of corresponding infected cells in 3D spheroid granulomas, (c) a heatmap of the differential gene expression in BCG-infected innate 3D spheroid granulomas versus that of uninfected innate 3D spheroid granulomas, and (d) a multidimensional scaling plot of all data points from a smoker (green) versus those from a nonsmoker (blue). Descriptions of each data point are given in the bottom right-hand table.
FIG 7
FIG 7
Our 3D in vitro TB granuloma structures show similar structural and cellular composition based on (a) immunofluorescence staining with antibodies for CD3+ T cells (blue, V450) and alveolar macrophages (red, PE-CF594) to (b) published in vivo TB lung granulomas of nonhuman primates, stained with antibodies for CD3+ T cells (red) and CD68+ macrophages (green), surrounding the necrotic center (unstained). Adapted from Flynn et al. 2015 with permission (license number: 4967651365284) (19).
FIG 8
FIG 8
A basic representation of the workflow used to generate and analyze 3D in vitro human TB granulomas generated from a single participant. Briefly, BAL fluid and peripheral blood are collected from the participant at the time of the bronchoscopy procedure, after which the BAL fluid is processed to collect the cell pellet while the fluid is stored for other studies. The BAL cells (BALC) are then used to construct the alveolar macrophage core of the 3D structure and the traditional cell culture control (monolayer) in both uninfected and infected scenarios. Collected peripheral blood is processed for PBMC and then further processed to isolate autologous CD3+ T cells using the MACS MicroBead cell separation technique, with the CD3 cellular fraction being stored for other studies. Autologous T cells are then added to the appropriate alveolar macrophage cores, those designated to become “adaptive” granuloma structures, after 48 h of the core’s levitation or 48 h of conventional culture in the case of the traditional cell culture control. Generated structures are then processed individually, in uninfected and infected pairs, for the respective downstream applications desired. These include embedding in tissue-freezing medium for subsequent cryosectioning and staining of the structures for immunofluorescence and confocal microscopy or staining for basic cellular structures like H&E staining or ZN staining for acid-fast bacterial detection (this is exclusively for the 3D structures and cannot be done for the traditional cell culture control cultures). Cells can also be stored for later RNA extractions and subsequent gene expression or RNA sequencing analyses. Supernatants can be stored for cytokine/chemokine production analyses using the Luminex immunoassay platform or similar platforms like ELISA, and cell lysates can be plated to determine CFU counts, thereby evaluating bacterial control.
FIG 9
FIG 9
3D innate and adaptive granuloma construction using the n3D Biosciences Inc. magnetic levitation and printing drives. (a) The development of the granuloma core is accomplished through the levitation of NanoShuttle-labeled alveolar macrophages for 48 h. (b) The magnetic levitation drive is removed after 48 h and immediately replaced by the magnetic printing drive below the 24-well culture plate, which ensures that the 3D structure remains intact. (c) Autologous CD3+ T cells, not labeled with NanoShuttle, are then carefully added to the alveolar macrophage core and allowed to migrate via chemotactic gradients to the core to create the mature, adaptive granuloma. (d) Innate granulomas do not have the autologous CD3+ T cells added to the core but are rather left with the printing drive secured below the culture plate for the remainder of the experiment.

References

    1. Cohen SB, Gern BH, Delahaye JL, Adams KN, Plumlee CR, Winkler JK, Sherman DR, Gerner MY, Urdahl KB. 2018. Alveolar macrophages provide an early Mycobacterium tuberculosis niche and initiate dissemination. Cell Host Microbe 24:439–446.e4. doi:10.1016/j.chom.2018.08.001. - DOI - PMC - PubMed
    1. Davis JM, Ramakrishnan L. 2009. The role of the granuloma in expansion and dissemination of early tuberculous infection. Cell 136:37–49. doi:10.1016/j.cell.2008.11.014. - DOI - PMC - PubMed
    1. Lin PL, Pawar S, Myers A, Pegu A, Fuhrman C, Reinhart TA, Capuano SV, Klein E, Flynn JL. 2006. Early events in Mycobacterium tuberculosis infection in cynomolgus macaques. Infect Immun 74:3790–3803. doi:10.1128/IAI.00064-06. - DOI - PMC - PubMed
    1. Wolf AJ, Linas B, Trevejo-Nuñez GJ, Kincaid E, Tamura T, Takatsu K, Ernst JD. 2007. Mycobacterium tuberculosis infects dendritic cells with high frequency and impairs their function in vivo. J Immunol 179:2509–2519. doi:10.4049/jimmunol.179.4.2509. - DOI - PubMed
    1. Ehlers S, Schaible UE. 2013. The granuloma in tuberculosis: dynamics of a host–pathogen collusion. Front Immunol 3:411. doi:10.3389/fimmu.2012.00411. - DOI - PMC - PubMed

Publication types

MeSH terms