. 2021 Jul;129(7):77003.
doi: 10.1289/EHP8608. Epub 2021 Jul 21.

Application of an in Vitro Assay to Identify Chemicals That Increase Estradiol and Progesterone Synthesis and Are Potential Breast Cancer Risk Factors

Affiliations

Application of an in Vitro Assay to Identify Chemicals That Increase Estradiol and Progesterone Synthesis and Are Potential Breast Cancer Risk Factors

Bethsaida Cardona et al. Environ Health Perspect. 2021 Jul.

Abstract

Background: Established breast cancer risk factors, such as hormone replacement therapy and reproductive history, are thought to act by increasing estrogen and progesterone (P4) activity.

Objective: We aimed to use in vitro screening data to identify chemicals that increase the synthesis of estradiol (E2) or P4 and evaluate potential risks.

Method: Using data from a high-throughput (HT) in vitro steroidogenesis assay developed for the U.S. Environmental Protection Agency (EPA) ToxCast program, we identified chemicals that increased estradiol (E2-up) or progesterone (P4-up) in human H295R adrenocortical carcinoma cells. We prioritized chemicals by their activity. We compiled in vivo studies and assessments about carcinogenicity and reproductive/developmental (repro/dev) toxicity. We identified exposure sources and predicted intakes from the U.S. EPA's ExpoCast.

Results: We found 296 chemicals increased E2 (182) or P4 (185), with 71 chemicals increasing both. In vivo data often showed effects consistent with this mechanism. Of the E2- and P4-up chemicals, about 30% were likely repro/dev toxicants or carcinogens, whereas only 5-13% were classified as unlikely. However, most of the chemicals had insufficient in vivo data to evaluate their effects. Of 45 chemicals associated with mammary gland effects, and also tested in the H294R assay, 29 increased E2 or P4, including the well-known mammary carcinogen 7,12-dimethylbenz(a)anthracene. E2- and P4-up chemicals include pesticides, consumer product ingredients, food additives, and drinking water contaminants.

Discussion: The U.S. EPA's in vitro screening data identified several hundred chemicals that should be considered as potential risk factors for breast cancer because they increased E2 or P4 synthesis. In vitro data is a helpful addition to current toxicity assessments, which are not sensitive to mammary gland effects. Relevant effects on the mammary gland are often not noticed or are dismissed, including for 2,4-dichlorophenol and cyfluthrin. Fifty-three active E2-up and 59 active P4-up chemicals that are in consumer products, food, pesticides, or drugs have not been evaluated for carcinogenic potential and are priorities for study and exposure reduction. https://doi.org/10.1289/EHP8608.


Figures

Figure 1 is flowchart titled H 295 R cell comprising the following steps: Step 1: Cholesterol is connected to Progestogens via C Y P 11 A 1. Step 2: Progestogens are connected to Corticosteroids and Androgens via two C Y P 21 A and C Y P 17 A, respectively. Step 3: Androgens are connected to Estrogens via two C Y P 19 A. In Progestogens, C Y P 11 A is connected to Pregnenolone, which is connected to progesterone via H S D 3 B, which is connected to 17 alpha hydroxy progesterone via C Y P 17 A, and Pregnenolone is connected to 17 alpha hydroxy Pregnenolone via C Y P 17 A, which is connected to 17 alpha hydroxy progesterone via C Y P 21 A. In Corticosteroids, one C Y P 21 A is connected to D O C, which is connected to Corticosterone, and the other C Y P 21 A is connected to Deoxycortisol, which is connected to Cortisol via C Y P 11 B. In Androgens, both C Y P 17 A are connected to D H E A and Androstenedione, respectively; the D H E A is connected to Androstenedione via H S D 3 B; and the Androstenedione is two way connected to testosterone via H S D 17 B. In Estrogens, one C Y P 19 A is connected to Estrone and the other is connected to Estradiol.
Figure 1.
The steroidogenic pathway in H295R cells. The H295R assay is a high-throughput in vitro assay in H295R human adrenocortical carcinoma cells. The levels of 13 steroid hormones (shown in gray boxes) were measured to evaluate perturbations throughout the steroidogenic pathway. Enzymes are italicized. Arrows indicate direction of hormone synthesis. Steroid hormones are further grouped together by hormone type. Note: DHEA, dehydroepiandrosterone; DOC, deoxycorticosterone.
Figures 2A and 2B each are a set of two graphs titled estradiol-up chemicals and progesterone-up chemicals plotting maximum estradiol fold change, ranging from 2 to 3 in unit increments and 0 to 80 in increments of 20 and maximum progesterone fold change, ranging from 0 to 12 in increments of 3 and 0 to 40 in increments of 10 (y-axis) across log of (lowest effective concentration in micro molar), ranging from 0 to 2 in unit increments and negative 2 to 1 in increments of 1 and negative 0.5 to 1.5 in increments of 0.5 and negative 1 to 1 in unit increments (x-axis) for efficacy or potency, namely, higher, intermediate, and lower, respectively.
Figure 2.
Chemicals that increased estradiol (A) or progesterone (B) with their corresponding log(LEC) and MFC values. The LEC and MFC were obtained from data by Haggard et al. (2018) and are plotted along the x- and y-axes, the LEC is logged. For both (A) and (B), the plot on the right shows the entire range of values for log(LEC) and MFC, whereas the insert on the left shows a subsection of the plot for added clarity to the chemical names. A chemical’s combined efficacy/potency classification can be identified by shape and/or color: chemicals labeled as higher are the top 25% of chemicals with highest potency and efficacy, chemicals labeled as intermediate are the middle 50%, and chemicals labeled as lower are the bottom 25%. Failed drug candidates were removed from the plots. Values used to generate the figure can be found in Excel Tables S1 and S2. Note: 2-HEA, 2 hydroxyethyl acrylate; 2,3-DNT, 2,3- dinitrotoluene; 2,4-DCP, 2,4-dichlorophenol; 2,4,6-TBP, 2,4,6-tribromophenol; 2,4,6-TCP, 2,4,6-trichlorophenol; 2,5-DCP, 2,5- dichlorophenol; 3,3′,5,5′-TBBPA, 3,3′,5,5′-tetrabromobisphenol A; 4-COT, 4-Chloro-2-methylaniline; BBPA, di(5-nonyl) adipate; BP-3, benzophenone-3; BPA, bisphenol A; DBNPA, 2,2-dibromo-3-nitrilopropionamide; DCDPA, 4-(2-phenylpropan-2-yl)-N-[4-(2-phenylpropan-2-yl)phenyl]aniline; DEHP, di (2-ethylhexyl) phthalate; DES, diethylstilbestrol; DMBA, 7,12-dimethylbenz(a)anthracene; EPN, epinephrine; HPTE, 2,2-Bis(4-hydroxyphenyl)-1,1,1-trichloroethane; LEC, lowest effective concentration; MCI, 5-Chloro-2-methyl-3(2H)-isothiazolone; MFC, maximal fold change (compared with dimethyl sulfoxide control); NDGA, nordihydroguaiaretic acid; PCP, Pentachlorophenol; TGSA, 4,4′-sulfonylbis[2-(prop-2-en-1-yl)phenol] (a p,p′-bisphenolic compound); TOCP, tri-o-cresyl phosphate; TPhP, triphenyl phosphate.
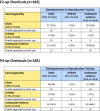
Figure 3 is a set of two tabular representations titled estradiol chemicals (lowercase n equals 182) and progesterone chemicals (lowercase n equals 185), in two main columns, listing Carcinogenicity and Developmental or Reproductive Toxicity. The column Developmental or Reproductive Toxicity for the tabular representation titled estradiol-up chemicals (lowercase n equals 182) is subdivided into three columns, namely, Likely (33 percent of total), Unlikely (6 percent of total) and Inadequate evidence (61 percent of total). The column Developmental or Reproductive Toxicity for the tabular representation titled progesterone-up chemicals (lowercase n equals 185) is subdivided into three columns, namely, Likely (33 percent of total), Unlikely (5% of total) and Inadequate evidence (63% of total). Data from the tabular representations are as follows: Row 1: Likely (30 percent of total), 21 (12 percent), 3 (2 percent), and 30 (16 percent), and Likely (28 percent of total), 16 (9 percent), 1 (1 percent), and 33 (18 percent); Row 2: number with expected current use, 18, 3, and 23, and number with expected current use, 15, 1, and 24; Row 3: Unlikely (13 percent of total), 17 (9 percent), 4 (2 percent), and 3 (2 percent), and Unlikely (11 percent of total), 17 (9 percent), 2 (1 percent), and 1 (1 percent); Row 4: number with expected current use, 15, 4, and 3, and number with expected current use, 14, 2, and 0; Row 5: Inadequate evidence (57 percent of total), 22 (12 percent), 4 (2 percent), and 78 (43 percent), and Inadequate evidence (62 percent of total), 28 (15 percent), 5 (3 percent), and 82 (44 percent); Row 6: number with expected current use, 13, 4, and 36, and number with expected current use, 13, 4, and 42, respectively.
Figure 3.
Number (and percentage) of chemicals (n=296) that increased estradiol or progesterone synthesis according to level of evidence for reproductive or developmental (repro/dev) toxicity or carcinogenicity; the number of chemicals with expected current uses is shown below each cell. Chemicals were classified as likely repro/dev toxicants if they had an effect level below 100mg/kg per day in a reproductive or developmental toxicity study in ToxValDb, were listed in the California Prop65 as developmental toxicants, or were identified by Rudel 2011 as mammary developmental toxicants. Chemicals were classified as unlikely repro/dev toxicants if they had a no effect level 100mg/kg per day in both a reproductive and developmental toxicity study in ToxValDb. Information for carcinogenicity was gathered from a variety of sources including ToxValDb, California Prop65 chemical listings, and the rodent mammary carcinogens list of Rudel et al. 2007. A classification of “likely” includes chemicals that are known, probable, or possible carcinogens or for which mammary tumors were reported; “unlikely” includes chemicals classified as having evidence of noncarcinogenicity in humans or unlikely to be carcinogenic; “inadequate evidence” includes chemicals not classifiable as to human carcinogenicity or inadequate data for evaluation, including no data available. A chemical was categorized as currently used if found in pesticide products approved for use by the U.S. EPA, pharmaceuticals approved for use by the FDA, or consumer products as found in CPDat, or if biomonitored in the CDC’s NHANES. Additional detail can be found in the “Methods” section and the specific chemicals in each cell can be identified using Excel Tables S1 and S2. Note: CDC, Centers for Disease Prevention and Control; CPDat, Chemical and Products Database; EPA, Environmental Protection Agency; FDA, U.S. Food and Drug Administration; NHANES, National Health and Nutrition Examination Survey; Prop65, Proposition 65 program; ToxValDb, Toxicity Value Database.
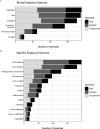
Figures 4A and 4B are stacked bar graphs titled Broad Exposure Sources and Specific Exposure Sources plotting, from bottom to top, No data, pharmaceuticals, consumer products, industrial, diet, and pesticides and cigarettes, human metabolite, flame retardant, hair dye, textile, antimicrobial, plastic, fragrance, food contact, personal care, drinking water contaminant, food residue, and food additive (y-axis) across number of chemicals, ranging from 0 to 150 in increments of 50 and from 0 to 90 in increments of 30 (x-axis) for both, estradiol, and progesterone, respectively.
Figure 4.
(A) Broad and (B) specific exposure sources for chemicals (N=296) that increased estradiol or progesterone synthesis. Exposure sources were gathered from CPDat or Ring et al. (2019) and assigned into five broad categories: consumer products, diet, industrial use, pesticide products, or pharmaceuticals (A). Within these five broad categories, we also identified exposure sources that are more specific and which may be of regulatory interest (B). See the “Methods” section for additional detail. Individual chemicals could be assigned into more than one of the broad or specific sources of exposure. Within each source we use texture to indicate the number of chemicals that increased estradiol, progesterone, or both. Information on which chemicals comprise the exposure sources is in Excel Tables S1 and S2. Note: CPDat, Chemical and Products Database.
Figure 5 is set of three graphs plotting Chemical name, namely, from bottom to top, 2-hydroxy-4-methoxybenzophenone, 2,6-Dinitrotulene, 4-Nitrophenol, Cycloate, Dicyclohexylamine, 3,4-Dicholoroaniline, 3,4-Dimethylphenol; 3,4-Dinitrotluene; 4-Chloro-2-methyllaniline, Acibenzolar-S-methyl, 2-Naphthalenol, 2,3-Dinitrotulene, Molinate, Bisphenol A, Methylparaben, 4-Methoxyaniline hydrochloride, 5,7-Dimethoxy-2H-chromen-2-one, Azobenzene, Propylparaben, 4-(2-Methylbutan-2-yl)phenol, 2-(3-Phenylpropyl)pyridine, 3, 3 prime Dimethoxybenzidine dihydrochloride, 3,3,5-Trimethylcyclohexyl salicylate, 3-Methyl-4-(methylthio)phenol, Resorcinol, Catechol, 1,3-Bis(4-aminophenoxy) benzene, 4-Chloro-3-methylphenol, Diphenylamine, 3,3 prime, 5, 5 prime-Tetrabromobisphenol A, 4-Butylphenol, 2-Hydroxyethyl acrylate, Hydroquinone, Methyl dihydrojasmonate, 2,4-Dimethylphenol, 4,4 prime-Sulfonylbis[2-(prop-2-en-1-yl)phenol], N,N-Dimethyldoctylamine, Acid Orange, Methyleugenol, 2-Methyl-5-nitroaniline, Di(2-ethylhexyl) phthalate, 4-(Butan-2-yl)phenol, 3-tert-Butylphenol, 2,5-Dichlorophenol, 2,4-Dichlorophenol, Diphenyl isophthalate, 2, 4, 6-Tribromophenol, 2-Methoxy-5-methyaniline, p-Cresol, Dimethyl isophthalate, 10-Undecenoic acid, Methyl 2,4-dihydroxy-3,6-dimethylbenzoate, Nitrilotriacetic acid, and 3-Isopropylphenol (y-axis) across median exposure rate (milligrams per kilogram body weight per day), ranging from 0.00 to 0.25 in increments of 0.05, 0.5 to 2.0 in increments of 0.5, and 5 to 55 in increments of 10 (x-axis) for efficacy or potency, namely, lower, intermediate, and higher and Hormone, namely, both, estradiol, and progesterone, respectively.
Figure 5.
Chemicals that increased estradiol and/or progesterone synthesis with median exposure rates (upper credible interval estimate) >0.01mg/kg BW/day. For chemicals that increased both estradiol and progesterone synthesis, the efficacy/potency assignment is that of the hormone activity with the higher efficacy/potency. Median exposure rates gathered from Ring et al. (2019). See the “Methods” section for additional detail. Data used to generate the graph can be found in Excel Tables S1 and S2, in the column titled “Predicted median intake rate (mg/kg BW/day).” Note: BW, body weight.

Comment in

References

    1. Abba MC, Zhong Y, Lee J, Kil H, Lu Y, Takata Y, et al. . 2016. DMBA induced mouse mammary tumors display high incidence of activating Pik3caH1047 and loss of function Pten mutations. Oncotarget 7(39):64289–64299, PMID: 27588403, 10.18632/oncotarget.11733. - DOI - PMC - PubMed
    1. Agarwal VR, Bulun SE, Leitch M, Rohrich R, Simpson ER. 1996. Use of alternative promoters to express the aromatase cytochrome P450 (CYP19) gene in breast adipose tissues of cancer-free and breast cancer patients. J Clin Endocrinol Metab 81(11):3843–3849, PMID: 8923826, 10.1210/jcem.81.11.8923826. - DOI - PubMed
    1. Aker AM, Ferguson KK, Rosario ZY, Mukherjee B, Alshawabkeh AN, Calafat AM, et al. . 2019. A repeated measures study of phenol, paraben and Triclocarban urinary biomarkers and circulating maternal hormones during gestation in the Puerto Rico PROTECT cohort. Environ Health 18(1):28, PMID: 30940137, 10.1186/s12940-019-0459-5. - DOI - PMC - PubMed
    1. Aker AM, Watkins DJ, Johns LE, Ferguson KK, Soldin OP, Anzalota Del Toro LV, et al. . 2016. Phenols and parabens in relation to reproductive and thyroid hormones in pregnant women. Environ Res 151:30–37, PMID: 27448730, 10.1016/j.envres.2016.07.002. - DOI - PMC - PubMed
    1. Albrektsen G, Heuch I, Hansen S, Kvåle G. 2005. Breast cancer risk by age at birth, time since birth and time intervals between births: exploring interaction effects. Br J Cancer 92(1):167–175, PMID: 15597097, 10.1038/sj.bjc.6602302. - DOI - PMC - PubMed

Publication types