

Expanding Molecular Coverage in Mass Spectrometry Imaging of Microbial Systems Using Metal-Assisted Laser Desorption/Ionization
- PMID: 34287059
- PMCID: PMC8552643
- DOI: 10.1128/Spectrum.00520-21
Expanding Molecular Coverage in Mass Spectrometry Imaging of Microbial Systems Using Metal-Assisted Laser Desorption/Ionization
Abstract
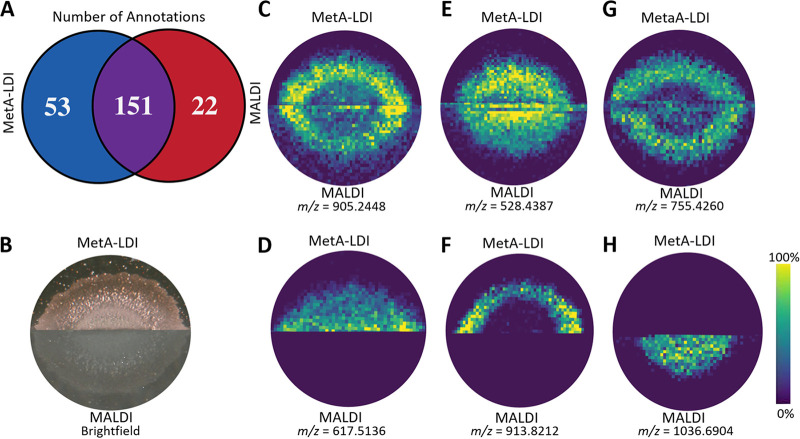
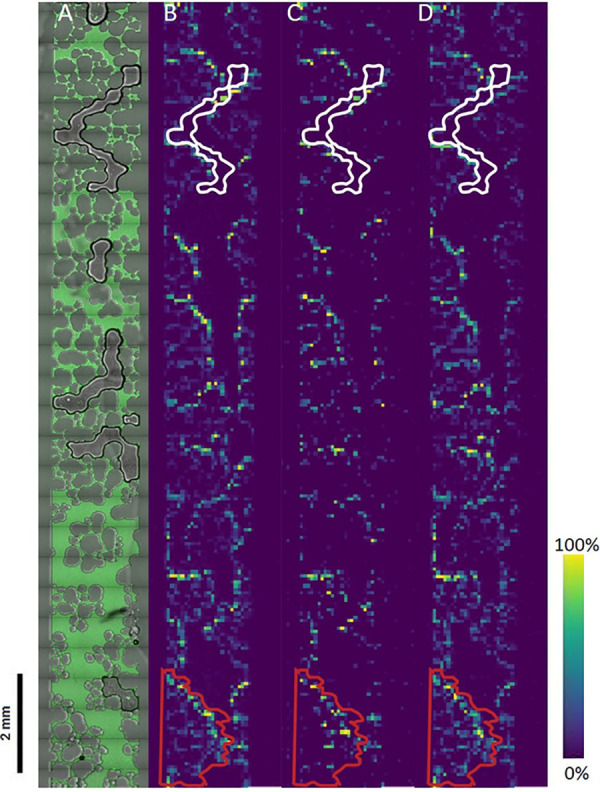
Mass spectrometry imaging (MSI) is becoming an increasingly popular analytical technique to investigate microbial systems. However, differences in the ionization efficiencies of distinct MSI methods lead to biases in terms of what types and classes of molecules can be detected. Here, we sought to increase the molecular coverage of microbial colonies by employing metal-assisted laser desorption/ionization (MetA-LDI) MSI, and we compared our results to more commonly utilized matrix-assisted laser desorption/ionization MALDI MSI. We found substantial (∼67%) overlap in the molecules detected in our analysis of Bacillus subtilis colony biofilms using both methods, but each ionization technique did lead to the identification of a unique subset of molecular species. MetA-LDI MSI tended to identify more small molecules and neutral lipids, whereas MALDI MSI more readily detected other lipids and surfactin species. Putative annotations were made using METASPACE, Metlin, and the BsubCyc database. These annotations were then confirmed from analyses of replicate bacterial colonies using liquid extraction surface analysis tandem mass spectrometry. Additionally, we analyzed B. subtilis biofilms in a polymer-based emulated soil micromodel using MetA-LDI MSI to better understand bacterial processes and metabolism in a native, soil-like environment. We were able to detect different molecular signatures within the micropore regions of the micromodel. We also show that MetA-LDI MSI can be used to analyze microbial biofilms from electrically insulating material. Overall, this study expands the molecular universe of microbial metabolism that can be visualized by MSI. IMPORTANCE Matrix-assisted laser desorption/ionization mass spectrometry imaging is becoming an important technique to investigate molecular processes within microbial colonies and microbiomes under different environmental conditions. However, this method is limited in terms of the types and classes of molecules that can be detected. In this study, we utilized metal-assisted laser desorption/ionization mass spectrometry imaging, which expanded the range of molecules that could be imaged from microbial samples. One advantage of this technique is that the addition of a metal helps facilitate ionization from electrically nonconductive substrates, which allows for the investigation of biofilms grown in polymer-based devices, like soil-emulating micromodels.
Keywords: Bacillus subtilis; MALDI; MetA-LDI; biofilms; microfluidics; soil microbiome.
Figures
Similar articles
-
Infrared MALDI Mass Spectrometry with Laser-Induced Postionization for Imaging of Bacterial Colonies.J Am Soc Mass Spectrom. 2021 Apr 7;32(4):1053-1064. doi: 10.1021/jasms.1c00020. Epub 2021 Mar 29. J Am Soc Mass Spectrom. 2021. PMID: 33780619
-
Mass spectrometry imaging of triglycerides in biological tissues by laser desorption ionization from silicon nanopost arrays.J Mass Spectrom. 2020 Apr;55(4):e4443. doi: 10.1002/jms.4443. Epub 2019 Dec 2. J Mass Spectrom. 2020. PMID: 31524963
-
Surface analysis of lipids by mass spectrometry: more than just imaging.Prog Lipid Res. 2013 Oct;52(4):329-53. doi: 10.1016/j.plipres.2013.04.005. Epub 2013 Apr 24. Prog Lipid Res. 2013. PMID: 23623802 Review.
-
Bacterial analysis by laser desorption ionization mass spectrometry on amorphous silicon.Biointerphases. 2016 Dec 22;11(4):041008. doi: 10.1116/1.4972416. Biointerphases. 2016. PMID: 28006919
-
Mass spectrometry imaging under ambient conditions.Mass Spectrom Rev. 2013 May-Jun;32(3):218-43. doi: 10.1002/mas.21360. Epub 2012 Sep 20. Mass Spectrom Rev. 2013. PMID: 22996621 Free PMC article. Review.
Cited by
-
Omics for deciphering oral microecology.Int J Oral Sci. 2024 Jan 9;16(1):2. doi: 10.1038/s41368-023-00264-x. Int J Oral Sci. 2024. PMID: 38195684 Free PMC article. Review.
-
Silver Nanoparticle Targets Fabricated Using Chemical Vapor Deposition Method for Differentiation of Bacteria Based on Lipidomic Profiles in Laser Desorption/Ionization Mass Spectrometry.Antibiotics (Basel). 2023 May 8;12(5):874. doi: 10.3390/antibiotics12050874. Antibiotics (Basel). 2023. PMID: 37237776 Free PMC article.
-
Metabolic insights from mass spectrometry imaging of biofilms: A perspective from model microorganisms.Methods. 2024 Apr;224:21-34. doi: 10.1016/j.ymeth.2024.01.014. Epub 2024 Jan 29. Methods. 2024. PMID: 38295894 Free PMC article. Review.
-
Molecular imaging of bacterial biofilms-a systematic review.Crit Rev Microbiol. 2024 Nov;50(6):971-992. doi: 10.1080/1040841X.2023.2223704. Epub 2023 Jul 15. Crit Rev Microbiol. 2024. PMID: 37452571 Free PMC article.
-
Mass spectrometry imaging of natural carbonyl products directly from agar-based microbial interactions using 4-APEBA derivatization.mSystems. 2024 Jan 23;9(1):e0080323. doi: 10.1128/msystems.00803-23. Epub 2023 Dec 8. mSystems. 2024. PMID: 38064548 Free PMC article.
References
-
- Yokoyama Y, Aoyagi S, Fujii M, Matsuo J, Fletcher JS, Lockyer NP, Vickerman JC, Passarelli MK, Havelund R, Seah MP. 2016. Peptide fragmentation and surface structural analysis by means of ToF-SIMS using large cluster ion sources. Anal Chem 88:3592–3597. doi:10.1021/acs.analchem.5b04133. - DOI - PubMed
-
- Angerer TB, Velickovic D, Nicora CD, Kyle JE, Graham DJ, Anderton C, Gamble LJ. 2019. Exploiting the semidestructive nature of gas cluster ion beam time-of-flight secondary ion mass spectrometry imaging for simultaneous localization and confident lipid annotations. Anal Chem 91:15073–15080. doi:10.1021/acs.analchem.9b03763. - DOI - PMC - PubMed
-
- Palmer A, Trede D, Alexandrov T. 2016. Where imaging mass spectrometry stands: here are the numbers. Metabolomics 12:107. doi:10.1007/s11306-016-1047-0. - DOI
Publication types
MeSH terms
Substances
LinkOut - more resources
Full Text Sources
Molecular Biology Databases
