. 2021 Aug 2;218(8):e20200938.
doi: 10.1084/jem.20200938. Epub 2021 Jul 21.

Reversal of emphysema by restoration of pulmonary endothelial cells

Affiliations

Reversal of emphysema by restoration of pulmonary endothelial cells

Shu Hisata et al. J Exp Med. .

Abstract

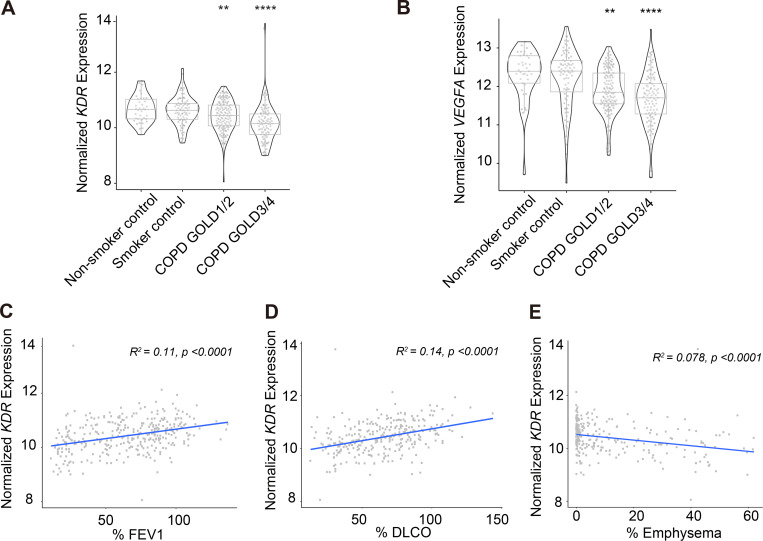
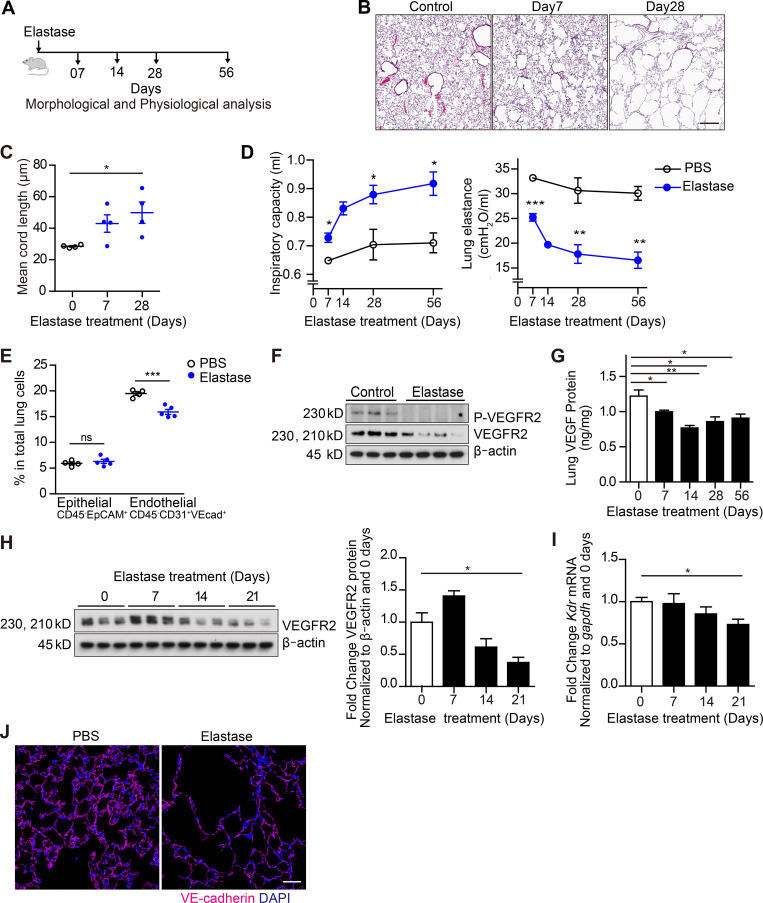
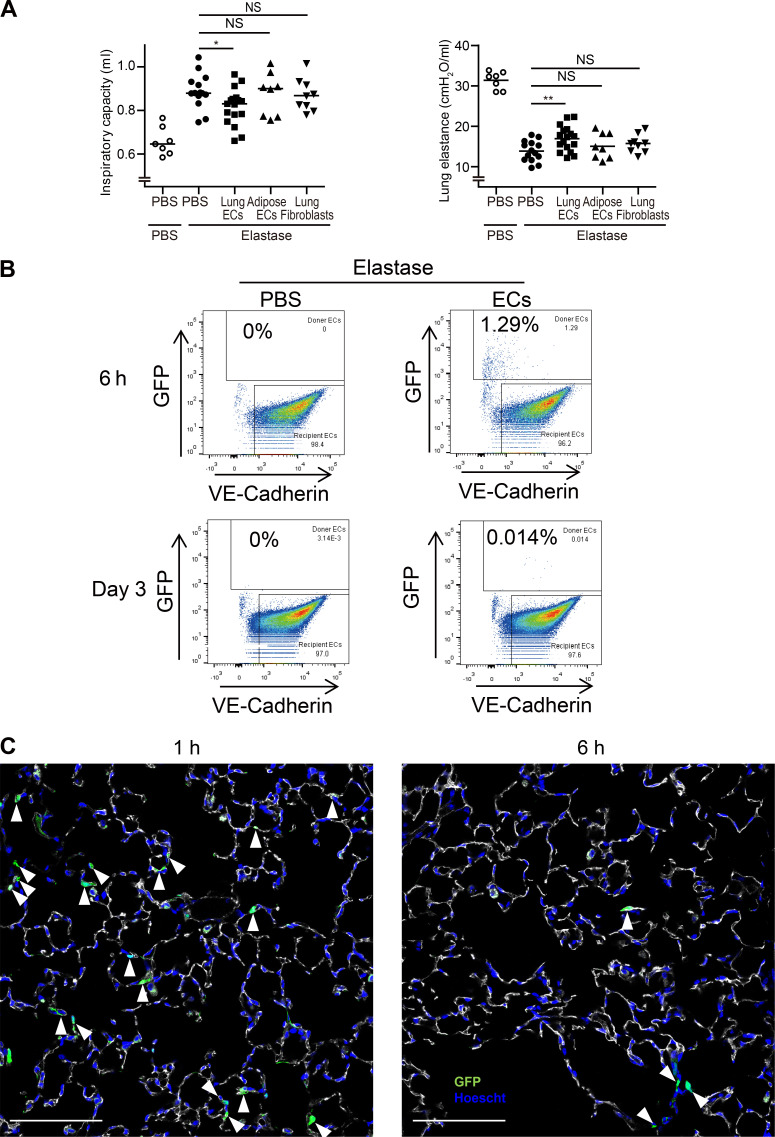
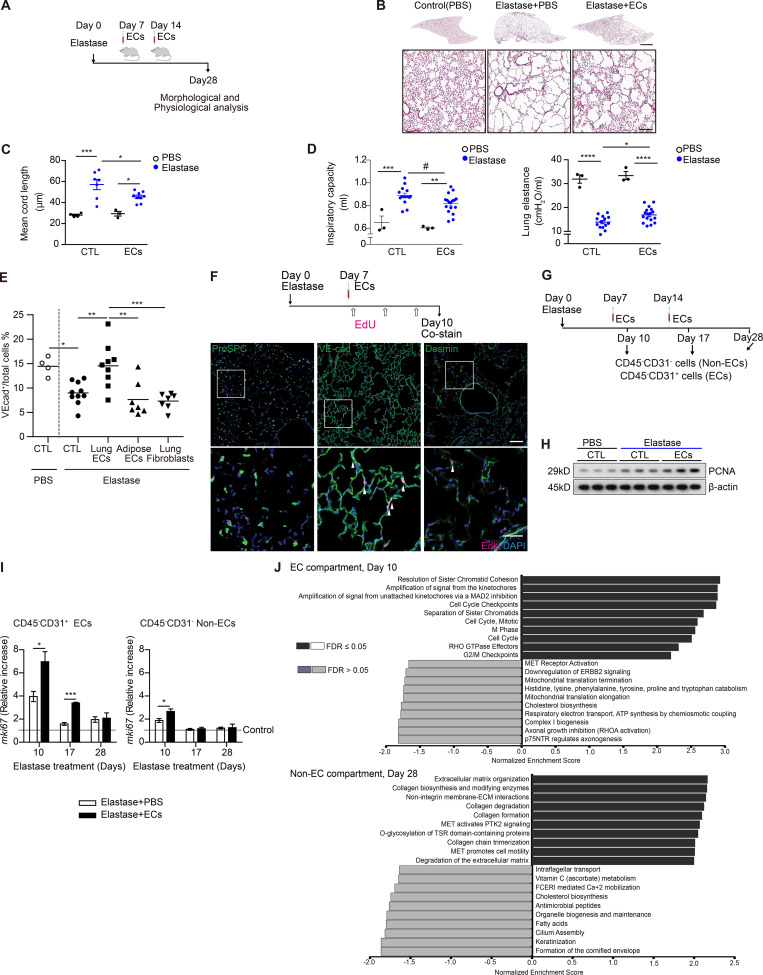
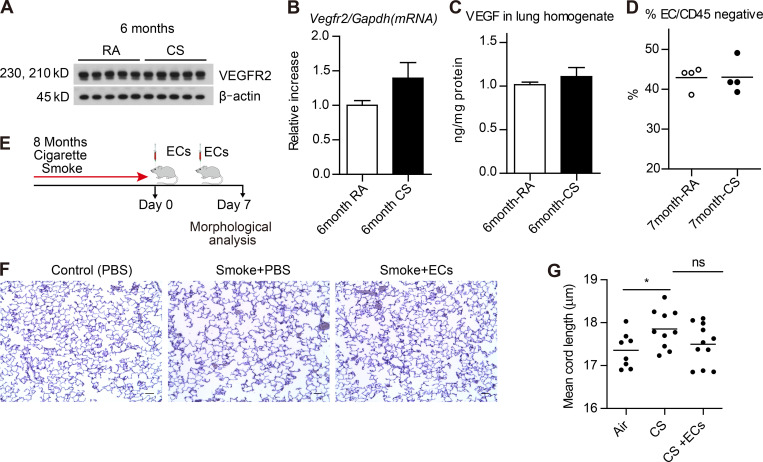
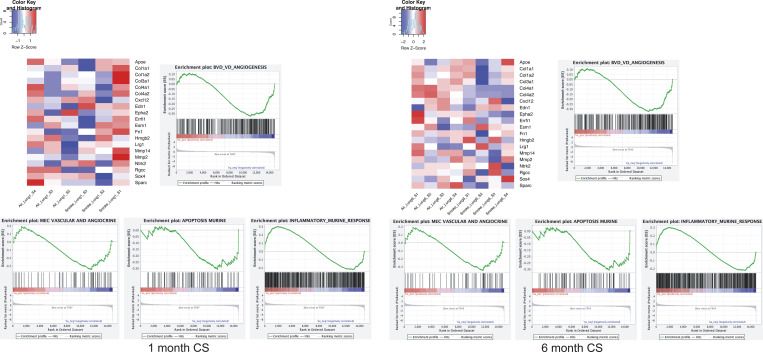
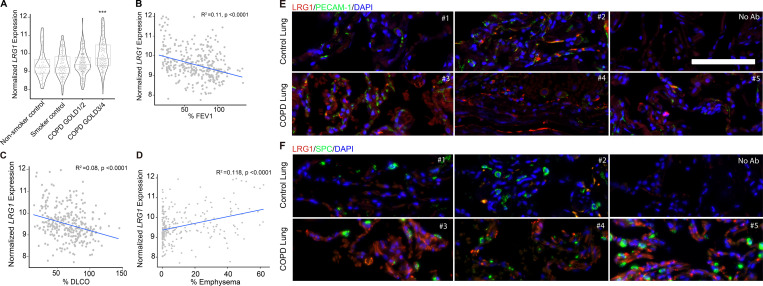
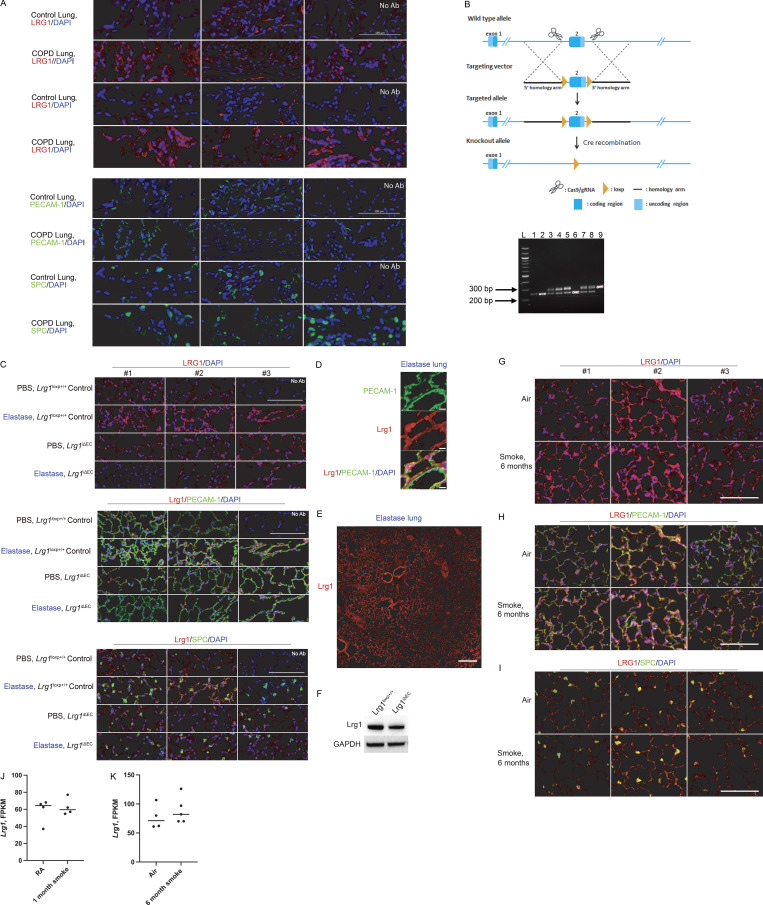
Chronic obstructive pulmonary disease (COPD) is marked by airway inflammation and airspace enlargement (emphysema) leading to airflow obstruction and eventual respiratory failure. Microvasculature dysfunction is associated with COPD/emphysema. However, it is not known if abnormal endothelium drives COPD/emphysema pathology and/or if correcting endothelial dysfunction has therapeutic potential. Here, we show the centrality of endothelial cells to the pathogenesis of COPD/emphysema in human tissue and using an elastase-induced murine model of emphysema. Airspace disease showed significant endothelial cell loss, and transcriptional profiling suggested an apoptotic, angiogenic, and inflammatory state. This alveolar destruction was rescued by intravenous delivery of healthy lung endothelial cells. Leucine-rich α-2-glycoprotein-1 (LRG1) was a driver of emphysema, and deletion of Lrg1 from endothelial cells rescued vascular rarefaction and alveolar regression. Hence, targeting endothelial cell biology through regenerative methods and/or inhibition of the LRG1 pathway may represent strategies of immense potential for the treatment of COPD/emphysema.


Conflict of interest statement

Disclosures: D.J. Nolan reported personal fees from Angiocrine Bioscience outside the submitted work; in addition, D.J. Nolan had a patent number 8,465,732 issued (Angiocrine Bioscience) and a patent number 9,944,897 issued; and is an employee and equity holder of Angiocrine Bioscience. M. Ginsberg reported personal fees from Angiocrine Bioscience outside the submitted work; in addition, M. Ginsberg had a patent to 8,465,732 issued and a patent to 9,944,897 issued. In addition, M. Ginsberg is a current employee and equity holder of Angiocrine Bioscience. F.J. Martinez reported non-financial support from ProterrixBio, Nitto, Zambon; "other" from Afferent/Merck, Biogen, Veracyte, Prometic, Bridge Biotherapeutics, and Abbvie; grants from Gilead; and personal fees from AstraZeneca, Boehringer Ingelheim, GlaxoSmithKline, Chiesi, Sunovion, Patara/Respivant, Bayer, Promedior/Roche, Teva, Col Behring, DevPro, IQVIA, Sanofi/Regeneron, United Therapeutics, and Novartis outside the submitted work. S.M. Cloonan reported grants from National Institute of Health, National Heart, Blood and Lung Institute (NHLBI), and Science Foundation Ireland (SFI), and personal fees from Pharmacosmos outside the submitted work; in addition, S.M. Cloonan had a patent number 10,905,682 issued. S. Rafii reported non-financial support from Angiocrine Bioscience during the conduct of the study; non-financial support from Angiocrine Bioscience outside the submitted work; and had a patent to E4ORF1 Endothelial cell infusion for organ repair licensed (Angiocrine Bioscience). A.M.K. Choi is a cofounder and equity stock holder for Proterris, which develops therapeutic uses for carbon monoxide. A.M.K. Choi has a use patent on CO. Additionally, A.M.K. Choi has a patent in COPD. No other disclosures were reported.

Figures

Figure 1.
Figure 1.
Loss of expression of key endothelial cell marks is a hallmark of COPD in human lung tissue and correlates with disease severity.(A and B) In silico analyses of microarray and RNA-seq datasets from the LGRC of VEGFR2/KDR (A) and VEGFA expression (B) in nonsmoker control, smoker control, COPD GOLD1/2 (mild), and COPD GOLD3/4 (severe) lungs. (C and D) Correlation between the expression of VEGFR2/KDR and physiological parameters % FEV1 (C) and % DLCO (D). (E) Correlation between VEGFR2/KDR expression and severity of emphysema determined by chest computed tomography (% emphysema). **, P < 0.01; ****, P < 0.0001.
Figure S1.
Figure S1.
The expression of key epithelial marks is maintained in human COPD lung tissue. In silico analysis from LGRC of expression of CDH1, AQP5, SFTPD, and SFTPC mRNA expression in nonsmoker control, smoker control, COPD GOLD1/2, and COPD GOLD3/4 lungs. Data are presented as median (line) ± SD (box). Generalized linear model Wald statistics were used to assess significance of coefficients in relevant models.
Figure 2.
Figure 2.
Dysfunctional lung vasculature in the murine elastase-induced emphysema model. (A) Schematic of the experimental design for results in B–D and G. (B) Representative hematoxylin and eosin staining of lung sections 7 and 28 d after elastase instillation and 28 d after PBS instillation (control). Scale bar, 300 µm. (C) Mean cord length quantification 7 and 28 d after elastase instillation and 28 d after PBS instillation (control; n = 4 per group). (D) Inspiratory capacity (left) and lung elastase (right) quantification 7, 14, 28, and 56 d after PBS or elastase instillation. n = 3 (PBS), n = 4 (elastase) per time point. (E) Proportion of EpCAM+ epithelial cells (CD45CD31VEcadherinEpCAM+) and ECs (CD45CD31+VEcadherin+) in total lung 14 d after PBS or elastase instillation (n = 5 per group) measured by FACS. (F) Total levels of phospho (P)-VEGFR2 and VEGFR2 (immunoblot) in whole lung lysates 28 d after elastase instillation. (G) Total VEGF levels in whole lung measured by ELISA (n = 4). (H) Total VEGFR2 levels in purified lung ECs. Lung ECs (CD45CD31+) were purified using magnetic sorting (n = 3; left). Quantification of VEGFR2/β-actin (right) in purified lung ECs. (I) Loss of Kdr expression in purified lung ECs (right) measured by RT-qPCR (n = 3). (J) Representative immunofluorescent images of frozen lung sections stained for VE-cadherin (intravital labeling, magenta) and DAPI (blue) 21 d after elastase instillation. Scale bar, 50 µm. Data in C–E and G–I are represented as mean ± SEM. P values were determined by an unpaired Student’s t test (*, P < 0.05; **, P < 0.01; ***, P < 0.001 compared with PBS). In F and H, the experiments were independently repeated at least two times with similar results. VEcad+, VE-cadherin+.
Figure S2.
Figure S2.
Example of flow gating strategy for ECs (CD31+VEcadherin+ cells) and epithelial cells (EpCAM+).(A) 14 d after elastase instillation, ECs were intravitally labeled with anti–VEcadherin–Alexa Fluor 647. Then, lungs were enzymatically digested and quantified with FACS. ECs are defined as CD45CD31+VEcadherin+ cells, whereas epithelial cells are defined as CD45CD31VEcadherinEpCAM+ cells. Transcriptome analysis of lung ECs following elastase instillation. (B) Heatmaps of top 10 up-regulated and down-regulated genes for elastase-treated lungs at days 7, 14, and 21. (C) GSEA using vascular and angiocrine gene set (upper panel), as well as blood vessel development and angiogenesis (lower panel). Enrichment plot for vascular and angiogenesis (upper) and blood vessel development (lower). DN, down; Neg., negative; SSC-A, side scatter A.
Figure 3.
Figure 3.
Transcriptome profiling of lung ECs identifies a state with loss of prototypical endothelial marks and enhanced features of angiogenesis. (A) Schematic of murine EC isolation with FACS-assisted sorting at 7, 14, and 21 d after elastase treatment. Anti-VEcadherin–Alexa Fluor 647 was retro-orbitally injected. 8 min after injection, mice were sacrificed, and the lungs were enzymatically digested. ECs were isolated as CD45 CD31+VEcadherin+ cells and sorted directly into TRIzol. Total RNA was isolated, and paired-end RNA-seq was performed. (B) Volcano plots illustrating differentially expressed genes (FDR < 0.05, fold change [FC] > 1.5) in ECs following elastase treatment at days 7, 14, and 21 compared with control (PBS). Red and blue genes represent significantly up-regulated and down-regulated genes, respectively. Black lines indicate threshold cutoffs for FDR and FC. (C) Gene ontology analysis of differentially expressed genes in ECs treated with elastase compared with control at different time points using biological process pathways (BP5). Top 15 pathways with FDR < 0.05 are illustrated. Bar graphs (in gray) represent number of genes occurring within the indicated biological pathway. Red line indicates −log10 (P value) of the hypergeometric distribution test used in our analyses. Pathways are listed in order of significance (top to bottom). (D) Heatmaps of top 20 variant genes within the biological pathway “blood vessel development and angiogenesis” identified from ECs following treatment with elastase at days 7, 14, and 21 compared with control. Red and blue genes represent significantly up-regulated and down-regulated genes, respectively. Reg, regulation; SSC-A, side scatter A; VEcad, VEcadherin.
Figure S3.
Figure S3.
Intravenous delivery of lung-specific ECs is required to recover physiological pulmonary function following elastase treatment.(A) Inspiratory capacity and lung elastance quantification at day 28 after elastase instillation. PBS or 0.5 × 10⁶ of cells described (see below) was delivered at days 7 and 14 after elastase instillation. PBS (n = 14), Lung ECsE4ORF1 (n = 17), adipose ECsE4ORF1 (n = 8), and lung fibroblasts (n = 9) were delivered at stated time points. Data are from two independent experiments. Data are presented as mean. P values were determined by unpaired Student’s t test (*, P < 0.05; **, P < 0.01; NS, not significant compared with PBS). (B) 1 × 10⁶ of GFP tagged ECs was injected through the retro-orbital cavity into elastase-treated mice. Following intravital labeling with anti–VEcadherin-Alexa647, total lungs were harvested and digested as previously described. FACS analysis was performed to identify the percentage of GFP-positive/VE-cadherin+ cells (Donor cells) in the total lung EC population. Percentages were quantified at 6 h and 3 d after injection. Recipient cells represent the endogenous lung ECs. (C) Representative immunofluorescent images of GFP (green) in frozen lung sections stained for VE-cadherin (white) and DAPI (blue). 1 × 10⁶ of GFP-tagged lung ECsE4ORF1 was injected from the retro-orbital cavity into elastase-treated mice. 1 and 6 h after ECs implantation, mice were sacrificed after intravital labeling with anti–VE-cadherin. Arrowheads show GFP-positive cells, indicating that implanted GFP-tagged lung ECsE4ORF1 home to endothelium. Scale bars, 100 µm.
Figure 4.
Figure 4.
Intravenous delivery of lung ECsE4ORF1 ameliorates the development of emphysema following elastase treatment. (A) Schematic of experiments presented in B–E. Intravenous delivery of lung ECsE4ORF1 (ECs) occurred at days 7 and 14 after elastase treatment. (B) Representative images of lung sections at 28 d after elastase instillation with (Elastase + ECs) or without (Elastase + PBS) injections of lung ECsE4ORF1 at days 7 and 14. Scale bars, 2 mm (upper panel), 300 µm (lower panel). (C) Mean cord length quantification of lungs isolated from mice 28 d after elastase instillation with (ECs) or without (CTL) injections of lung ECsE4ORF1. PBS (n = 4 [CTL], n = 3 [ECs]) and elastase (n = 7 [CTL], n = 9 [ECs]). (D) Inspiratory capacity (left) and lung elastance (right) quantification 28 d after elastase instillation with (EC) or without (CTL) lung ECE4ORF1 delivery. PBS (n = 3 [CTL], n = 3 [ECs]) and elastase (n = 14 [CTL], n = 17 [ECs]). Data are from two independent experiments. (E) Proportion of ECs (VE-cadherin+) in total lung cells 28 d after elastase instillation, followed by treatment with PBS (CTL, n = 10), lung ECsE4ORF1 (n = 9), adipose ECsE4ORF1 (n = 7), and lung fibroblasts (n = 7) at day 7 and day 14. ECs (VE-cadherin+) were intravitally labeled with anti–VE-cadherin (VEcad)–Alexa Fluor 647, and the proportion of VE-cadherin–positive cells was quantified with FACS. Represented are biologically independent samples. (F) Schematic of EdU labeling experiments (upper panel). Representative immunofluorescent images of frozen lung sections stained for ProSPC, VE-cadherin, Desmin (green), EdU (magenta), and DAPI (blue). Scale bar, 100 µm (upper panel), 40 µm (lower panel). Arrowheads indicate EdU-positive cells. (G–I) Isolation of EC (CD45CD31+) and Non-EC (CD45CD31) cellular fractions was performed using magnetic sorting. Schematic of the experiment (G). Representative immunoblots of PCNA levels in purified lung ECs 10, 17, and 28 d after elastase treatment with (ECs) or without (CTL) lung ECE4ORF1 injection (n = 3 per group; H). mRNA expression level of mKi67 in cellular fractions 10 d after elastase treatment with (ECs) or without (CTL) lung ECE4ORF1 injection (n = 3 per group). Relative increase compared with control (PBS, dotted line; I). (J) GSEA of bulk RNA-seq obtained from the lung endothelial and non–EC compartments of elastase mice with EC infusion compared with control samples at day 10 (EC compartment) and day 28 (non-EC compartment). Gene ontology and Reactome databases were used to perform unsupervised analyses using log fold change values. Data in C, D, and I are presented as mean ± SEM. P values were determined by one-way ANOVA in C–E or by unpaired Student’s t test in I (*, P < 0.05; **, P < 0.01; ***, P < 0.001; ****, P < 0.0001; #, not significant in one-way ANOVA; P = 0.0222 in unpaired Student’s t test). In F and H, the experiments were independently repeated at least two times with similar results. GTPase, guanosine triphosphatase.
Figure 5.
Figure 5.
CS exposure does not alter murine lung ECE4ORF1 populations but EC transplant may reverse murine smoke-induced emphysema.(A–C) VEGFR2 protein by immunoblotting and ELISA (A and C) and mRNA (B) levels in whole lung tissue homogenates of mice exposed to RA or CS for 6 mo (n = 5 per group). (D) Proportion of ECs (CD45CD31+VEcadherin+) in CD45 lung cells of mice exposed to RA or CS for 7 mo (n = 4 per group). (E) Schematic of the timeline of lung ECE4ORF1 (ECs) transplantation in mice exposed to CS. (F and G) Modified Gill’s immunohistochemical stain (F) and mean cord length of inflated whole lung sections from mice exposed to 8 mo of whole-body CS followed by EC transplant (500,000 ECs injected retro-orbitally) 0 and 3 d after smoking cessation (8 mo RA, n = 8; 8 mo smoke alone, n = 10; 8 mo smoke with EC transplant, n = 11). Scale bars, 100 µm. All data are mean ± SEM. *, P < 0.05 by unpaired t test.
Figure S4.
Figure S4.
GSEA of RNA-seq profiles in purified lung ECs isolated from 1-mo– and 6-mo–CS-exposed mice. Analyses were performed using log fold change for gene sets of blood vessel development, EC and angiocine markers, apoptosis, and inflammation. Heatmaps for blood vessel development and angiogenesis gene set are shown. Enrichment score and P value are displayed.
Figure 6.
Figure 6.
LRG1 levels are up-regulated in human COPD tissue and directly correlate with severity of disease and lung function decline. (A) In silico analysis from LGRC of expression of LRG1 mRNA in nonsmoker control, smoker control, COPD GOLD1/2, and COPD GOLD3/4 lungs. Data are presented as mean ± SD. Generalized linear model Wald statistics were used to assess significance of coefficients in relevant models (***, P < 0.001). (B–D) Correlation between the expression of LRG1 and DLCO, FEV1, and severity of emphysema observed on chest computed tomography. Generalized linear model Wald statistics were used to assess the significance of coefficients in relevant models. (E and F) Representative immunofluorescent staining images of formalin-fixed, paraffin-embedded human COPD lung tissue obtained from LTRC (as described in Materials and methods). Individual control and COPD patient samples were stained for total levels of LRG1 (red), PECAM-1 (top panel, green), DAPI (blue), and SPC (bottom panel, green). Scale bar, 100 µm.
Figure S5.
Figure S5.
LRG1, PECAM-1, SPC, and DAPI staining in control and COPD human lungs. (A) Top: LRG1 and DAPI staining in control and COPD tissue used in bottom panel. Bottom: PECAM-1 or SPC, and DAPI in control and COPD tissue. No Ab panel represents tissue sample without primary antibody staining. Scale bar is 100 µm. (B) Generation of EC-specific Lrg1 knockout mouse line. Lrg1loxP/+ mice were obtained from Nanjing University. Top: Schematic of the strategy used to generate Lrg1loxP/+ mice using CRISPR Cas9 technology. Bottom: Genotyping of littermates generated from Lrg1loxP/+ × Lrg1loxP/+ breeding. Lanes 1, 2, and 6 represent wild-type mice with PCR product at 255 bp. Lanes 3–5, 7, and 8 represent heterozygous mice with product at 255 bp (wt) and product at 289 bp (following insertion of LoxP site). Lane 9 represents a homozygous condition, where LoxP sites were inserted at both alleles (single 289-bp PCR product). (C) Representative images of immunofluorescence staining with LRG-1 (red), PECAM-1 or SPC (green), and DAPI (blue) in control and elastase-treated lung obtained from control mice and Lrg1iΔEC. Scale bars, 100 µm. (D) Representative images of immunofluorescence staining highlighting colocalization of LRG1 and PECAM-1. Scale bars, 10 µm. (E) Representative images of immunofluorescence staining of Lrg1 in whole lung following elastase. Scale bar, 200 µm. (F) Lrg1 levels in MACS-isolated ECs obtained from control mice and Lrg1iΔEC. (G–I) Immunofluorescence staining with LRG-1 (red), PECAM-1 or SPC (green), and DAPI (blue) in mouse lung following 6 mo of CS or air exposure. Scale bars, 200 μm. (J and K) FPKM values of transcript level of Lrg-1 levels following 1 mo (J) and 6 mo (K) of smoke. gRNA, guide RNA; MACS, magnetic-activated cell sorting.
Figure 7.
Figure 7.
Loss of EC LRG1 blocks the development of emphysema in the murine elastase model. (A) Schematic of generation of mouse line with EC-specific loss of Lrg1 expression. Transgenic mice in which VE-cadherin promoter drives expression of tamoxifen-responsive CreERT2 (VE-Cad–CreERT2 mice) were crossed with Lrg1loxP/loxP mice and treated with tamoxifen to induce EC-specific deletion of LRG1. (B) Representative immunofluorescent images of lung sections stained for LRG1 (red), DAPI (blue), SPC (green, middle panel), and PECAM-1 (green, right panel). Scale bar, 100 µm. (C) Representative images of lung sections at 28 d after elastase instillation in conditions where EC expression of Lrg1 is either intact (Lrg1loxp+/+) or lost (Lrg1iΔEC). Scale bars, 4 mm (upper panel), 300 µm (lower panel). (D) Mean cord length quantification 28 d after elastase instillation in conditions where EC expression of Lrg1 is either intact (Lrg1loxp+/+) or lost (Lrg1iΔEC). PBS (n = 8 [Lrg1loxp+/+], n = 8 [Lrg1iΔEC]) and elastase (n = 25 [Lrg1loxp+/+], n = 25 [Lrg1iΔEC]). Combined data are from at least three independent experiments. **, P < 0.01; ****, P < 0.0001. VE-Cad, VE-cadherin.

References

    1. Andersen, J.D., Boylan K.L., Jemmerson R., Geller M.A., Misemer B., Harrington K.M., Weivoda S., Witthuhn B.A., Argenta P., Vogel R.I., and Skubitz A.P.. 2010. Leucine-rich alpha-2-glycoprotein-1 is upregulated in sera and tumors of ovarian cancer patients. J. Ovarian Res. 3:21. 10.1186/1757-2215-3-21 - DOI - PMC - PubMed
    1. Augustin, H.G., and Koh G.Y.. 2017. Organotypic vasculature: From descriptive heterogeneity to functional pathophysiology. Science. 357:eaal2379. 10.1126/science.aal2379 - DOI - PubMed
    1. Barr, R.G., Mesia-Vela S., Austin J.H., Basner R.C., Keller B.M., Reeves A.P., Shimbo D., and Stevenson L.. 2007. Impaired flow-mediated dilation is associated with low pulmonary function and emphysema in ex-smokers: the Emphysema and Cancer Action Project (EMCAP) Study. Am. J. Respir. Crit. Care Med. 176:1200–1207. 10.1164/rccm.200707-980OC - DOI - PMC - PubMed
    1. Butler, J.M., Nolan D.J., Vertes E.L., Varnum-Finney B., Kobayashi H., Hooper A.T., Seandel M., Shido K., White I.A., Kobayashi M., et al. . 2010. Endothelial cells are essential for the self-renewal and repopulation of Notch-dependent hematopoietic stem cells. Cell Stem Cell. 6:251–264. 10.1016/j.stem.2010.02.001 - DOI - PMC - PubMed
    1. Canning, B.J., and Wright J.L.. 2008. Animal models of asthma and chronic obstructive pulmonary disease. Pulm. Pharmacol. Ther. 21:695. 10.1016/j.pupt.2008.04.007 - DOI - PubMed

Publication types

MeSH terms