. 2021 Dec;86(6):3067-3081.
doi: 10.1002/mrm.28925. Epub 2021 Jul 20.

Application of an integrated radio-frequency/shim coil technology for signal recovery in fMRI

Affiliations

Application of an integrated radio-frequency/shim coil technology for signal recovery in fMRI

Devin Willey et al. Magn Reson Med. 2021 Dec.

Abstract

Purpose: Gradient-echo echo-planar imaging (EPI), which is typically used for blood oxygenation level-dependent (BOLD) functional MRI (fMRI), suffers from distortions and signal loss caused by localized B0 inhomogeneities. Such artifacts cannot be effectively corrected for with the low-order spherical harmonic (SH) shim coils available on most scanners. The integrated parallel reception, excitation, and shimming (iPRES) coil technology allows radiofrequency (RF) and direct currents to flow on each coil element, enabling imaging and localized B0 shimming with one coil array. iPRES was previously used to correct for distortions in spin-echo EPI and is further developed here to also recover signal loss in gradient-echo EPI.

Methods: The cost function in the shim optimization, which typically uses a single term representing the B0 inhomogeneity, was modified to include a second term representing the signal loss, with an adjustable weight to optimize the trade-off between distortion correction and signal recovery. Simulations and experiments were performed to investigate the shimming performance.

Results: Slice-optimized shimming with iPRES and the proposed cost function substantially reduced the signal loss in the inferior frontal and temporal brain regions compared to shimming with iPRES and the original cost function or 2nd -order SH shimming with either cost function. In breath-holding fMRI experiments, the ΔB0 and signal loss root-mean-square errors decreased by -34.3% and -56.2%, whereas the EPI signal intensity and number of activated voxels increased by 60.3% and 174.0% in the inferior frontal brain region.

Conclusion: iPRES can recover signal loss in gradient-echo EPI, which is expected to improve BOLD fMRI studies in brain regions suffering from signal loss.

Keywords: B0 shimming; BOLD fMRI; gradient-echo EPI; human brain; iPRES; signal recovery.


Figures

Fig. 1.
Fig. 1.
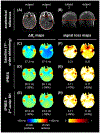
Experimental ΔB0 (or voxel shift) maps (A–C), signal loss (Eq. [4]) maps (D–F), and gradient-echo EPI images (G–I) through the inferior frontal brain region of subject 1, before and after slice-optimized shimming with iPRES and different cost functions and weights for a 2.5-mm isotropic voxel size at 3T. Shimming with the cost function C1 or C3 was performed in a slab of three slices or a single slice, respectively. A weight of 0 is equivalent to the original cost function C1. The ΔB0 RMSE (Eq. [1]) and signal loss RMSE (Eq. [3]) in the brain mask of this slice (red outline) and their changes relative to the baseline are listed in white below each map. The ΔB0 and signal loss RMSEs and the average EPI signal intensity in the inferior frontal brain region (pink circle) and their changes relative to the baseline are listed in pink above each map or image. The ΔB0 maps also represent voxel shift maps when scaled by the EPI readout duration.
Fig. 2.
Fig. 2.
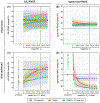
Simulated ΔB0 RMSE (Eq. [1]; A,C) and signal loss RMSE (Eq. [3]; B,D) changes relative to the baseline (1st-order shimming) after shimming with different methods for a 2.5-mm isotropic voxel size at 3T. Slice-optimized shimming with the cost function C1 or C3 was performed in a slab of three slices or a single slice, respectively. A weight of 0 is equivalent to the original cost function C1. The RMSEs are calculated in the brain mask of each slice (red outline in Figs. 3–4 and Supporting Information Figs. S2–S3). The symbols and shaded regions (or error bars) represent the average and standard deviation, respectively, calculated over 3 slices through the inferior frontal brain region of each of the 7 subjects (i.e., 21 different slices, including those shown in Figs. 3–4 and Supporting Information Figs. S2–S3). The weight can be adjusted to achieve an optimal trade-off between a reduction in ΔB0 RMSE and a reduction in signal loss RMSE (Eq. [6]). The optimal weight of 1.75e-5 is indicated by the black vertical line.
Fig. 3.
Fig. 3.
ΔB0 (or voxel shift) maps through the inferior frontal brain region of two representative subjects, before (A, experimental) and after (D–O, simulated) shimming with different methods for a 2.5-mm isotropic voxel size at 3T. Slice-optimized shimming with the cost function C1 or C3 was performed in a slab of three slices or a single slice, respectively. Anatomical images with the brain mask (B, red outline) and sagittal localizers with the slice position (C, red line) are included for anatomical reference. For the cost function C3, an optimal weight of 1.75e-5 was used. The ΔB0 RMSE (Eq. [1]) in the brain mask of each slice and its change relative to the baseline are listed below each map. Results for all subjects are shown in Supporting Information Figure S2.
Fig. 4.
Fig. 4.
Signal loss (Eq. [4]) maps in the same slices as those shown in Figure 3, before (A, experimental) and after (D–O, simulated) shimming with different methods for a 2.5-mm isotropic voxel size at 3T. Slice-optimized shimming with the cost function C1 or C3 was performed in a slab of three slices or a single slice, respectively. Anatomical images with the brain mask (B, red outline) and sagittal localizers with the slice position (C, red line) are included for anatomical reference. For the cost function C3, an optimal weight of 1.75e-5 was used. The signal loss RMSE (Eq. [3]) in the brain mask of each slice and its change relative to the baseline are listed below each map. Results for all subjects are shown in Supporting Information Figure S3.
Fig. 5.
Fig. 5.
Simulated ΔB0 RMSE (Eq. [1]; A) and signal loss RMSE (Eq. [3]; B) changes relative to the baseline (1st-order shimming) after shimming with different methods for a 2.5-mm isotopic voxel size at 3T. Slice-optimized shimming with the cost function C1 or C3 was performed in a slab of three slices or a single slice, respectively. The RMSEs are calculated in the brain mask of each slice (red outline in Figs. 3–4 and Supporting Information Figs. S2–S3). The colored bars and error bars represent the average and standard deviation, respectively, calculated over 3 slices through the inferior frontal brain region of each of the 7 subjects (i.e., 21 different slices). For the cost function C3, an optimal weight of 1.75e-5 was used. For a fair comparison, the RMSEs were averaged in the same 3 slices for all shimming methods. These slices are also the same as those used in Figure 2.
Fig. 6.
Fig. 6.
ΔB0 (or voxel shift) maps (C–E) and signal loss (Eq. [4]) maps (F–H) in more inferior slices than those shown in Figures 3–4 and Supporting Information Figures S2–S3, before (C,F; experimental) and after slice-optimized shimming with iPRES (D,G; simulated) or iPRES + 2nd-order SH (E,H; simulated), the cost function C3, and the optimal weight (1.75e-5) for a 2.5-mm isotropic voxel size at 3T. Anatomical images with the brain mask (A, red outline) and sagittal localizers with the slice position (B, red line) are included for anatomical reference. The ΔB0 RMSE (Eq. [1]) and signal loss RMSE (Eq. [3]) in the brain mask of each slice and their changes relative to the baseline are listed below each map.
Fig. 7.
Fig. 7.
Simulated ΔB0 maps (A–C) and signal loss (Eq. [4]) maps (D–F) in similar slices as those shown in Figures 3–4, before (A,D) and after slice-optimized shimming with iPRES (B,E) or iPRES + 2nd-order SH (C,F), the cost function C3, and the optimal weight (6e-5) for a 1-mm isotropic voxel size at 7T. The ΔB0 RMSE (Eq. [1]) and signal loss RMSE (Eq. [3]) in the brain mask of each slice (red outline in Figs. 3–4) and their changes relative to the baseline are listed below each map. Results for all subjects are shown in Supporting Information Figure S4.
Fig. 8.
Fig. 8.
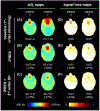
Experimental ΔB0 (or voxel shift) maps (A,E), signal loss (Eq. [4]) maps (B,F), gradient-echo EPI images (C,G), and BOLD fMRI activation maps (D,H) through the inferior frontal brain region, before (A–D) and after (E–H) slice-optimized shimming with iPRES, the cost function C3, and the optimal weight for a 2.5-mm isotropic voxel size at 3T. The ΔB0 RMSE (Eq. [1]) and signal loss RMSE (Eq. [3]) in the brain mask of each slice (red outline) and their changes relative to the baseline are displayed in white below each map. The ΔB0 and signal loss RMSEs, average EPI signal intensity, and number of activated voxels (i.e., Z-score > 1.5) in the inferior frontal brain region (pink oval) and their changes relative to the baseline are displayed in pink above each map or image.

Similar articles

Cited by

References

    1. Constable RT. Functional MR imaging using gradient-echo echo-planar imaging in the presence of large static field inhomogeneities. J Magn Reson Imaging 1995;5:746–752. - PubMed
    1. Glover GH. 3D z-shim method for reduction of susceptibility effects in BOLD fMRI. Magn Reson Med. 1999;42(2):290–299. - PubMed
    1. Song AW. Single-shot EPI with signal recovery from the susceptibility-induced losses. Magn Reson Med. 2001;46(2):407–411. - PubMed
    1. Truong TK, Song AW. Single-shot dual-z-shimmed sensitivity-encoded spiral-in/out imaging for functional MRI with reduced susceptibility artifacts. Magn Reson Med. 2008;59(1):221–7. - PubMed
    1. Hsu JJ, Glover GH. Mitigation of susceptibility-induced signal loss in neuroimaging using localized shim coils. Magn Reson Med. 2005;53(2):243–8. - PubMed

Publication types