

TNF stimulation primarily modulates transcriptional burst size of NF-κB-regulated genes
- PMID: 34288498
- PMCID: PMC8290835
- DOI: 10.15252/msb.202010127
TNF stimulation primarily modulates transcriptional burst size of NF-κB-regulated genes
Abstract
Cell-to-cell heterogeneity is a feature of the tumor necrosis factor (TNF)-stimulated inflammatory response mediated by the transcription factor NF-κB, motivating an exploration of the underlying sources of this noise. Here, we combined single-transcript measurements with computational models to study transcriptional noise at six NF-κB-regulated inflammatory genes. In the basal state, NF-κB-target genes displayed an inverse correlation between mean and noise characteristic of transcriptional bursting. By analyzing transcript distributions with a bursting model, we found that TNF primarily activated transcription by increasing burst size while maintaining burst frequency for gene promoters with relatively high basal histone 3 acetylation (AcH3) that marks open chromatin environments. For promoters with lower basal AcH3 or when AcH3 was decreased with a small molecule drug, the contribution of burst frequency to TNF activation increased. Finally, we used a mathematical model to show that TNF positive feedback amplified gene expression noise resulting from burst size-mediated transcription, leading to a subset of cells with high TNF protein expression. Our results reveal potential sources of noise underlying intercellular heterogeneity in the TNF-mediated inflammatory response.
Keywords: NF-κB; TNF; inflammation; transcriptional bursting.
© 2021 The Authors. Published under the terms of the CC BY 4.0 license.
Conflict of interest statement
The authors declare that they have no conflict of interest.
Figures
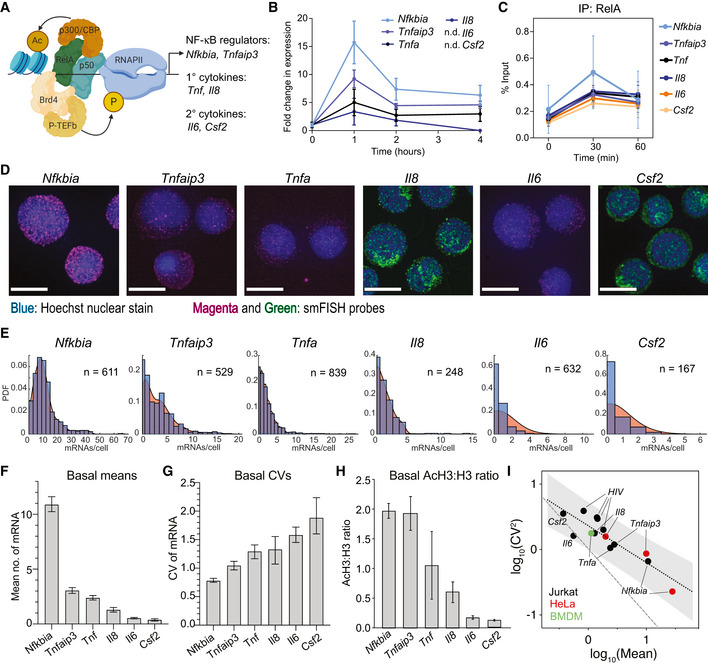
- A
NF‐κB can recruit a variety of binding partners to target promoters, including the chromatin modifying enzyme p300, the elongation complex P‐TEFb, and components of transcriptional machinery. NF‐κB target genes with a variety of functions were chosen for this study.
- B
Induction of NF‐κB targets in Jurkat T cells in response to 20 ng/ml TNF treatment for 1, 2, and 4 h as measured by RT–qPCR. Target values were normalized to GAPDH and are reported as fold change relative to basal expression. Data are presented as mean ± standard deviation (SD) of three biological replicates.
- C
Enrichment of RelA before and 30 and 60 min after treatment with 20 ng/ml TNF as measured by ChIP‐qPCR and shown as % input (non‐IP control). Data are presented as mean ± SD of three biological replicates.
- D
Maximum intensity projections of smFISH fluorescence microscopy z‐stacks of basal Jurkat T cells stained for the indicated genes. Nfkbia, Tnfaip3, Tnf, and Il6 were labeled with Quasar 670, and Il8 and Csf2 were labeled with fluorescein. All images were filtered as described in Materials and Methods. Brightness and contrast were enhanced for visualization. Scale bars: 10 μm.
- E
Histograms of transcripts per cell for target genes (blue) overlaid with probability density plots (red) generated from smFISH data. Cells were combined from three replicates (Nfkbia, Tnfaip3, Tnf, and Il6) or one replicate (Il8, Csf2).
- F, G
Bar graphs of mean (F) and CV (G) of smFISH distributions for the indicated genes. Error bars indicate bootstrapped 95% confidence intervals (CIs) for the samples in (E). Significant differences indicated by non‐overlapping CIs.
- H
Ratio of enrichment of total histone H3 to acetylated H3 (AcH3) in Jurkat T cells at the indicated target promoters quantified by ChIP‐qPCR. Data are presented as mean of % input (non‐IP control) ± SD of three biological replicates.
- I
Graph of log10(mean) vs log10(CV2) of basal mRNA distributions measured in Jurkat T cells (black), HeLa cells (red), or murine bone marrow–derived macrophages (green) for endogenous genes and four latent HIV LTR integrations. Gray shading indicates 95% CI of the linear regression for the basal trend line. Poisson trend line indicated by dashed line. HeLa data from Lee et al (2014) and HIV LTR data from Wong et al (2018).
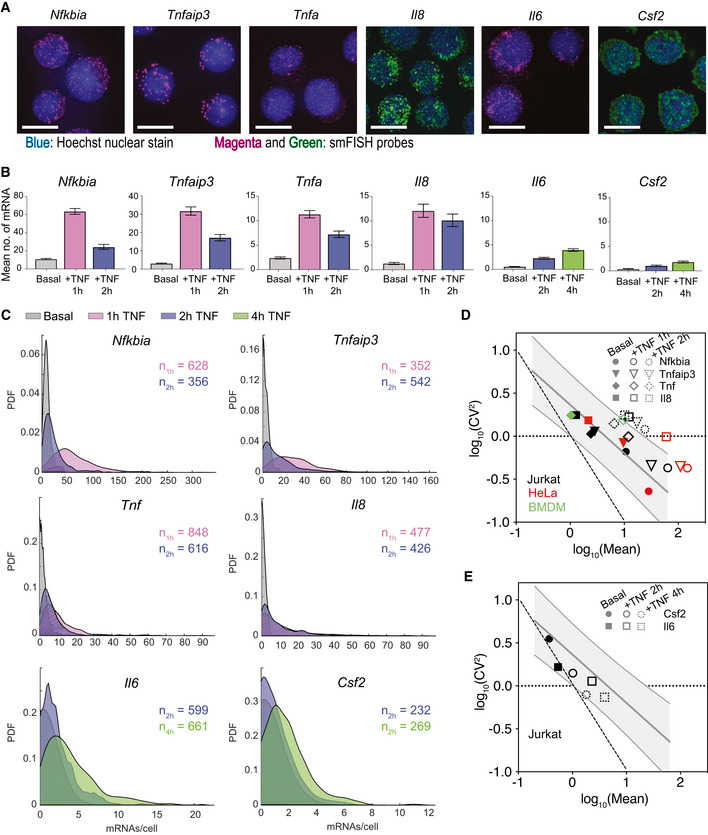
- A
Maximum intensity projections of smFISH fluorescence microscopy z‐stacks of Jurkat T cells stained for the indicated genes after 1‐h (Nfkbia, Tnfaip3, Tnf, Il8) or 4‐h (Il6, Csf2) treatment with 20 ng/ml TNF. Nfkbia, Tnfaip3, Tnf, and Il6 were labeled with Quasar 670, and Il8 and Csf2 were labeled with fluorescein. All images were filtered as described in Materials and Methods. Brightness and contrast were enhanced for visualization. Scale bars: 10 μm.
- B
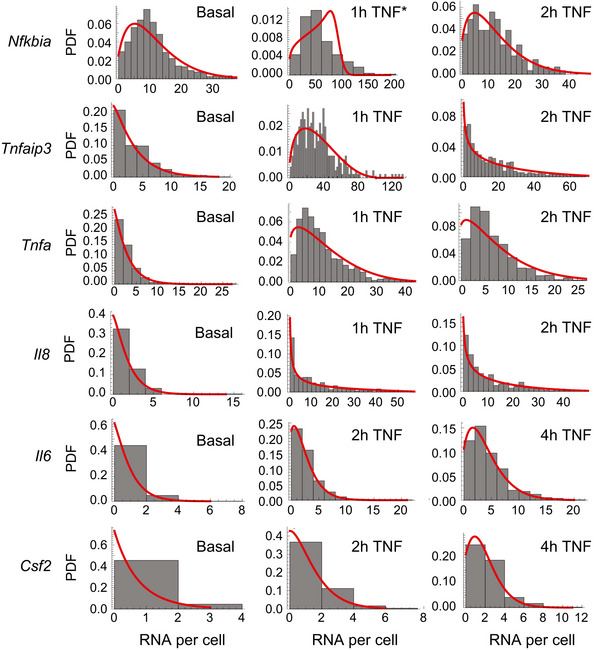
Bar graphs of mean of smFISH distributions before and after TNF treatment for the indicated genes. Cells were combined from three replicates (Nfkbia 1 h; Tnfaip3 1 h; Tnf 1, 2 h; and Il6 2, 4 h) two replicates (Nfkbia 2 h) or one replicate (Tnfaip3 2 h; Il8 1, 2 h; Csf2 2, 4 h). Basal data are same as in Fig 1E. Error bars indicate bootstrapped 95% CIs for the samples in (C). Significant differences indicated by non‐overlapping CIs.
- C
Probability density plots of single‐cell mRNA distributions from smFISH as described in (B) before and after treatment with 20 ng/ml TNF for the indicated time points.
- D, E
Graph of log10(mean) vs log10(CV2) for endogenous gene targets that maintain CV2 (D) or decrease CV2 (E) after treatment with 20 ng/ml TNF in Jurkat T cells (black), HeLa cells (red), or murine bone marrow–derived macrophages (green). Gray shading indicates 95% CI of basal trend line. Poisson trend line indicated by dashed line. HeLa data from Lee et al (2014).
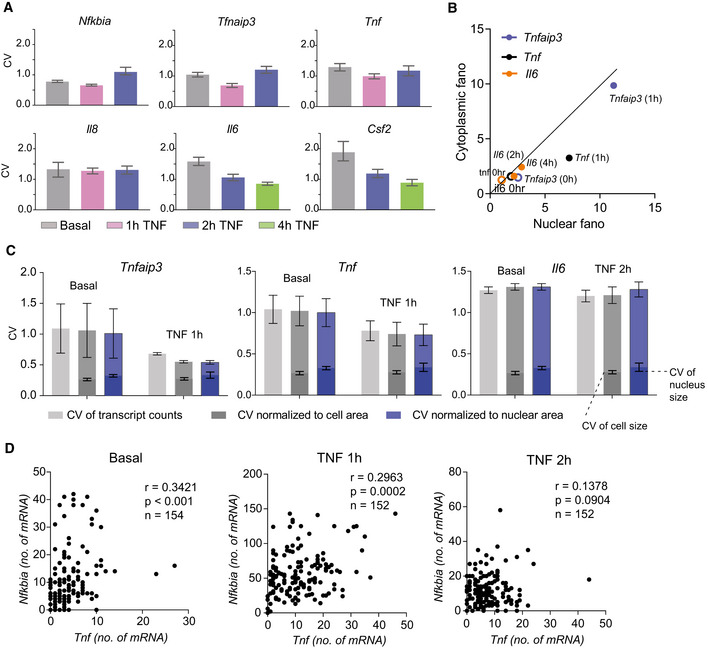
Bar graphs of coefficient of variation (CV) of basal and TNF‐stimulated smFISH distributions presented in Fig 2B and C for the indicated genes at the indicated time points. Error bars indicate bootstrapped 95% confidence intervals (CIs). Significant differences indicated by non‐overlapping CIs. Sample sizes are displayed in Fig 1E and 2C.
Fano factor of mRNA counts in the nuclear vs cytoplasmic fractions of cells before and after 20 ng/ml TNF stimulation for the indicated genes. Data points are labeled with gene and time point. The diagonal is shown as a solid line to guide the eye.
CV of basal and TNF‐stimulated smFISH distributions for Tnfaip3, Tnf, and Il6 presented in Fig 2B and C unnormalized (light gray) or normalized to cellular area (dark gray) or nuclear area (blue). Lower bars indicating the CV of cellular area (dark gray) and nuclear area (blue) in basal and TNF‐stimulated smFISH images are included with each gene for reference. Data are presented as mean ± SD of CVs from two replicate experiments for each gene and condition.
Scatter plots comparing mRNA counts for Tnf and Nfkbia in the same cells from multiplex smFISH for basal, 1 h and 2 h of 20 ng/ml TNF stimulation. Pearson correlation r, P‐value, and no. of cells n are indicated.
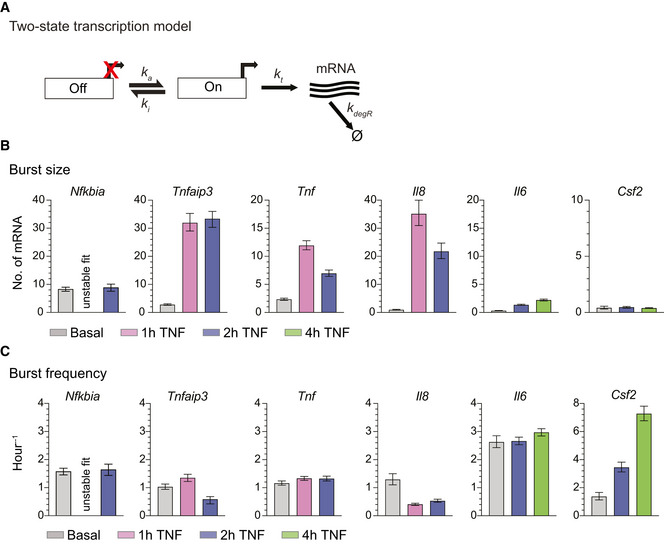
- A
Schematic of a two‐state promoter model for transcriptional bursting. Burst frequency (k a) and burst size (b = k t/k i) were fit to combined transcript distributions measured by smFISH.
- B, C
Burst size (B) and burst frequency (C) parameter fits from the two‐state model in the basal state and after treatment with 20 ng/ml TNF for 1, 2, or 4 h. Error bars indicate bootstrapped 95% CIs. Significant differences indicated by non‐overlapping CIs. The fit for Nfkbia (1‐h TNF) was unstable and thus is not reported (see Materials and Methods). Sample sizes are displayed in Figs 1E and 2C.
- A
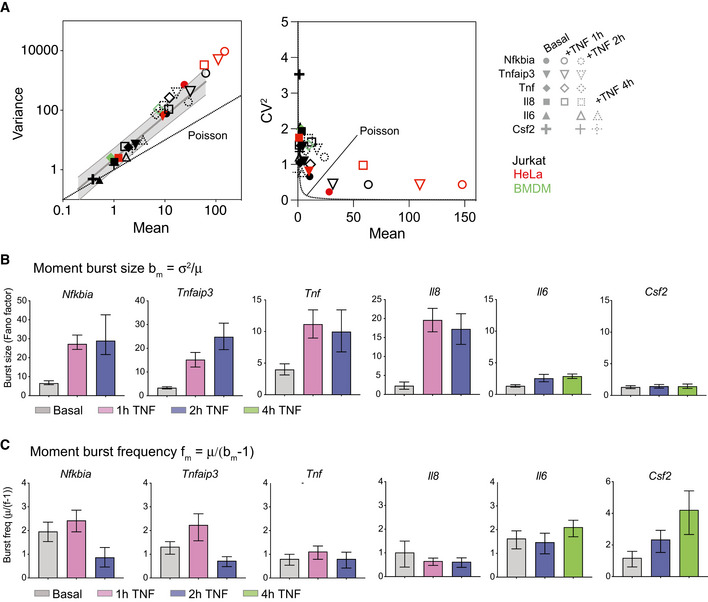
Graph of variance vs mean (left) and CV2 vs mean (right) for endogenous gene targets before (black) and after treatment with 20 ng/ml TNF in Jurkat T cells, HeLa cells, or murine bone marrow–derived macrophages (see labels for details). Gray shading indicates 95% CI of basal trend line. Poisson trend line indicated by dashed lines. HeLa data from Lee et al (2014).
- B, C
Bar graphs of moment burst size bm (B) and moment burst frequency fm (C) calculated from basal and TNF‐stimulated smFISH distributions presented in Figs 1 and 2 for the indicated genes at the indicated time points. Error bars indicate bootstrapped 95% CIs. Significant differences indicated by non‐overlapping CIs. Sample sizes are displayed in Figs 1E and 2C.
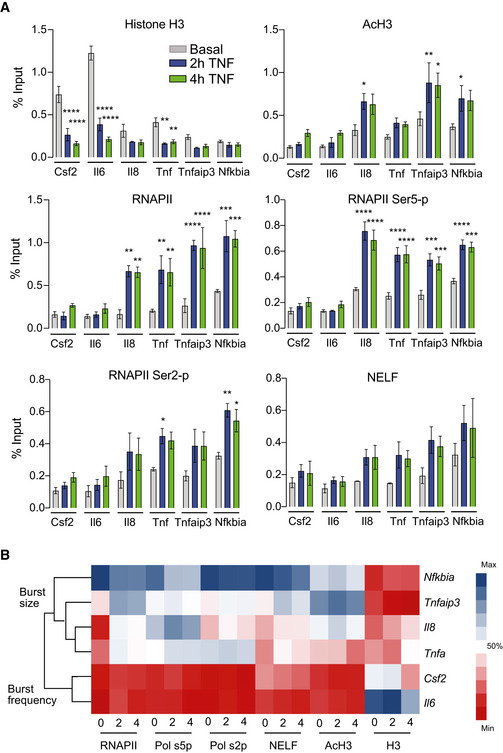
Enrichment of histone H3, AcH3, total RNPII, ser5‐p RNPII, ser2‐p RNPII, and NELF‐E in the basal state (0 h) and after treatment (2 and 4 h) with 20 ng/ml TNF quantified using ChIP and shown as % input (non‐IP control). Data are presented as mean ± standard error of the mean (s.e.m.) of three biological replicates. Significance calculated by Dunnett's multiple comparison test (*P < 0.05, **P < 0.01, ***P < 0.001, ****P < 0.0001).
Hierarchical clustering of ChIP data before and after TNF treatment separates promoters with TNF‐mediated increases in burst frequency or burst size. For each protein target, color bar indicates the % maximum ChIP value measured across all genes and time points.
- A
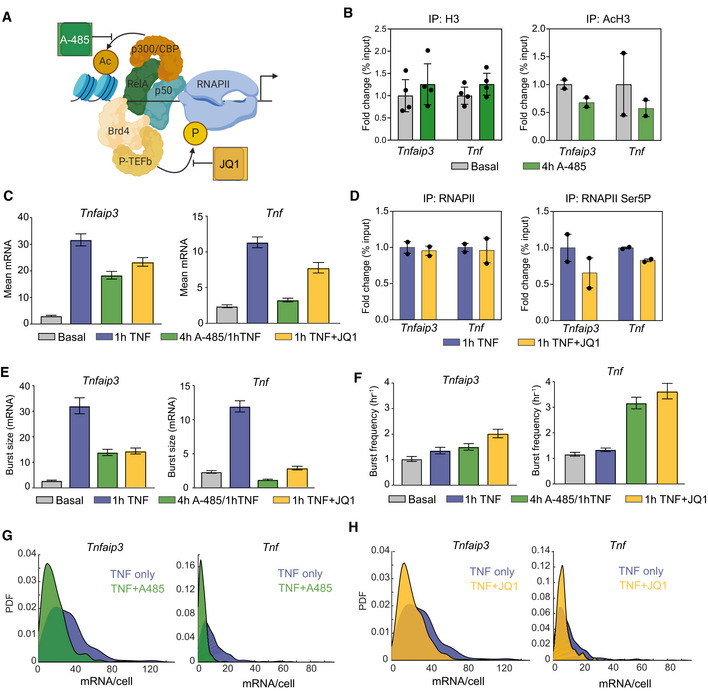
Schematic of A‐485 inhibition of the histone acetyl transferase p300/CBP, which is recruited by NF‐κB, and of JQ1 inhibition of BET bromodomains, which recruit the positive transcription elongation factor b (P‐TEFb).
- B
Change in enrichment of histone H3 and AcH3 after treatment with 300 nM A‐485 for 4 h measured by ChIP‐qPCR and shown as % input (non‐IP control) normalized to the uninhibited control for each gene. Data are presented as mean ± SD for two or four biological replicates.
- C
Bar graphs of mean mRNA level for basal condition, 1‐h TNF, 1‐h TNF + 4 h pretreatment with 300 nM A‐485, and 1‐h TNF + 62.5 nM JQ1 cotreatment measured by smFISH for Tnfaip3 (left) and Tnf (right). Cells were combined from two replicates (Tnfaip3 A‐485, JQ1; Tnf A‐485) or one replicate (Tnf JQ1). Error bars indicated bootstrapped 95% CIs. Samples with non‐overlapping CIs are significant.
- D
Change in enrichment of total and Serine‐5‐phosphorylated RNAPII after 20 ng/ml TNF treatment for 1 h with 62.5 nM JQ1 measured by ChIP‐qPCR and shown as % input (non‐IP control) normalized to the uninhibited control for each gene. Data are presented as mean for two biological replicates.
- E, F
Burst size (E) and burst frequency (F) parameter fits from the two‐state model for the same conditions in (C) measured by smFISH for Tnfaip3 (left) and Tnf (right) for the data described in (C). Error bars indicated bootstrapped 95% CIs. Samples with non‐overlapping CIs are significant.
- G, H
Probability density of mRNA distributions measured by smFISH for 20 ng/ml TNF for 1‐h (blue) vs 1‐h TNF + 4 h pretreatment with 300 nM A‐485 (green) (G) and 1‐h TNF (blue) vs 1‐h TNF + 62.5 nM JQ1 cotreatment (yellow) (H) for Tnfaip3 (left) and Tnf (right).
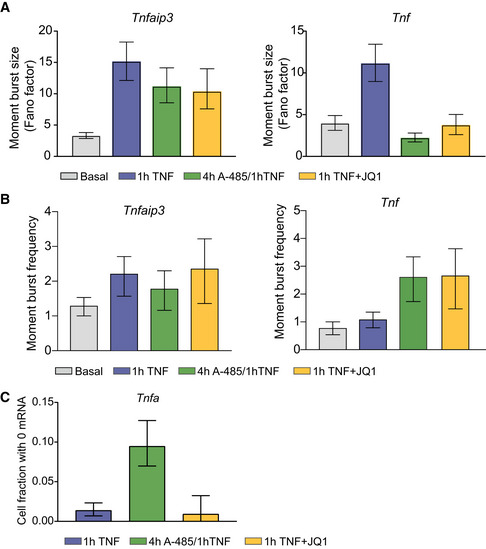
- A, B
Bar graphs of the moment burst size bm (i.e., Fano factor) (A) and moment burst frequency fm (μ/(bm − 1)) of TNF‐stimulated smFISH distributions for basal (gray) or 20 ng/ml TNF for 1 h alone (blue) or in combination with a 4 h A‐485 pretreatment (green) or with 1‐h JQ1 (yellow). Error bars indicate bootstrapped 95% CIs. Sample sizes are displayed in Fig 5G and H.
- C
Fraction of cells with no Tnf transcripts after 1 h of TNF stimulation in combination with the indicated inhibitors as described in (A, B). Error bars indicate bootstrapped 95% CIs.
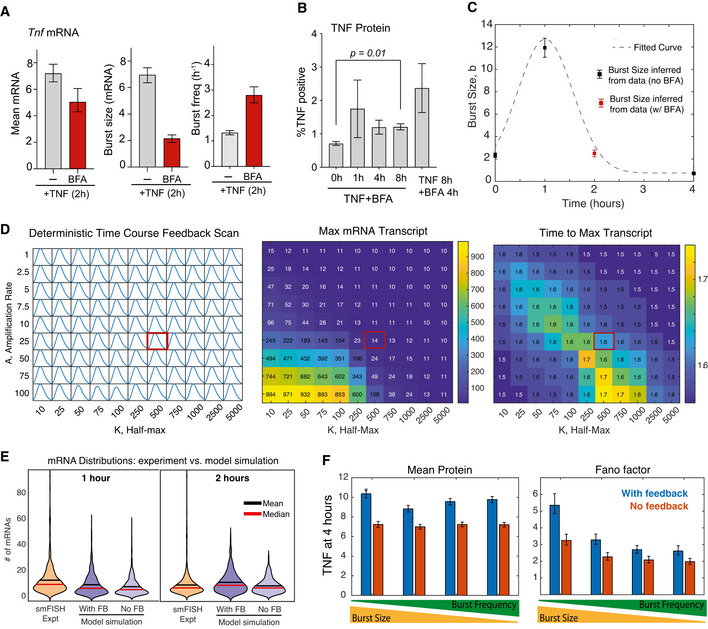
Bar graphs of mean of Tnf smFISH distributions (left) and inferred burst size and burst frequency (right) after treatment with 20 ng/ml TNF for 2 h alone or in the presence of brefeldin A (BFA). Cells for TNF + BFA are from one replicate (n = 148). Error bars indicate bootstrapped 95% CIs.
Bar graphs of % cells positive for intracellular TNF after treatment with 20 ng/ml TNF for 0, 1, 4, or 8 h in the presence of brefeldin A (BFA) or for 8 h TNF with BFA present at 4–8 h only. Data are presented as the mean ± s.e.m. of three biological replicates. Significance is reported if P < 0.05 by Welch's t‐test.
A time‐dependent burst size function for Tnf mRNA production was fit to experimental data as indicated.
Time course of Tnf mRNA (left), maximum mRNA (middle), and time to max mRNA (right) from a deterministic model simulation for varying amplification (a) and half‐maximal value (K) to find feedback strength that approximately reproduces experimentally measured Tnf transcript levels (Fig 1B). The red box indicates the parameter set used to produce the graphs in Fig 6B and C.
Violin plots of Tnf mRNA distributions measured by smFISH 1–2 h after TNF stimulation and simulated mRNA distributions with and without TNF positive feedback for the same conditions.
Predicted mean and Fano factor for protein in simulated single‐cell distributions 4 h after TNF treatment for four different bursting parameter sets. The “high burst size” parameters (left) and “high burst frequency” parameters (right) are calculated from the distributions presented in Fig 6D and E. Error bars represent 95% CIs from 1,000 single‐cell simulations.
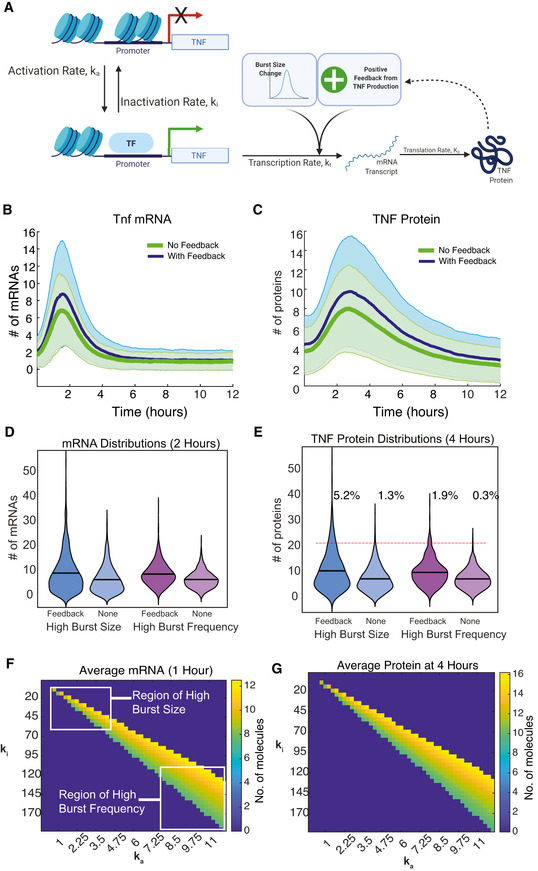
- A
Schematic of the two‐state model of transcription coupled to translation of a protein (TNF) that positively feeds back on its own transcription rate.
- B, C
Model simulation of cell‐population averages of Tnf mRNA (B) and TNF protein (C) vs time with and without positive feedback. Data are presented as mean (dark line) and SD (shaded region) of 1,000 simulated cells.
- D, E
Violin plots of simulated single‐cell mRNA (D) and protein (E) numbers with and without positive feedback for either an increase in burst size (blue) or burst frequency (purple) in response to exogenous TNF treatment. Data are presented as number of molecules in 1,000 simulated cells. Red line indicates threshold of 20 protein molecules designating activated cells.
- F, G
Cell‐population averages from stochastic simulations with positive feedback of Tnf mRNA at 1 h (F) and TNF protein at 4 h (G) after TNF treatment across a parameter space with increasing burst frequency (k a) and decreasing burst size (k i) chosen to produce levels of Tnf mRNA similar to experimental observations.
References
-
- Acar M, Mettetal JT, Av O (2008) Stochastic switching as a survival strategy in fluctuating environments. Nat Genet 40: 471–475 - PubMed
-
- Aggarwal BB (2003) Signalling pathways of the TNF superfamily: a double‐edged sword. Nat Rev Immunol 3: 745–756 - PubMed
-
- Baeuerle PA, Baltimore D (1988) IκB: a specific inhibitor of the NF‐κB transcription factor. Science 242: 540–546 - PubMed
-
- Bagnall J, Boddington C, England H, Brignall R, Downton P, Alsoufi Z, Boyd J, Rowe W, Bennett A, Walker C et al (2018) Quantitative analysis of competitive cytokine signaling predicts tissue thresholds for the propagation of macrophage activation. Sci Signal 11: eaaf3998 - PubMed
Publication types
MeSH terms
Substances
Grants and funding
LinkOut - more resources
Full Text Sources
