. 2021 Jul;129(7):75001.
doi: 10.1289/EHP8888. Epub 2021 Jul 21.

COVID-19, the Built Environment, and Health

Affiliations

COVID-19, the Built Environment, and Health

Howard Frumkin. Environ Health Perspect. 2021 Jul.

Abstract

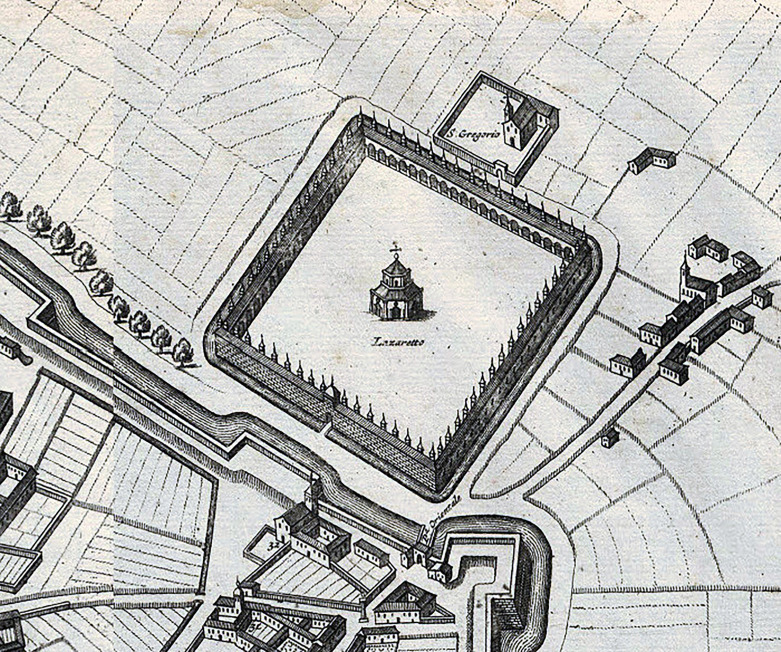
Background: Since the dawn of cities, the built environment has both affected infectious disease transmission and evolved in response to infectious diseases. COVID-19 illustrates both dynamics. The pandemic presented an opportunity to implement health promotion and disease prevention strategies in numerous elements of the built environment.

Objectives: This commentary aims to identify features of the built environment that affect the risk of COVID-19 as well as to identify elements of the pandemic response with implications for the built environment (and, therefore, for long-term public health).

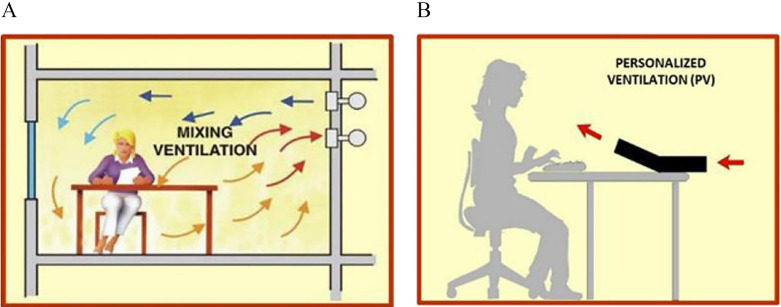
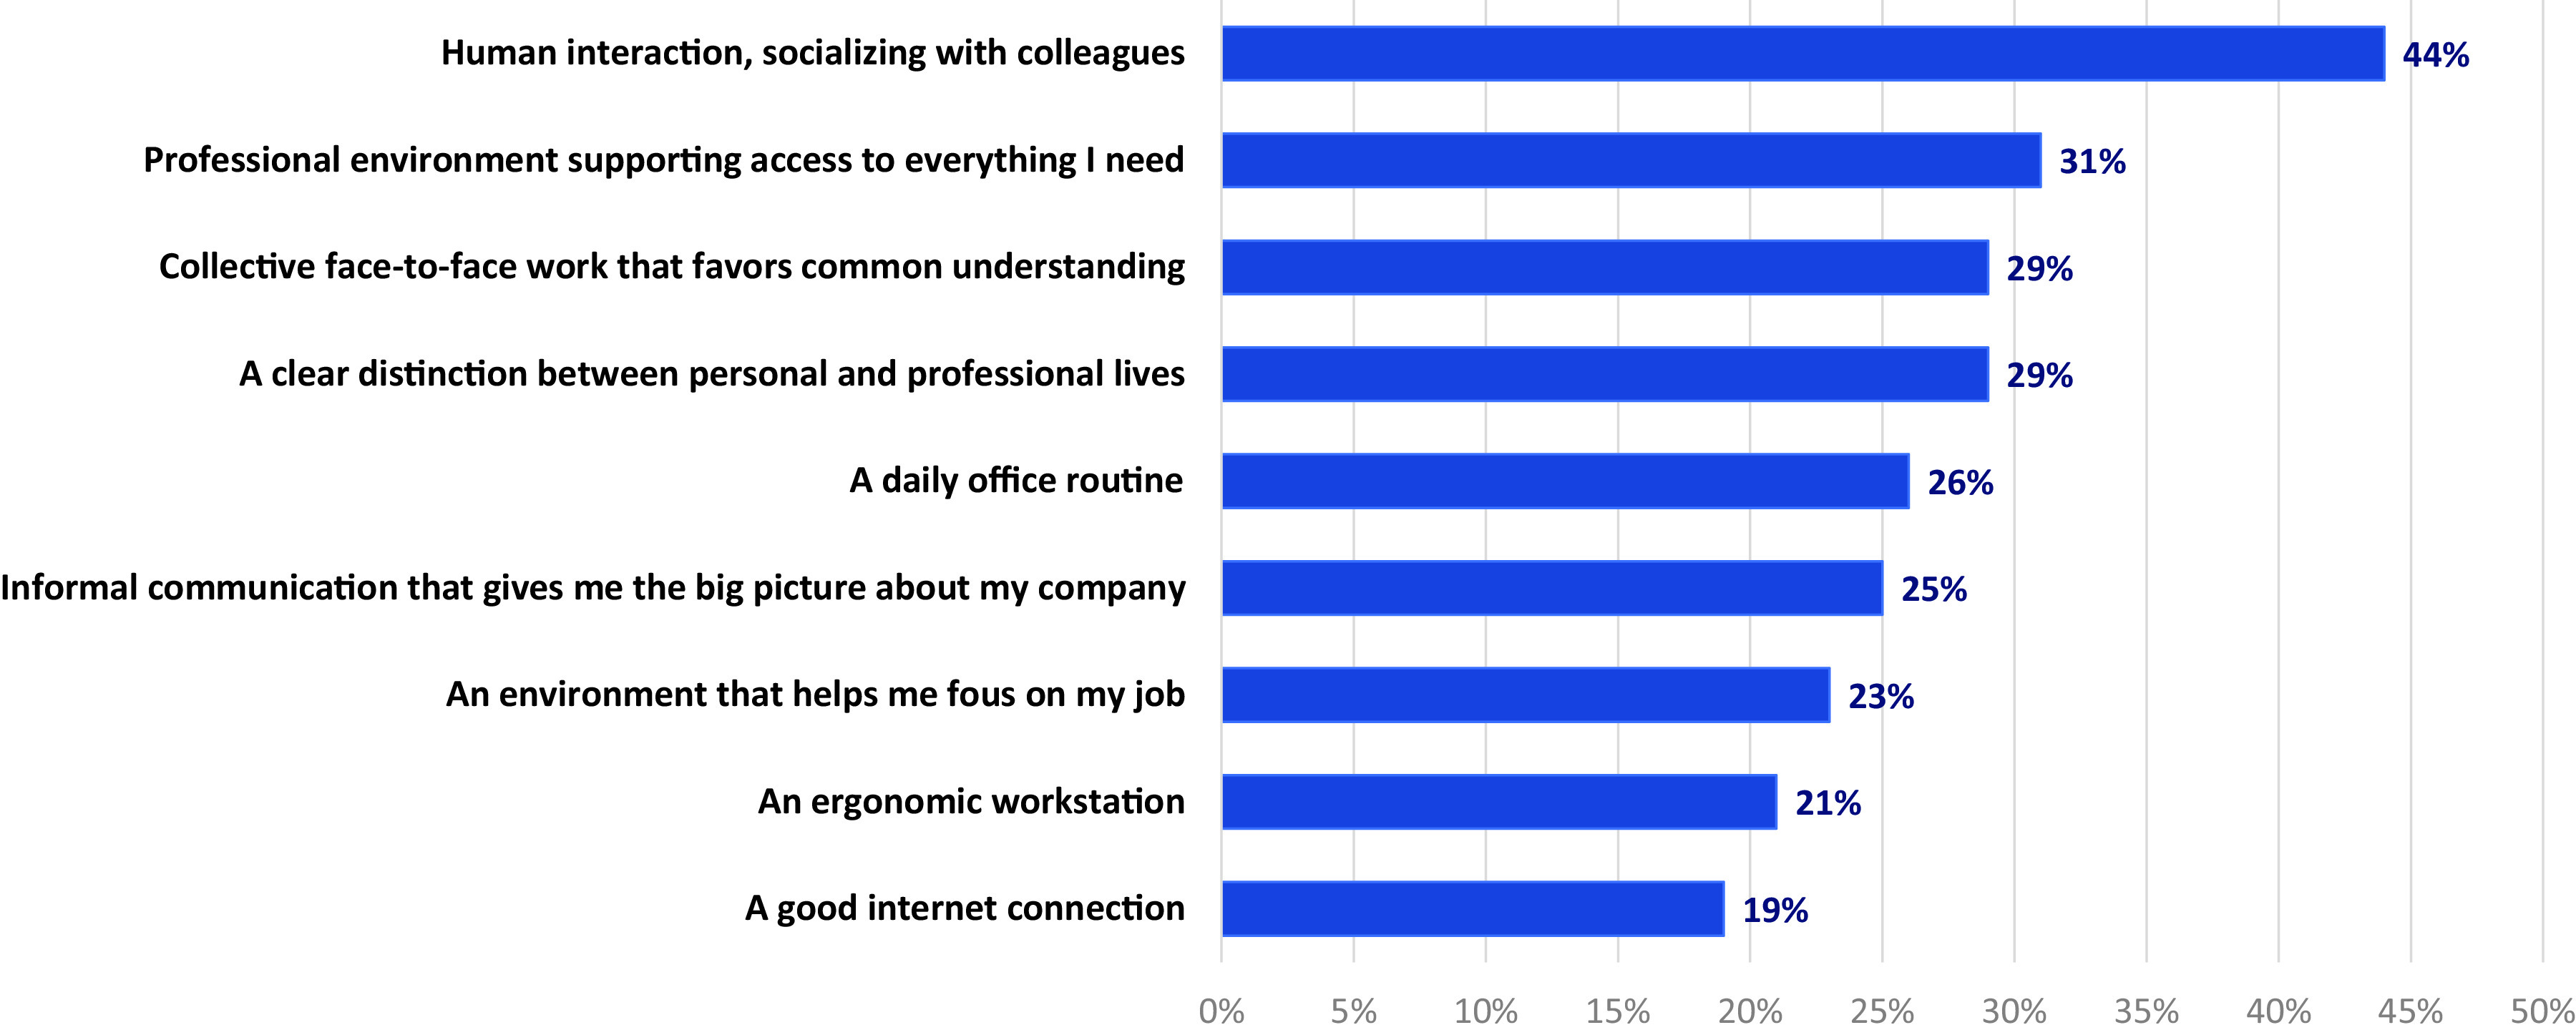
Discussion: Built environment risk factors for COVID-19 transmission include crowding, poverty, and racism (as they manifest in housing and neighborhood features), poor indoor air circulation, and ambient air pollution. Potential long-term implications of COVID-19 for the built environment include changes in building design, increased teleworking, reconfigured streets, changing modes of travel, provision of parks and greenspace, and population shifts out of urban centers. Although it is too early to predict with confidence which of these responses may persist, identifying and monitoring them can help health professionals, architects, urban planners, and decision makers, as well as members of the public, optimize healthy built environments during and after recovery from the pandemic. https://doi.org/10.1289/EHP8888.


Figures

Figure 1 is a sketch map of Milan’s lazaretto which was built just outside the city’s walls in the late 15th and early 16th centuries to house plague victims.
Figure 1.
Milan’s lazaretto, built just outside the city’s walls in the late 15th and early 16th centuries to house plague victims. Having outlived its usefulness, it was demolished about 400 y later. This part of Milan, Porta Venezia, is now a vibrant neighborhood of galleries and ethnic restaurants—or it was until COVID-19 struck. Source: https://commons.wikimedia.org/wiki/Category:Lazzaretto_(Milan)#/media/File:Lazzaretto_di_Milano_1704.jpg.
Figure 2 is a poster that displays the text that reads, Washtenaw County Health Department. Public health order. By order of the Washtenaw County Health Officer, this facility is limited to 50 percent occupancy load through April 5, 2020. Michigan Public Health Code, Public Act 378 of 1978. At the bottom, on the left, the logo of Washtenaw County Health Department is present, at the center, contact information: Washtenaw dot org forward slash covid19, 734-544-6700 is present. On the right, social media link: at wcpublichealth in Facebook, Twitter, and Instagram is present.
Figure 2.
As accumulating evidence showed that SARS CoV-2, the cause of COVID-19, spread by airborne transmission, many jurisdictions limited the number of people who could be in indoor spaces. Source: Washtenaw County (Michigan) Health Department, used with permission.
Figure 3 is a cartoon illustration having two parts. Figure 3A displays a room with a conventional air supply duct and return and inside a woman is sitting at a table holding papers with text that reads, mixing ventilation. Figure 3B displays a woman sitting on a chair typing on a keyboard and a stylized personal air duct pointed at her at a 150-degree angle with two arrows pointing towards her and text that reads, personalized ventilation.
Figure 3.
(A) Conventional ventilation vs. (B) personalized ventilation. Ventilating an entire room requires more energy, is costlier, and may offer less protection from infection than delivering fresh air directly to people’s breathing zones. Reprinted from Building and Environment, 186, Arsen K. Melikov, COVID-19: Reduction of airborne transmission needs paradigm shift in ventilation, 107336. Copyright (2020), with permission from Elsevier.
Figure 4 is a horizontal bar graph depicting what employees report missing most about being in the office, from a survey of 3000 respondents across North America, Europe, and Asia. There are nine horizontal bars, each showing a proportion of respondents who endorsed a reason, as follows: Human interaction, socializing with colleagues (44 percent); Professional environment supporting access to everything I need (31 precent); Collective face-to-face work that favors common understanding (29 percent); A clear distinction between personal and professional lives (29 precent); A daily office routine (26 precent); Informal communication that gives me the big picture about my company (25 precent); An environment that helps me focus on my job (23 precent); An ergonomic workstation (21 precent); and A good internet connection (19 precent).
Figure 4.
What employees miss most about being in the office. Results of a May 2020 survey of 3,000 respondents across North America, Europe, and Asia. Source: (Ulbrich 2020); data from JLL, used with permission.
Figure 5 is an image of Mainkai Street, Frankfurt, during the COVID-19 pandemic in 2020, displaying the increase in pedestrian and bicycle activity.
Figure 5.
Mainkai Street, Frankfurt, during the COVID-19 pandemic in 2020. Once the street was closed to vehicles, pedestrian and bicycle activity substantially increased. Source: Photography by Beatriz Kauark, from Pandit et al. (2020). Open Access article distributed under the terms of the Creative Commons Attribution-NonCommercial-NoDerivatives License (http://creativecommons.org/licenses/by-nc-nd/4.0/).
Figure 6 is an illustration depicting people’s reasons for choosing a mode of transportation before and during the COVID-19 pandemic. The reasons were elicited in response to the question “What are or were your key reasons to choose a mode of transportation?” in a survey conducted in China, France, Germany, Italy, Japan, the United Kingdom, and the United States. There are two tabular representations, one for business and commuting trips, the other for private trips. Each has eight rows and two columns, listing key reasons for choosing a mode of transportation by rank order. For business and commuting trips, the pre-COVID reasons, in order, are as follows: Time to destination, Convenience, Price of trip, Space and privacy, Avoidance of congestion, Risk of infection, Sustainability, and Status, and the reasons during the pandemic, in order, are as follows: Risk of infection, Time to destination, Convenience, Space and privacy, Price of trip, Avoidance of congestion, Sustainability, and Status. For private trips, the pre-COVID reasons, in order, are as follows: Time to destination, Price of trip, Space and privacy, Convenience, Avoidance of congestion, Risk of infection, Sustainability, and Status, and the reasons during the pandemic, in order, are as follows: Risk of infection, Time to destination, Space and privacy, Convenience, Price of trip, Avoidance of congestion, Sustainability, and Status.
Figure 6.
People’s reasons for preferring one or another mode of transportation shifted during the COVID-19 pandemic, with risk of infection overtaking usual reasons such as time and convenience. This shift led to a dramatic decline in the use of mass transit. Exhibit from “Five COVID-19 aftershocks reshaping mobility’s future,” September 2020, McKinsey & Company, http://www.mckinsey.com. Copyright (c) 2021 McKinsey & Company. All rights reserved. Reprinted by permission.
Figure 7 is a photograph that displays a park entrance board with text that reads, Franklin Farm Park. Franklin County Park Authority. Below, a cardboard poster with text that reads, In order to prevent the spread of Covid-19, this facility is closed Cerrado to the public until further notice.
Figure 7.
Parks, beaches, and other outdoor destinations closed to minimize the spread of COVID-19, reducing access to an established means of health promotion (Kondo et al. 2018; Reyes-Riveros et al. 2021). Photo reused from Wikimedia commons: https://bit.ly/35KRm0G and licensed under the Creative Commons Attribution–Share Alike 4.0 International license: https://creativecommons.org/licenses/by-sa/4.0/legalcode.
Figure 8 is a line graph depicting Google searches on “outside” (left) and “garden” (right) in five countries, namely, the United States, the United Kingdom, India, Canada, and Germany, from December 2018 to October 2020. The graph plots levels of Google searches ranging from 25 to 100 in increments of 25 (y-axis) across years, from December 23, 2018, August 4, 2019, March 15, 2020, to October 25, 2020 (x-axis) . It shows increases in the number of searches for each of the terms in each of the countries in March, 2020, which are not evident in March, 2019, with the single exception of searches on “garden” in India which fell in March, 2020.
Figure 8.
Google searches on “outside” (left) and “garden” (right) in four English-speaking countries and Germany, December 2018–December 2020. Note the increase in March 2020 (the vertical line marks March 15), around when COVID-19 restrictions began. (The sharp downturn in India on “garden” searches may be related to the country’s southern hemisphere location.) Data source: Google Trends (https://www.google.com/trends).

Comment in

Similar articles

Cited by

References

    1. Abdullah M, Dias C, Muley D, Shahin M. 2020. Exploring the impacts of COVID-19 on travel behavior and mode preferences. Transp Res Interdiscip Perspect 8:100255, PMID: 34173481, 10.1016/j.trip.2020.100255. - DOI - PMC - PubMed
    1. Abolanle RG, Alexandra MC-C, Paul AS, Malcolm HG. 2020. The contribution of commuting to total daily moderate-to-vigorous physical activity. J Meas Phys Behav 3(3):189–196, 10.1123/jmpb.2019-0027. - DOI
    1. Acuto M. 2020. Will COVID-19 make us think of cities differently? NewCities. 20 March 2020. https://newcities.org/the-big-picture-will-covid-19-make-us-think-cities... [accessed 11 July 2021].
    1. Adhikari S, Pantaleo NP, Feldman JM, Ogedegbe O, Thorpe L, Troxel AB. 2020. Assessment of community-level disparities in coronavirus disease 2019 (COVID-19) infections and deaths in large US metropolitan areas. JAMA Netw Open 3(7):e2016938, PMID: 3272102, 10.1001/jamanetworkopen.2020.16938. - DOI - PMC - PubMed
    1. Aegerter AM, Deforth M, Johnston V, Sjøgaard G, Volken T, Luomajoki H, et al. . 2021. No evidence for an effect of working from home on neck pain and neck disability among Swiss office workers: short-term impact of COVID-19. Eur Spine J Apr:1–9, PMID: 33817763, 10.1007/s00586-021-06829-w. - DOI - PMC - PubMed