. 2021 Jul 21;16(7):e0254826.
doi: 10.1371/journal.pone.0254826. eCollection 2021.

Transmission dynamics and forecasts of the COVID-19 pandemic in Mexico, March-December 2020

Affiliations

Transmission dynamics and forecasts of the COVID-19 pandemic in Mexico, March-December 2020

Amna Tariq et al. PLoS One. .

Abstract

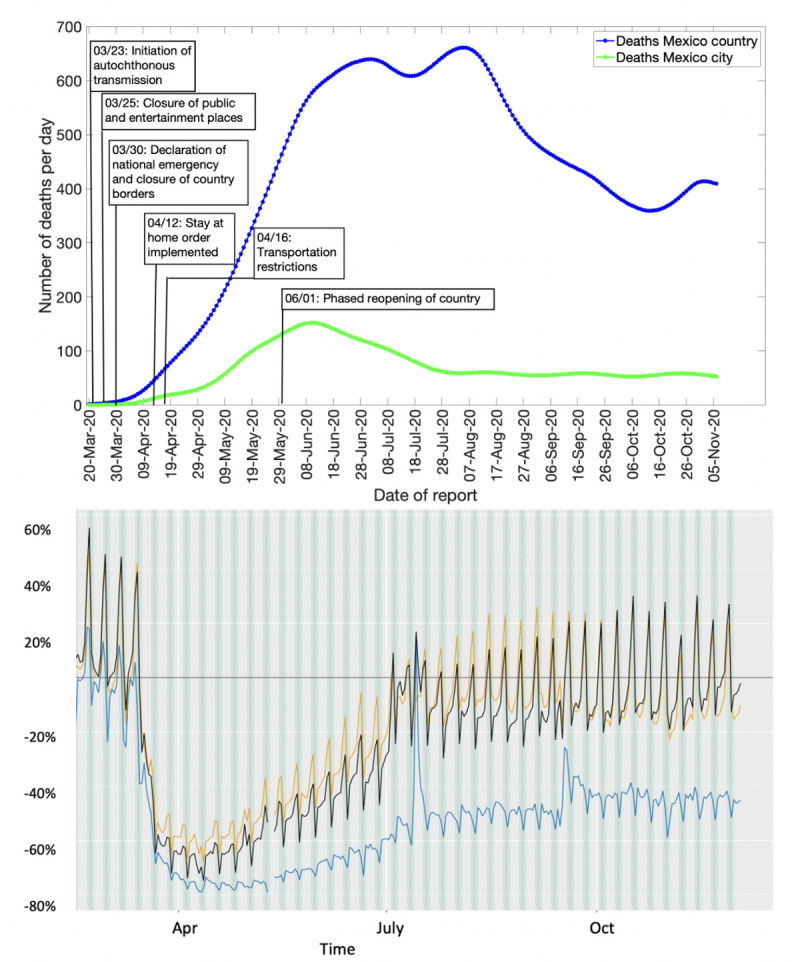
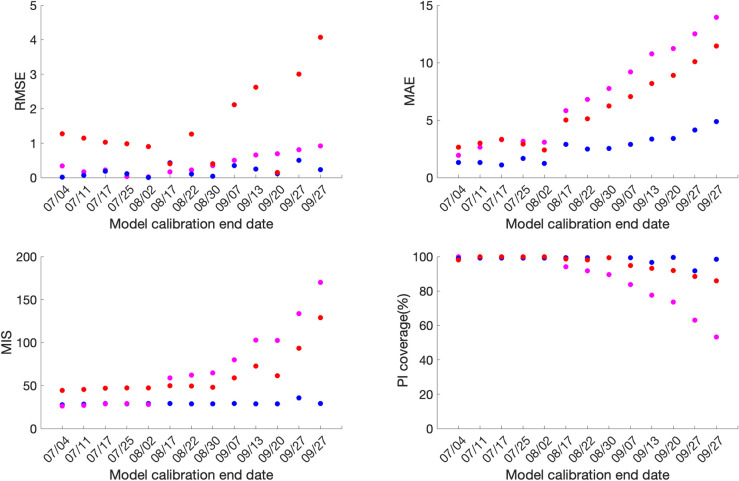
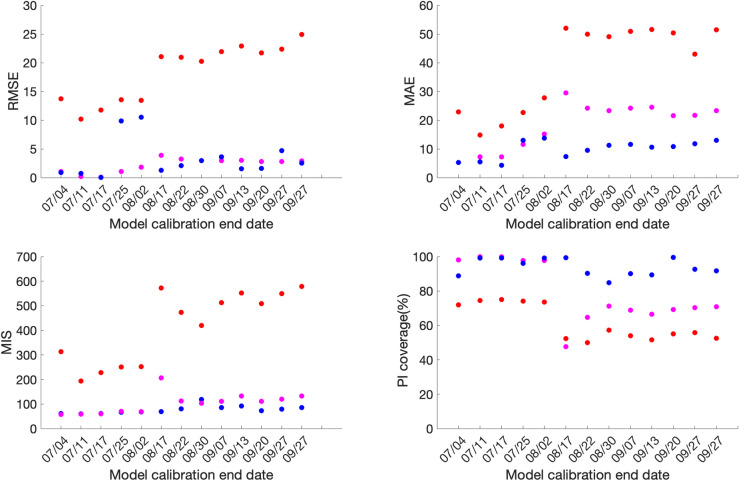
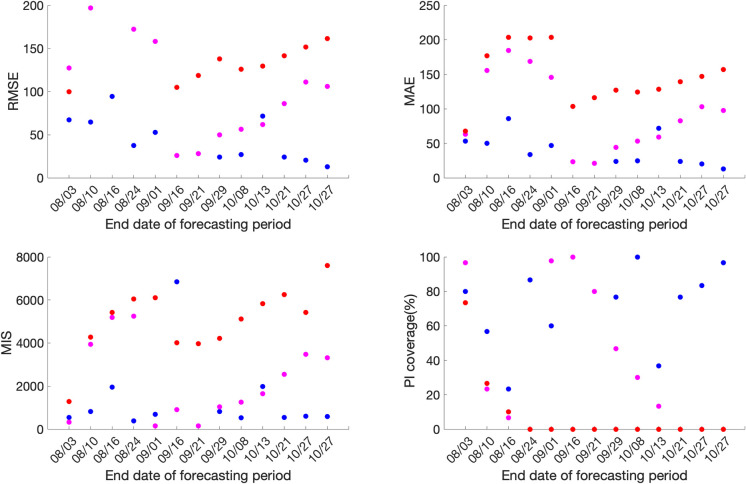
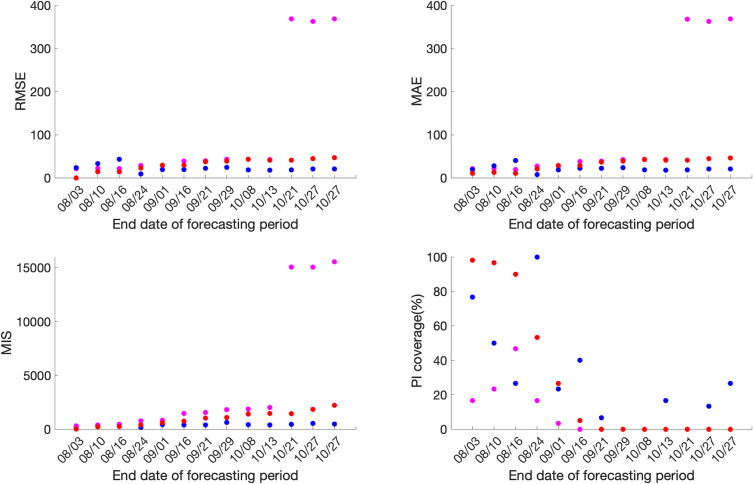
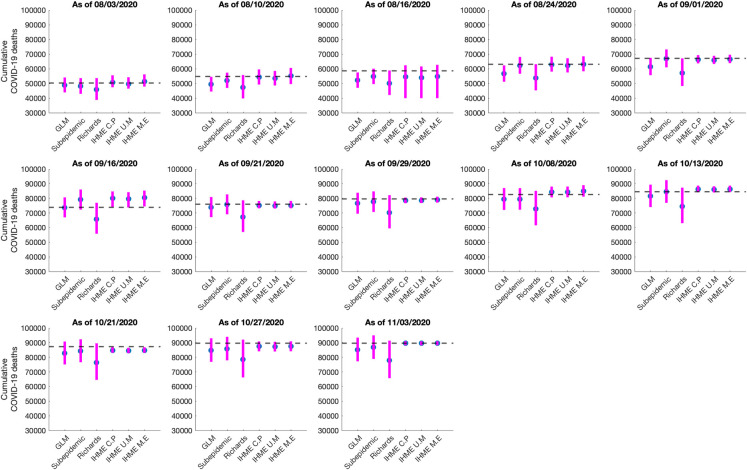
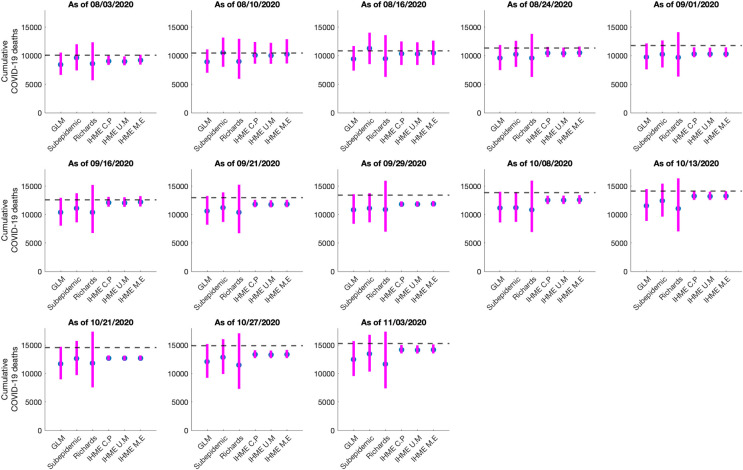
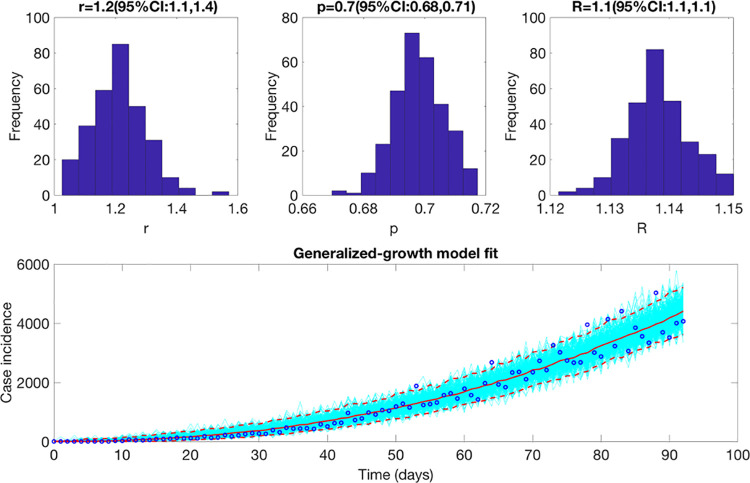
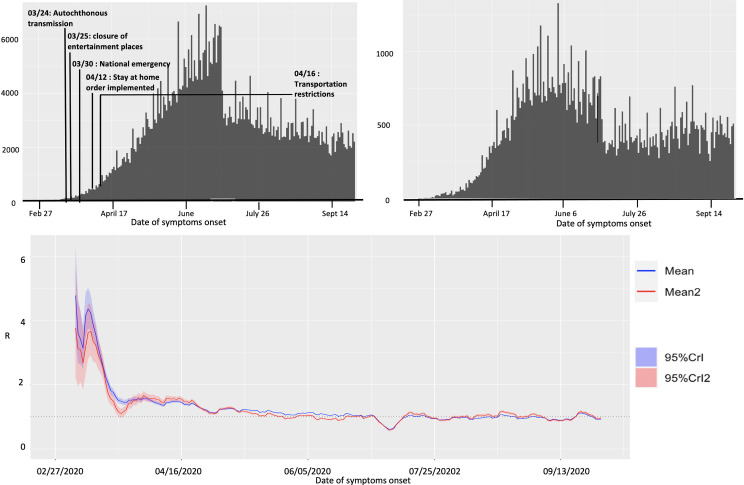
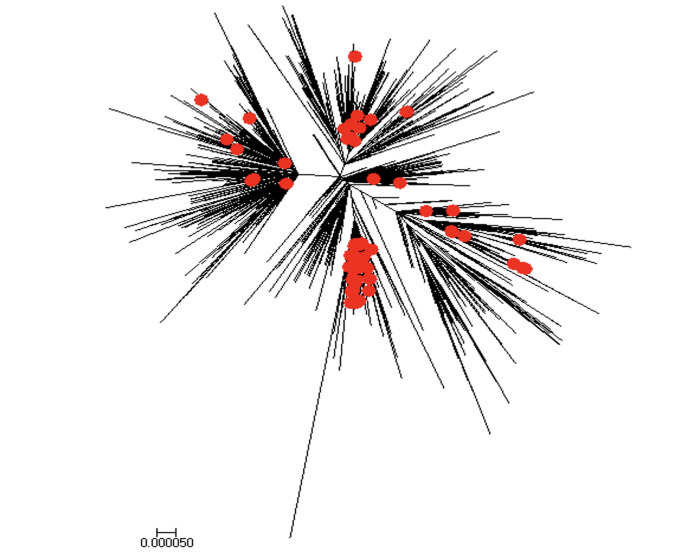
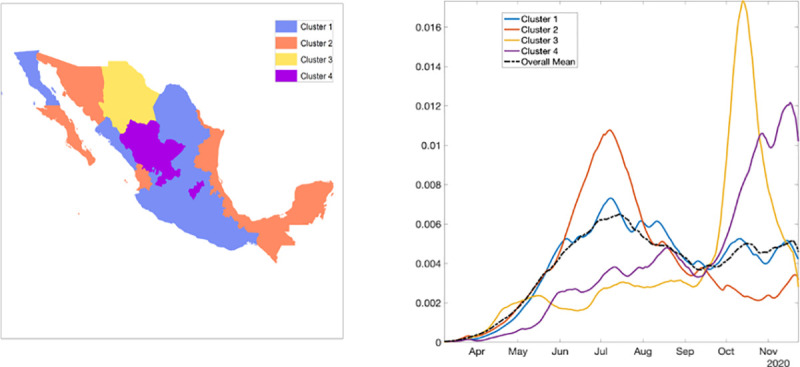
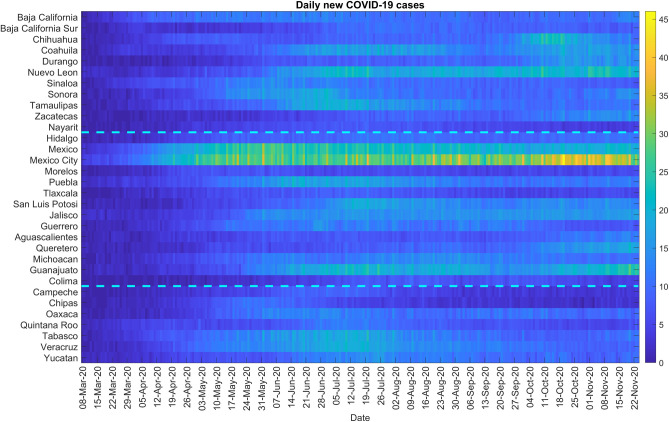
Mexico has experienced one of the highest COVID-19 mortality rates in the world. A delayed implementation of social distancing interventions in late March 2020 and a phased reopening of the country in June 2020 has facilitated sustained disease transmission in the region. In this study we systematically generate and compare 30-day ahead forecasts using previously validated growth models based on mortality trends from the Institute for Health Metrics and Evaluation for Mexico and Mexico City in near real-time. Moreover, we estimate reproduction numbers for SARS-CoV-2 based on the methods that rely on genomic data as well as case incidence data. Subsequently, functional data analysis techniques are utilized to analyze the shapes of COVID-19 growth rate curves at the state level to characterize the spatiotemporal transmission patterns of SARS-CoV-2. The early estimates of the reproduction number for Mexico were estimated between Rt ~1.1-1.3 from the genomic and case incidence data. Moreover, the mean estimate of Rt has fluctuated around ~1.0 from late July till end of September 2020. The spatial analysis characterizes the state-level dynamics of COVID-19 into four groups with distinct epidemic trajectories based on epidemic growth rates. Our results show that the sequential mortality forecasts from the GLM and Richards model predict a downward trend in the number of deaths for all thirteen forecast periods for Mexico and Mexico City. However, the sub-epidemic and IHME models perform better predicting a more realistic stable trajectory of COVID-19 mortality trends for the last three forecast periods (09/21-10/21, 09/28-10/27, 09/28-10/27) for Mexico and Mexico City. Our findings indicate that phenomenological models are useful tools for short-term epidemic forecasting albeit forecasts need to be interpreted with caution given the dynamic implementation and lifting of social distancing measures.


Conflict of interest statement

The authors declare no conflict of interest.

Figures

Fig 1
Fig 1. Upper panel: Epidemic curve for the COVID-19 deaths in Mexico and Mexico City from March 20-November 11, 2020.
The blue line depicts the confirmed deaths in Mexico and the green line depicts the confirmed deaths in Mexico City. Lower panel: The mobility trends for Mexico from February 28-December 5, 2020. The orange line shows the driving trend, the blue line shows the transit trend, and the black line shows the walking trend.
Fig 2
Fig 2
Calibration performance for each of the thirteen sequential calibration phases for GLM (magenta), Richards (red), and sub-epidemic (blue) model for Mexico. High 95% PI coverage and lower mean interval score (MIS), root mean square error (RMSE), and mean absolute error (MAE) indicate better performance.
Fig 3
Fig 3
Calibration performance for each of the thirteen sequential calibration phases for GLM (magenta), Richards (red), and sub-epidemic (blue) model for Mexico City. High 95% PI coverage and lower mean interval score (MIS), root mean square error (RMSE) and mean absolute error (MAE) indicate better performance.
Fig 4
Fig 4
Forecasting period performance metrics for each of the thirteen sequential forecasting phases for GLM (magenta), Richards (red) and sub-epidemic (blue) model for Mexico. High 95% PI coverage and lower mean interval score (MIS), root mean square error (RMSE) and mean absolute error (MAE) indicate better performance.
Fig 5
Fig 5
Forecasting period performance metrics for each of the thirteen sequential forecasting phases for GLM (magenta), Richards (red) and sub-epidemic (blue) model for the Mexico City. High 95% PI coverage and lower mean interval score (MIS), root mean square error (RMSE) and mean absolute error (MAE) indicate better performance.
Fig 6
Fig 6. Systematic comparison of six models (GLM, Richards, sub-epidemic model, IHME current projections (IHME C.P), IHME universal masks (IHME U.M) and IHME mandates easing (IHME M.E) to predict the cumulative COVID-19 deaths for Mexico in the thirteen sequential forecasts.
The blue circles represent the mean deaths, and the magenta vertical line indicates the 95% PI around the mean death count. The horizontal dashed line represents the actual death count reported by that date as published in the November 11, 2020, IHME estimates file.
Fig 7
Fig 7. Systematic comparison of six models (GLM, Richards, sub-epidemic model, IHME current projections (IHME C.P), IHME universal masks (IHME U.M) and IHME mandates easing (IHME M.E) to predict the cumulative COVID-19 deaths for the Mexico City in the thirteen sequential forecasts.
The blue circles represent the mean deaths, and the magenta vertical line indicates the 95% PI around the mean death count. The horizontal dashed line represents the actual death count reported by that date as published in the November 11, 2020, IHME estimates file.
Fig 8
Fig 8. Upper panel: Reproduction number with 95% CI estimated using the GGM model.
The estimated reproduction number of the COVID-19 pandemic in Mexico as of May 29, 2020, is 1.1 (95% CI: [1.1, 1.1]). The growth rate parameter, r, is estimated at 1.2 (95% CI: [1.1, 1.4]) and the deceleration of growth parameter, p, is estimated at 0.7 (95% CI: [0.68, 0.71]). Lower panel: The lower panel shows the GGM fit to the case incidence data for the first 90 days.
Fig 9
Fig 9
Upper panel: Epidemiological curve (by the dates of symptom onset) for Mexico (left panel) and Mexico City (right panel) as of September 27, 2020. Lower panel: Instantaneous reproduction number with 95% credible intervals for the COVID-19 pandemic in Mexico as of September 27, 2020. The red solid line represents the mean reproduction number for Mexico and the red shaded area represents the 95% credible interval around it. The blue solid line represents the mean reproduction number for Mexico City and the blue shaded region represents the 95% credible interval around it.
Fig 10
Fig 10. Global ML tree for SARS-CoV-2 genomic data from February 27- May 29, 2020.
Sequences sampled in Mexico are highlighted in red.
Fig 11
Fig 11. Clusters of states by their growth rates.
Cluster 1 in blue, cluster 2 in orange, cluster 3 in yellow, and cluster 4 in purple. The right panel shows the average growth rate curves for each cluster (solid curves) and their overall average (black broken curve).
Fig 12
Fig 12. Color scale image of daily COVID-19 cases by region.

References

    1. Johnson NP, Mueller J. Updating the accounts: global mortality of the 1918–1920 "Spanish" influenza pandemic. Bull Hist Med. 2002;76(1):105–15. Epub 2002/03/05. doi: 10.1353/bhm.2002.0022 . - DOI - PubMed
    1. Fernández-Rojas MA, Luna-Ruiz Esparza MA, Campos-Romero A, Calva-Espinosa DY, Moreno-Camacho JL, Langle-Martínez AP, et al. Epidemiology of COVID-19 in Mexico: Symptomatic profiles and presymptomatic people. Int J Infect Dis 2021;104:572–9. doi: 10.1016/j.ijid.2020.12.086 - DOI - PMC - PubMed
    1. Cascella M, Rajnik M, Cuomo A, Dulebohn SC, Di Napoli R. Features, Evaluation, and Treatment of Coronavirus (COVID-19). StatPearls. Treasure Island (FL): StatPearls Publishing, 2021, StatPearls Publishing LLC.; 2021. . - PubMed
    1. Li Z, Chen Q, Feng L, Rodewald L, Xia Y, Yu H, et al. Active case finding with case management: the key to tackling the COVID-19 pandemic. The Lancet. 2020;396(10243):63–70. doi: 10.1016/S0140-6736(20)31278-2 - DOI - PMC - PubMed
    1. WHO. COVID-19 Weekly Epidemiological Update World Health Organization. 2020 [cited 2020 December 30]. Available from: https://www.who.int/emergencies/diseases/novel-coronavirus-2019/situatio....

Publication types