. 2021 Oct 22;31(12):5411-5434.
doi: 10.1093/cercor/bhab167.

Microstimulation of the Premotor Cortex of the Cat Produces Phase-Dependent Changes in Locomotor Activity

Affiliations

Microstimulation of the Premotor Cortex of the Cat Produces Phase-Dependent Changes in Locomotor Activity

Nicolas Fortier-Lebel et al. Cereb Cortex. .

Abstract

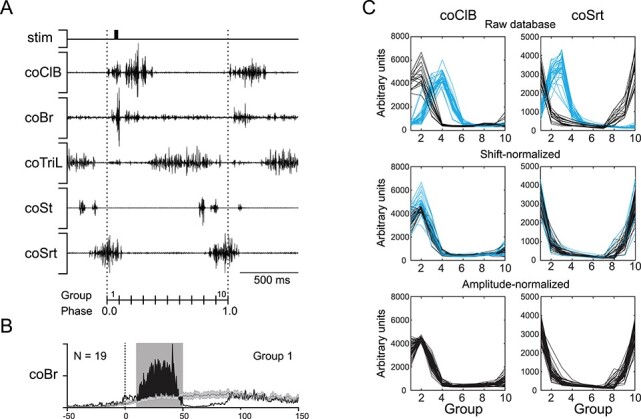
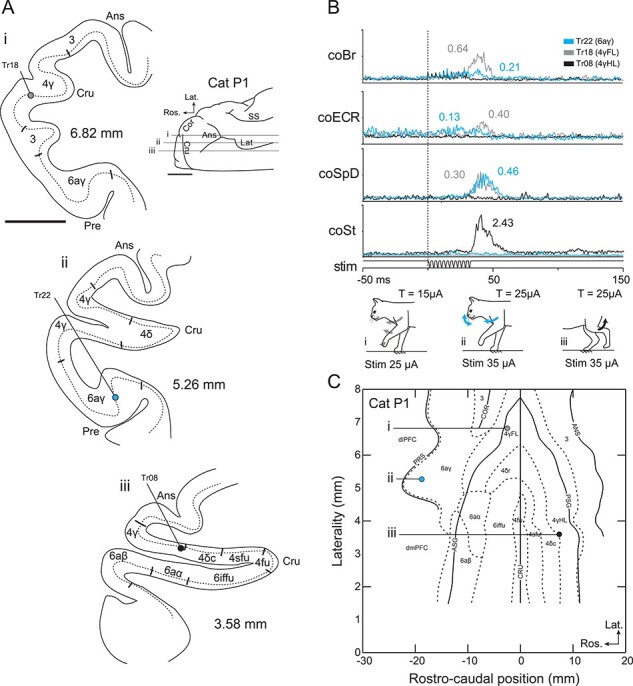
To determine the functional organization of premotor areas in the cat pericruciate cortex we applied intracortical microstimulation (ICMS) within multiple cytoarchitectonically identified subregions of areas 4 and 6 in the awake cat, both at rest and during treadmill walking. ICMS in most premotor areas evoked clear twitch responses in the limbs and/or head at rest. During locomotion, these same areas produced phase-dependent modifications of muscle activity. ICMS in the primary motor cortex (area 4γ) produced large phase-dependent responses, mostly restricted to the contralateral forelimb or hindlimb. Stimulation in premotor areas also produced phase-dependent responses that, in some cases, were as large as those evoked from area 4γ. However, responses from premotor areas had more widespread effects on multiple limbs, including the ipsilateral limbs, than did stimulation in 4γ. During locomotion, responses in both forelimb and hindlimb muscles were evoked from cytoarchitectonic areas 4γ, 4δ, 6aα, and 6aγ. However, the prevalence of effects in a given limb varied from one area to another. The results suggest that premotor areas may contribute to the production, modification, and coordination of activity in the limbs during locomotion and may be particularly pertinent during modifications of gait.

Keywords: cat; intracortical microstimulation; locomotion; premotor cortex.


Figures

Figure 1
Figure 1
Method of EMG averaging and correction. A: Electromyographic (EMG) recording of multiple muscles in a single stimulated step cycle, defined in reference to the onset (vertical dotted lines) of the contralateral Cleidobrachialis (coClB). The step cycle is divided into 10 equal groups based on the average duration of the control step cycles, where the first group encompasses the first tenth of the step cycle (phase 0.0–0.1). Here, stimulation falls in the first group. B: averaged evoked response in the contralateral Brachialis (coBr; black line) to 19 stimuli occurring in group 1 (average phase = 0.04). The average response is displayed together with the averaged activity of 106 unstimulated, control, cycles (gray line ± SE with 95% CI), triggered on the same average phase of the step cycle (i.e., phase 0.04). The filled black area indicates the net response, with the objective window of analysis (in gray) spanning from 10 to 50 ms post-stimulus onset. C: Examples of shift and amplitude normalization. Top: EMG activity of the coClB (left) and sartorius (coSrt, right) from all sites of cat P2, synchronized on either the coClB (black) or coSrt (blue). Middle: Shift-normalized EMG activity, where coSrt-synchronized sites have been circularly shifted by −20% (two groups) of the cat’s standard step cycle. Differences in peak control amplitude remain due to gradual changes in EMG signal across experimental sessions. Sites whose peak control activity are less than 1SD from the reference peak amplitude (see Methods) for the muscle are displayed in black. Outliers are displayed in blue. Bottom: Amplitude normalization is applied: outliers are scaled to the muscle’s reference peak amplitudes. Abbreviations: St, semitendinosus; TriL, lateral head of triceps.
Figure 2
Figure 2
Representative movements evoked by threshold stimulation at rest. A: Drawing of the dorsal surface of the cat brain showing the location of the cruciate sulcus (Cru) and the schematic representation of the penetrations illustrated in B(b) and C(c). B: Tracing of a parasagittal section from cat P2 at a laterality of 3.8 mm from the midline (corresponding to b in Fig. 2A). The section includes several cytoarchitectonic areas including areas 4γ, 4δc, 4sfu, and 4fu in the dorsal bank of the sulcus, together with areas 6iffu, 6aα, and 6aγ in the rostral bank. We illustrate all sites at which ICMS was applied at the same laterality with respect to chamber coordinates (histology showed that all of these tracks crossed layer V at 3.3–3.8 mm from the mid-line). For each stimulation site we illustrate the movement evoked (see color key); the size of the symbol represents the threshold of that response (see key for thresholds). C: Parasagittal section from cat P4 (laterality 5.7 mm, represented by c in Fig. 2A) with all stimuli applied at a laterality of 5.5–5.8 mm. D: schematic pseudo-3D representation of the brain showing the different cytoarchitectonic regions within the cruciate sulcus (adapted from Keizer and Kuypers 1984; Drew 1993). E. The stimulated sites from B are plotted on a flattened map of cat P2. Numbers indicate individual tracks as identified in B. F: data from section illustrated in C plotted on a flattened map of cat P4. Note that the values on the x-axis provide relative distance of stimulation sites rostral (negative values) and caudal (positive values) with respect to the fundus of the cruciate sulcus. Abbreviations: Ans, Ansate; ASG, anterior sigmoid gyrus; Cor, Coronal; Cru, Cruciate; dlPFC, dorsolateral prefrontal cortex; dmPFC, dorsomedial prefrontal cortex; Lat, Lateral; Ros, Rostral; Prs, Presylvian; PSG, posterior sigmoid gyrus; T, threshold; Tr, track. Scale bar (B,C) = 5 mm.
Figure 3
Figure 3
Maps of all responses evoked by threshold stimulation at rest in cats P1–5. Data are plotted on flattened maps as in Figure 2E, F. Each symbol depicts the location of a stimulation site in area 4 or 6, with the type of movement evoked from a given site indicated by a color code (see Key). The size of the markers indicates the movement threshold divided into four categories (see Key). Small open symbols represent sites in which 100 μA stimulation evoked no discernible movement. The white stars and arrows in P1 and P4 indicate the sites used in Figures 7 and 9, respectively. Abbreviations: FL, forelimb; HL, hindlimb; N, number of stimulated sites in each cat.
Figure 4
Figure 4
Thresholds for evoking movements in different cytoarchitectonic areas. Individual threshold values for each responsive stimulation site are displayed as single, semi-opaque markers. The intensity of the shading is proportional to the number of sites with a given threshold (see key). Data from P1, 2, 4, and 5 are separated in four columns, respectively, from left to right. A superimposed boxplot depicts the median (red line), 25th and 75th percentiles (boxes), and extremes (whiskers) excluding outliers. The dashed black line at 35 μA threshold indicates the empirical upper limit of normal response thresholds in area 4γ that we have used in previous publications (Drew 1993; Widajewicz et al. 1994).
Figure 5
Figure 5
Cortical regions producing different movements. The data illustrated in Figure 3 have been morphed onto a standard flattened map based on the cortex of cat P1 (see Methods and Suppl. Fig. 1 for morphing technique). A: responses evoked from all 519 sites stimulated in all four cats using the same color code as in Figure 3. B–F illustrate the cortical regions from which stimulation evoked different types of movement (see also figurines in bottom left of each panel). The values in the top right indicate the number of sites in each map. Numbers in parentheses indicate the change in representation at 1.5–2 T with respect to T. For example, 22 additional sites (open circles) produced forelimb and hindlimb movements at 1.5–2 T compared with T (D) and there were 14 fewer exclusive forelimb sites at 1.5–2 T (B).
Figure 6
Figure 6
Summary of movement representation: Bar plots illustrating the number (left axis) and relative proportion (right axis) of movements evoked by stimulation at 1.5–2 T in different subdivisions of areas 4 and 6 with the cat at rest. For each area, the number of occurrences of a specific movement, pooled across all animals, is displayed above that movement’s bar. Abbreviations: F/H, face or head; FL, forelimb; F/H, forelimb with face or head; FL, HL forelimb and hindlimb; NE, no effect.
Figure 7
Figure 7
Representative EMG responses evoked from areas 4γ and 6aγ. A.  Left: Parasagittal sections of the cortex showing three representative stimulation sites. The different cytoarchitectonic subdivisions of areas 4 and 6 as well as the different sulci, are illustrated. The dotted line indicates cortical layer V. Right: Dorsal view of the cat’s right cortex, with the lateralities of the illustrated sections (the presylvian sulcus is not clear on this dorsal view). B. EMG responses evoked in selected muscles by stimulation of the three sites shown in A. The different colors identify the three sites as illustrated by the key and by the figurines (bottom). The values beside each trace indicate the magnitude of the response as a ratio with respect to the peak control activity of the muscle during locomotion (see Methods). C. Map of the flattened cortex showing the position of stimulation sites relative to the sulci, gyri, and cytoarchitectonic borders. Muscle Abbreviations: ECR, extensor carpi radialis; SpD, spinodeltoideus. Scale bars in A = 5 mm.
Figure 8
Figure 8
Spatial representation of EMG responses recorded in the subdivisions of areas 4 and 6 upon stimulation at rest. A: The EMG responses evoked in coBr and coSt from all four cats are morphed onto a single flattened representation of the brain. The filled symbols indicate increased activity: only changes that differed by more than 25% from control (ratio of 0.25) are illustrated. The gray symbols indicate no response (ratio <0.25). The size of the circle is proportionate to the magnitude of the response (see key). B: For each cytoarchitectonic area, we present the percentage of sites that produced a response (>0.25) in each muscle that we recorded. The frequency with which a response in a given muscle was evoked is expressed as a percentage of all sites that were stimulated in a given area, including those that were nonresponsive at 100 μA. Muscle abbreviations: AcT, acromiotrapezius; i, ipsilateral; Srt, sartorius, anterior head; SSp, supraspinatus; VL, vastus lateralis.
Figure 9
Figure 9
Phase-dependent responses in representative 4γFL (black lines) and 6aα (cyan lines) sites during locomotion. A. Responses evoked in selected muscles of the contralateral and ipsilateral fore- and hindlimbs of cat P4 during swing (Group 2) and early stance (Group 5). Responses to stimulation (thick lines) are superimposed onto the control activity (thin lines: see Methods). Note that in some traces the evoked responses are sufficiently large that the control activity is close to zero and the thin lines are not distinguishable. B. the upper traces for each muscle illustrates the activity of the muscle during baseline locomotion in each site (note the near-perfect overlap). The lower trace illustrates the responses evoked in each of the 10 different groups into which the step cycle was divided. For each group, we plot the magnitude of the net evoked response, together with the standard error of the mean, as a ratio of the averaged peak activity observed during control locomotion in each group. The two dotted lines are placed at the ratio of ±0.25 that we used to indicate a meaningful response, i.e., one in which the integrated activity of the response exceeded that of the control by 25% (see Methods). All traces that exceeded the 0.25 limits were significant at the P < 0.05 level. All data are displayed synchronized to the time of onset of the activity in the coClB (swing onset in the forelimb). Abbreviations: FL, forelimb; HL, hindlimb.
Figure 10
Figure 10
Magnitude of selected forelimb and hindlimb flexor responses to ICMS across areas during locomotion. A. Superimposed responses to stimulation of different regions of areas 4 and 6. For each area, the phase-dependent responses evoked in the coBr and coSt from all stimulated sites is displayed. The magnitude of all responses is scaled as a ratio of the averaged peak activity observed during control locomotion (unstimulated step cycles) in each animal (see Methods). The colored traces indicate responses in which there was a significant change in activity, ≥0.25 of background control; gray traces indicate those with no significant change or changes <0.25. B. The responses are plotted on flattened representations of the cortex with the size of the circle proportional to the maximal response during locomotion (see key): same scale used as for Figure 8A. Then filled colored circles indicate sites evoking increased activity; open circles indicate decreases in activity and gray circles indicate responses that did not surpass a ratio of 0.25 of the peak control activity. Note that not all sites stimulated at rest were stimulated during locomotion; this is particularly true for sites in which no detectable responses were observed at 75–100 μA to stimulation at rest (e.g., many sites in 6iffu).
Figure 11
Figure 11
Magnitude of the responses evoked by ICMS during locomotion. A: Averaged EMG responses of representative muscles to ICMS in different areas. Averages are compiled from the phase dependent responses for all sites in which there was a change of ≥0.25 of the control values. Color code identifies each area (see key). B. Bar plots quantifying the average of the maximum response for the muscles illustrated in A. Bars indicate standard error and the values above each bar indicate the phase of the step cycle at which peak activity was observed for each muscle.
Figure 12
Figure 12
Frequency of responses evoked by ICMS during locomotion. A: Bar graph indicating the proportion of sites that evoked responses of ≥0.25 in the indicated muscles. Values are displayed as a percentage of the number of EMG recordings for each muscle. B: a similar plot but including only those recordings in which the magnitude of the response was ≥0.75 of the control activity. Same color key as in Figure 8B.
Figure 13
Figure 13
Location of corticospinal cells projecting to the hindlimb. Two examples of the cortical regions containing cells projecting to the lumbar spinal cord. Flattened representations are prepared as in Figures 2 and 3. The plots show the relative density of cells in different regions according to the key on the figure. Cytoarchitectonic regions from cat P1 have been morphed onto cats A31 and N7 based on the coordinates of the sulci and gyri in each cat.

Similar articles

Cited by

References

    1. Amos A, Armstrong DM, Marple-Horvat DE. 1990. Changes in the discharge patterns of motor cortical neurones associated with volitional changes in stepping in the cat. Neurosci Lett. 109:107–112. - PubMed
    1. Andujar J-E, Drew T. 2007. Organization of the projections from the posterior parietal cortex to the rostral and caudal motor cortex of the cat. J Comp Neurol. 504:17–41. - PubMed
    1. Andujar J-E, Lajoie K, Drew T. 2010. A contribution of area 5 of the posterior parietal cortex to the planning of visually guided locomotion: limb-specific and limb-independent effects. J Neurophysiol. 103:986–1006. - PubMed
    1. Archibald, F. 2020. Warping using thin plate spines. MATLAB Central File Exchange. https://www.mathworks.com/matlabcentral/fileexchange/24315-warping-using... (last accessed 16 June 2020).
    1. Armstrong DM, Drew T. 1984a. Locomotor-related neuronal discharges in cat motor cortex compared with peripheral receptive fields and evoked movements. J Physiol. 346:497–517. - PMC - PubMed

Publication types