. 2021 Nov 1;6(6):1452-1462.
doi: 10.1093/jalm/jfab086.

Comparison of 6 SARS-CoV-2 Molecular Methods and Correlation With the Cycle Threshold Distribution in Clinical Specimens

Affiliations

Comparison of 6 SARS-CoV-2 Molecular Methods and Correlation With the Cycle Threshold Distribution in Clinical Specimens

Saravanan Raju et al. J Appl Lab Med. .

Abstract

Background: The detection of severe acute respiratory syndrome coronavirus 2 (SARS-CoV-2) in patient samples is of critical importance in the management of patients and monitoring transmission in the population. However, data on the analytical performance characteristics for detection of SARS-CoV-2 in clinical specimens between individual targets within the same platform, and among different analytical platforms, are limited.

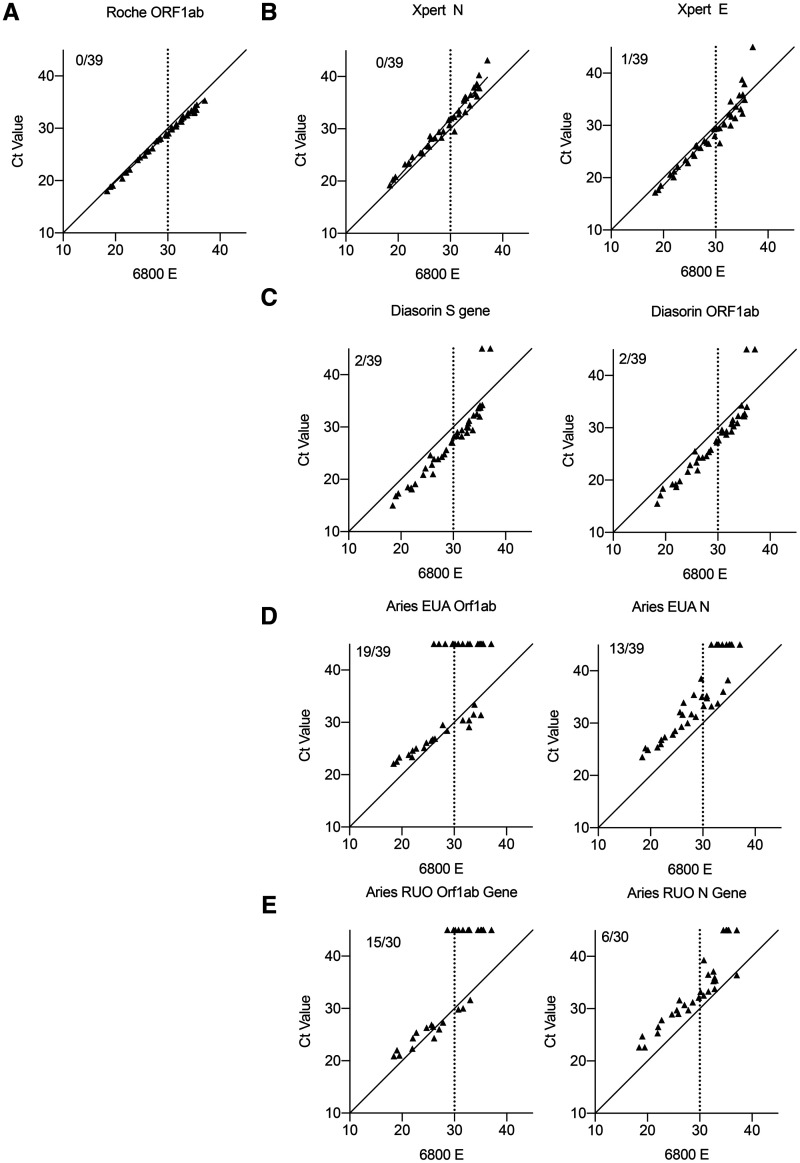
Methods: Here we evaluated the performance of 6 different sample-to-answer SARS-CoV-2 detection methods-Roche cobas 6800, Cepheid GeneXpert, Diasorin Simplexa, Luminex Aries emergency use authorization (EUA), Luminex Aries research use only (RUO), and bioMérieux BioFire-in clinical specimens with a range of viral loads.

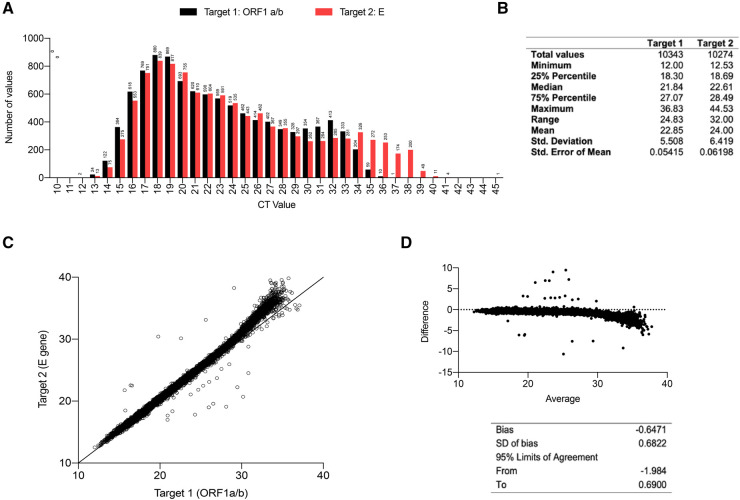
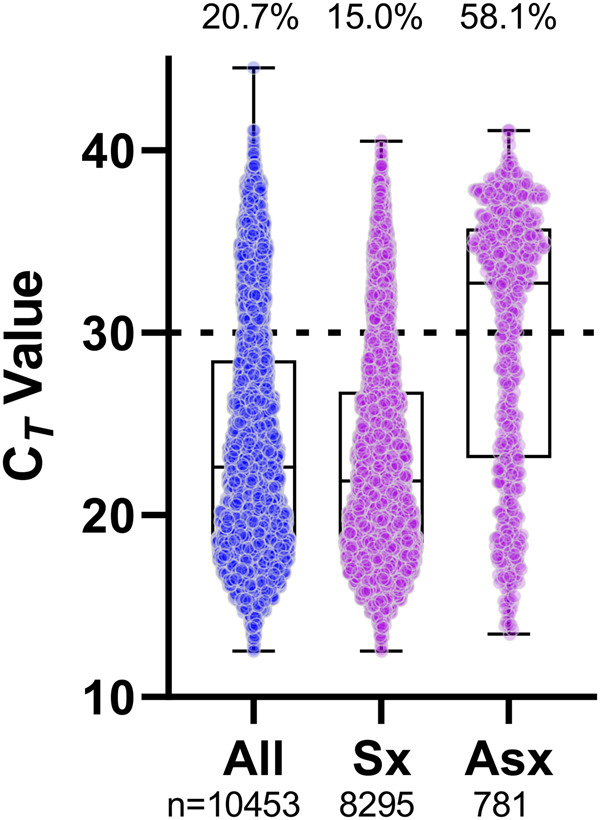
Results: The positive percentage agreement between the Roche cobas 6800 and GeneXpert was 100%, Diasorin 95%, Aries EUA 74%, Aries RUO 83%, and BioFire 97%. Notably, in samples with cycle threshold (Ct) values below 30 for the E gene on the Roche cobas 6800 platform, we found 100% positive agreement among all platforms. Given these results, we examined the distribution of over 10 000 Ct values of all positive specimens from individuals at our institution on the Roche cobas platform. Nearly 60% of specimens from asymptomatic individuals had a PCR Ct value >30 as measured using the cobas 6800 assay E gene.

Conclusions: Our results demonstrate performance characteristics between different platforms by Ct value and provide data regarding the distribution of viral RNA present in positive specimens.

Keywords: COVID -19; PCR; SARS-CoV-2; diagnostics.


Figures

Fig. 1
Fig. 1
Analysis of SARS-CoV-2 positive NP specimens processed on the Roche cobas 6800. (A) Ct values for Target 1 (orf1a/b, black) and Target 2 (E, red) in all positive specimens processed on the Roche cobas 6800. Numbers above bars indicate number of positive specimens. (B) Table showing distribution of Ct values for positive samples processed on Roche cobas 6800. (C) Plot of Target 1 (orf1a/b) and Target 2 (E gene) in all positive samples processed on the Roche Cobas 6800. Each point reflects a Ct values generated for an individual patient. (D) Bland-Altman analysis of paired Target 1 and Target 2 Ct values.
Fig. 2
Fig. 2
Correlation of Ct values between 5 different platforms on the same clinical specimens by Roche cobas 6800 E gene. (A) Graph showing the correlation of Ct value by Roche cobas 6800 E gene and orf1a/b. Inset reflects number of samples that were not detected by orf1a/b. Graph showing the correlation of Ct value by Roche cobas 6800 E gene and indicated target on Cepheid GeneXpert (B), Diasorin Simplexa (C), Aries EUA (D), and Aries RUO (E). Inset reflects number of samples that were not detected by the given target.
Fig. 3
Fig. 3
Distribution of SARS-CoV-2 E gene Ct values from positive NP specimens grouped by symptom status and detected on the Roche cobas 6800. All data points are shown in the first column and subsequently grouped by symptom status, if indicated on the order. The number of specimens is shown under the column. The percentage of specimens with Ct values greater than 30 (dashed line) is shown at the top of the column. Standard box and whisker plots show the median and interquartile range (box) and full range (whiskers) of data. Sx, symptomatic; Asx, asymptomatic.

Similar articles

Cited by

References

    1. Andersen KG, Rambaut A, Lipkin WI, Holmes EC, Garry RF.. The proximal origin of SARS-CoV-2. Nat Med 2020;26:450–2. - PMC - PubMed
    1. Long Q-X, Tang X-J, Shi Q-L, Li Q, Deng H-J, Yuan J, et al. Clinical and immunological assessment of asymptomatic SARS-CoV-2 infections. Nat Med 2020;26:1200–4. - PubMed
    1. Furukawa NW, Brooks JT, Sobel J.. Evidence supporting transmission of severe acute respiratory syndrome coronavirus 2 while presymptomatic or asymptomatic. Emerg Infect Dis 2020;26. Available from: 10.3201/eid2607.201595 (Accessed April 2021). - DOI - PMC - PubMed
    1. Westblade LF, Brar G, Pinheiro LC, Paidoussis D, Rajan M, Martin P, et al. SARS-CoV-2 viral load predicts mortality in patients with and without cancer who are hospitalized with COVID-19. Cancer Cell 2020;38:661–671.e2. - PMC - PubMed
    1. Magleby R, Westblade LF, Trzebucki A, Simon MS, Rajan M, Park J, et al. Impact of SARS-CoV-2 viral load on risk of intubation and mortality among hospitalized patients with coronavirus disease. Clin Infect Dis [Epub ahead of print 2020. Jun 30] as 10.1093/cid/ciaa851. - DOI - PMC - PubMed