

Review
doi: 10.1259/bjr.20210283.
Epub 2021 Jul 21.
MRI findings in-between leiomyoma and leiomyosarcoma: a Rad-Path correlation of degenerated leiomyomas and variants
Affiliations
- PMID: 34289327
- PMCID: PMC9327769
- DOI: 10.1259/bjr.20210283
Item in Clipboard
Review
MRI findings in-between leiomyoma and leiomyosarcoma: a Rad-Path correlation of degenerated leiomyomas and variants
Br J Radiol.
.
Abstract
Leiomyomas are the most common benign tumors of the uterus. On the opposite side, leiomyosarcomas are rare malignant uterine tumors that account for a significant proportion of uterine cancer deaths. Especially when large and degenerated, leiomyomas and leiomyoma variants can have overlapping imaging characteristics with those of leiomyosarcomas. Although not always possible, it is paramount to be able to differentiate between leiomyomas and leiomyosarcomas on imaging, as the therapeutic management can differ. This pictorial review aims to familiarize radiologists with imaging features of leiomyomas and various types of leiomyoma degeneration and variants, together with their pathology correlates.
Figures
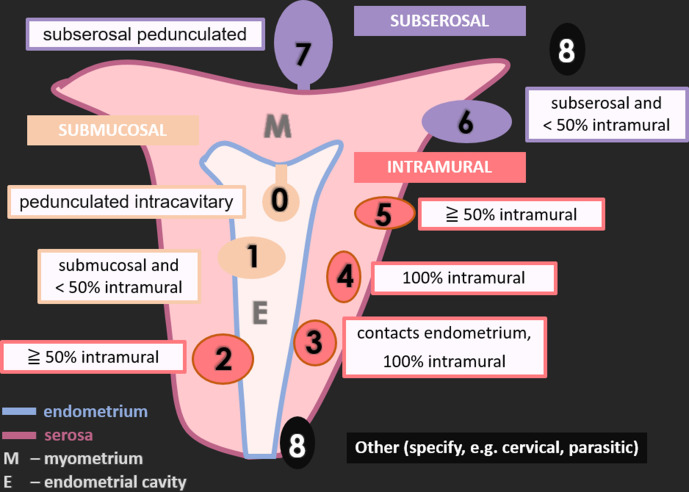
Schematic representation of uterine leiomyomas according to FIGO classification. FIGO 0: pedunculated intracavitary (submucosal); FIGO 1: submucosal and <50% intramural; FIGO 2: ≧ 50% intramural; FIGO 3: contacts endometrium, 100% intramural; FIGO 4: 100% intramural; FIGO 5: subserosal ≧ 50% intramural; FIGO 6: subserosal <50% intramural; FIGO 7: subserosal pedunculated; FIGO 8: other (specify e.g., cervical, parasitic).
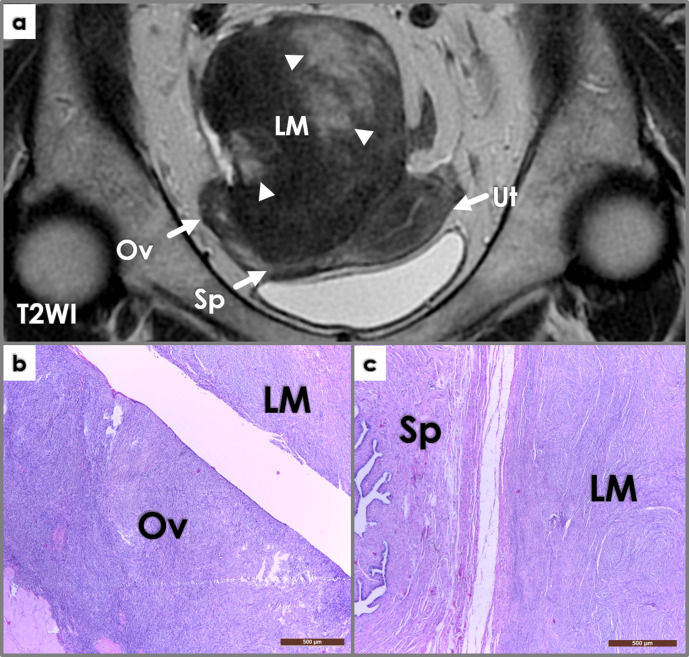
Coronal T2WI image (a) shows a large intrapelvic mass (LM), in close contact to the right adnexa (Ov – ovary, Sp – salpinx) and posterior wall of the uterus (Ut). The mass is mostly solid (iso/hypointense signal intensity compared to muscle on T2WI), but also contains cystic areas (hyperintense signal intensity on T2WI, arrowheads). Macroscopic examination during surgery reveals close attachment of the mass to the right ovary and salpinx; the mass was connected to the ovary through a thin pedicle. Photomicrographs (b, c, H&E stain, 4x) show whorled interlacing fascicles of typical smooth muscle cells, with no atypia and no coagulative tumor necrosis – findings consistent with a parasitic leiomyoma (LM) histology – closely located near the right ovary (Ov, left image) and salpinx (Sp, right image).
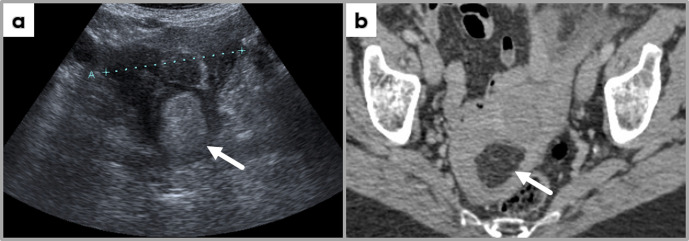
Trans-abdominal ultrasound image (a) and contrast-enhanced axial CT image at the level of uterus, showing a uterine fundus mass hyperechogenic on ultrasound; the mass demonstrates fat-specific HU values, most likely representing a uterine lipoleiomyoma (incidental finding at CT examination performed for another clinical indication, followed by US assessment of the pelvis).
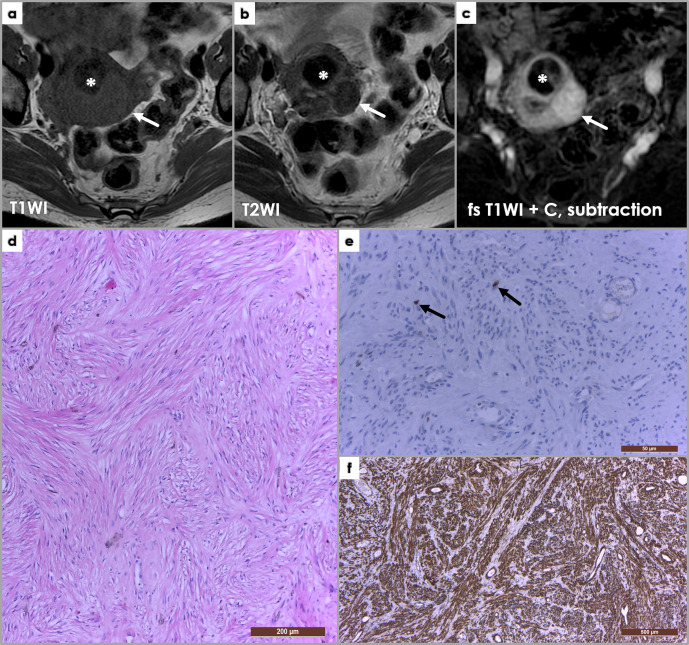
Axial T1WI (a), T2WI (b) and subtraction fat-saturated post-contrast MRI images, depicting an ordinary non-degenerated leiomyoma (arrows) isointense signal intensity on T1WI (a), hypointense on T2WI (b) and enhancing post-contrast administration. Asterisk (*) depicts a hyalinized leiomyoma, which shows hypointense signal intensity on both T1WI and T2WI, and no or little enhancement on post-contrast sequences. (d) Photomicrograph of a uterine leiomyoma histology, presenting a whorled (fascicular) pattern of smooth muscle bundles – spindled cells with eosinophilic cytoplasm – separated by well-vascularized connective tissue (H&E staining, x100). Immunohistochemistry in leiomyomas: (e) Ki-67 staining (x400), (f) SMA (smooth muscle actin) stain (x40). Ki-67 is a marker of cell proliferation (nuclear stain, cytoplasmic staining is disregarded), and is negative in leiomyomas (Ki-67 positivity <1%) – only two nuclei positive for Ki-67 shown (arrows, (e); diffuse SMA positivity (f) of the spindle-shaped cells.
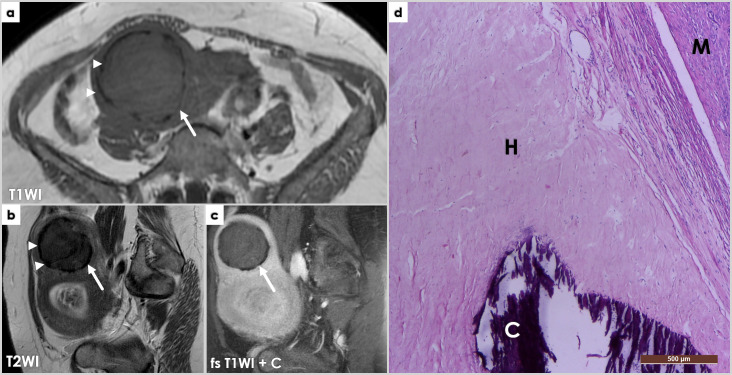
Axial T1WI (a) and sagittal T2WI (b) and fat-saturated post-contrast T1WI (c) showing two large uterine masses, one located superiorly (arrows), at the uterine fundus, showing hypointense signal intensity on both T1- (a) and T2-WI (b), with a discontinuous, markedly hypointense peripheral rim (arrowheads, (a, b), and no contrast enhancement (c). Off note, the partially captured lower anterior uterine mass was also a leiomyoma with hyaline degeneration and hyaline necrosis, hence the high signal intensity T2WI areas (b) partially captured on these images. (d) Completely degenerated hyaline leiomyoma, with peripheral calcifications: microscopy image (H&E stain, (x40). The hyaline (H) manifests as homogeneously red pink substances replacing the preexisting bundles of long smooth muscle cells. Calcified nodules (C) are easily identified on H&E stain, by intense uniform basophilic deposits in a dense collagenous stroma (right lower image) – corresponding to the peripheral areas of low T1-/T2-WI signal intensity on MRI (previous image). M – normal myometrium.
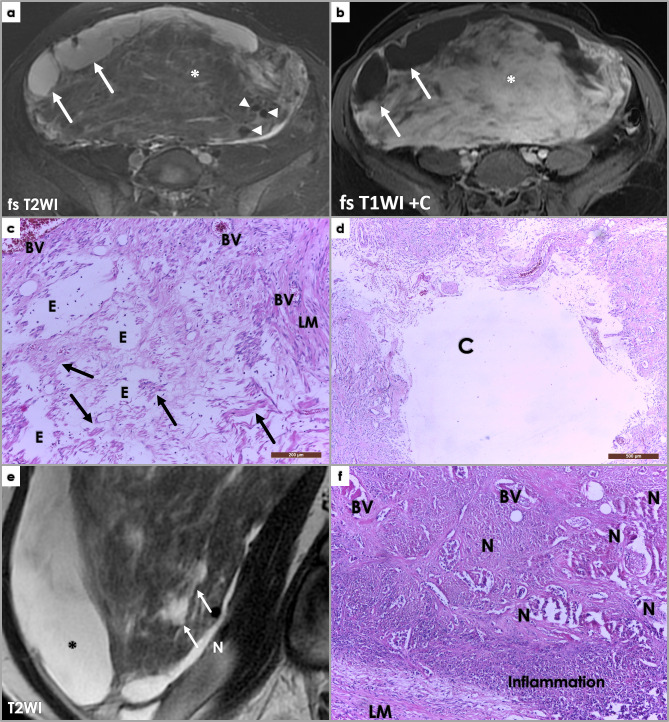
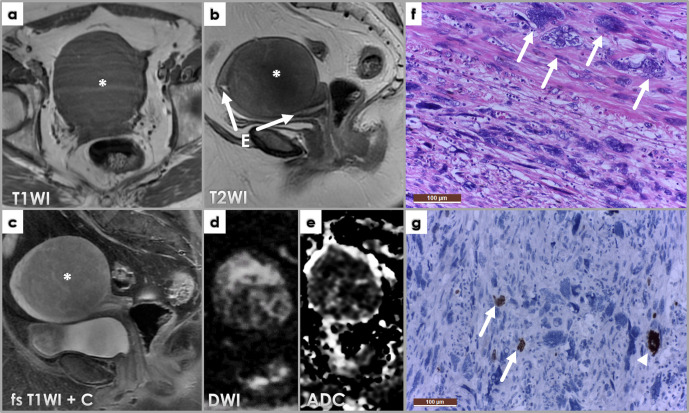
Large subserosal uterine tumor proving to be a leiomyoma with cystic degeneration and ischemic necrosis at pathology examination. Axial fat-saturated (fs) T2WI (a) and post-contrast T1WI (b) MR images showing large heterogeneous intra-abdominal mass, with solid and cystic components. The cystic components (arrows) show hyperintense signal intensity on fs T2WI (a), and no contrast enhancement on post-contrast imaging (b). The solid component (*) shows mostly isointense to muscle signal intensity on both T1WI (not shown)and T2WI (a) Areas of high T2WI signal intensity scattered between the isointense leiomyoma portions reflect edema (asterisk, (a), and contrary to the cystic components, these area are avidly enhancing post Gadolinium administration (b). Note signal void on the T2 image, corresponding to large feeding vessels of the leiomyoma (arrowheads, (a). Photomicrograph showing edema (E) (H&E stain, 100x). Scattered spindle-shaped smooth muscle cells (arrow) on a background of extensive hypocellular areas consistent with an edematous fibroma. LM – leiomyoma histology. BV – blood vessels. Photomicrograph (d) of previously described uterine leiomyoma showing a cystic areas (C) (H&E stain, 40x). At gross pathology, a 3.5/4 cm necrotic area was described, and we tried to retrospectively link it to imaging features of necrosis (although imaging cannot reliably differentiate among different types of necrosis) – arrow, T2 hyperintense area, not so well defined as the cystic components (*) – differential for this would include edema. Photomicrograph (f) showing areas of extensive necrosis (H&E stain, 100x). The area was recently affected and completely necrotic; reactive inflammatory response visible in the periphery of the necrotic area (role: cellular debris disintegration). No cytologic atypia is noted in the residual leiomyoma tissue (LM).
Axial fat-saturated T1WI (a) and T2WI (b), sagittal T2WI (c), axial DWI (d), ADCmap (e) and fat-saturated post-contrast T1WI (f) images showing a large intramural leiomyoma within the anterior uterine body. The mass is showing uniform high T1WI signal intensity and low T2WI, suggestive of red degeneration of the fibroid. Low DWI signal intensity and low ADC values depict the so-called T2-blackout effect – explained by extremely low T2WI signal intensity due to the paramagnetic effects of intracellular deoxyhemoglobin described with subacute hematomas. No enhancement is depicted on post-contrast imaging.
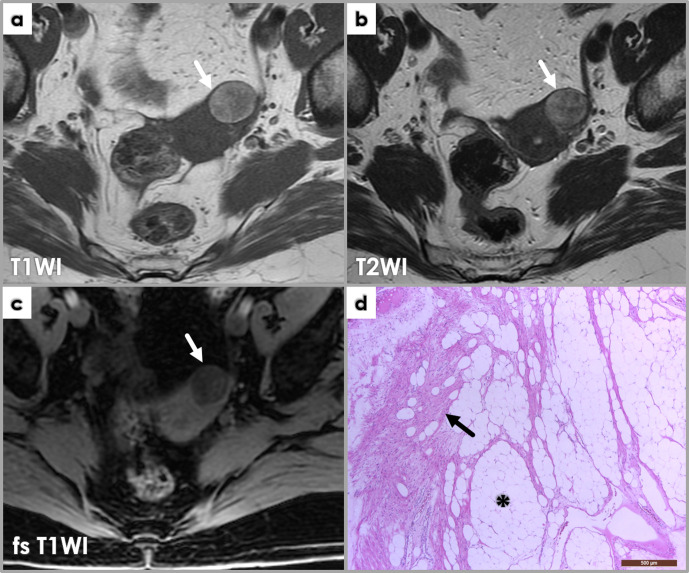
Axial MRI images (a, b, c) demonstrate a well-defined lesion (arrows) arising from the left uterine fundus which is of high T1WI (a) and high T2WI (b) signal intensities. There is loss of signal on the fat-saturated T1WI sequence (c) equal to that of subcutaneous fat, consistent with a subserosal lipoleiomyoma. Photomicrograph (d) of lipoleiomyoma corresponding to fatty areas described at imaging, displaying a mix of smooth muscle cells (arrow) and adipocytes (*).
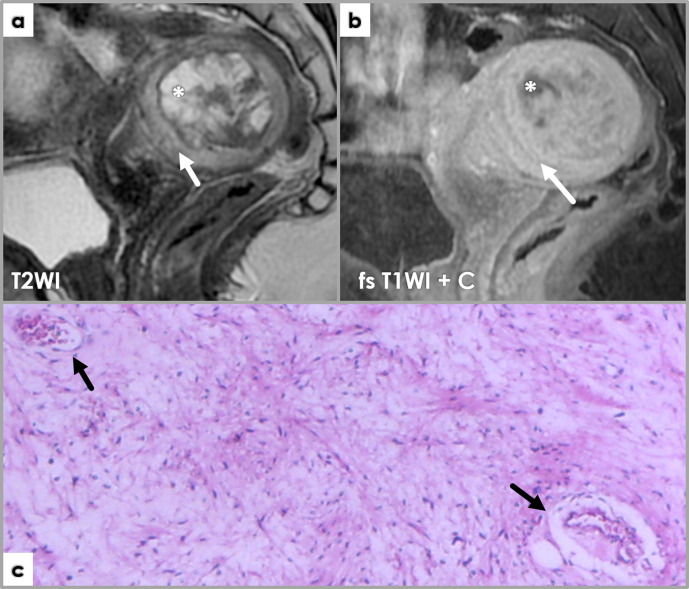
Sagittal T2WI (a) and fat-saturated post-contrast T1WI (b) showing a degenerated myxoid (arrows) and cystic (*) leiomyoma. Myxoid peripheral areas (arrows) are T2WI hyperintense (a), and exhibit characteristic laminated contrast enhancement on fs T1WI + C (b). Pathology image (c) shows myxoid degeneration area within a leiomyoma: abundant pink-bluish myxoid connective tissues (containing large vessels, arrows) between islands of elongated spindle smooth muscle cells (Sm) with fibrillary acidophilic cytoplasm and elongated nuclei with fusiform or blunt ends. Atypia is absent or at most mild, and mitotic count should be no more than two mitoses/10 HPF. Scattered lymphocytes can be noted throughout.
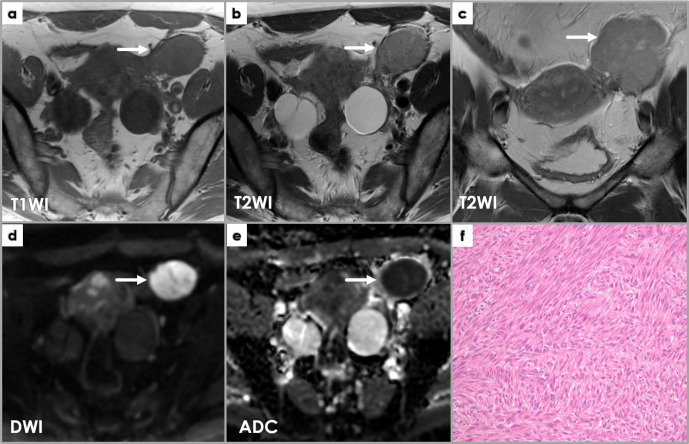
Axial T1WI (a) and T2WI (b), coronal T2WI (c), axial DWI (d) and ADCmap (e) show a well-defined mass (arrows) near the left of but completely separated from the uterine body, exhibiting intermediateT2WI signal intensity (a, b) and low T1WI signal intensity (c), as well as restricted diffusion (high DWI signal intensity and low ADC values). Intraoperatively, it was found to belong to the left round ligament of the uterus. Pathology microscopy (H&E stain) image (f) shows features of a cellular leiomyoma: hyper-cellularity with few mitoses (less than 4/10 HPF); small spindle cells with fusiform or round vesicular nuclei with no nuclear atypia or tumor cell necrosis.
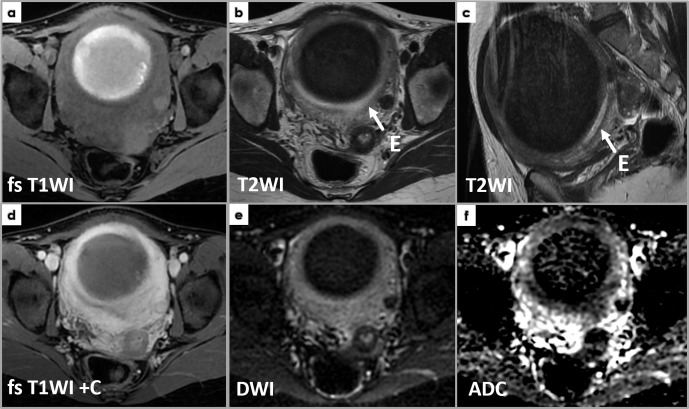
Axial T1WI (a), sagittal T2WI (b), sagittal fat-saturated post-contrast T1WI (c), axial DWI (d) and ADCmap (c) of an intramyometrial large mass (*), compressing the endometrium anteriorly (arrows on T2WI, E – endometrium, high T2WI signal), well delineated, showing low T1WI and T2WI intensity – isointense to normal myometrium, with diffuse and heterogeneous enhancement (e). Focal areas showing diffusion restriction (high DWI signal) with ADC values as low as 0.5 × 10⁻³ mm2/s. (f) Photomicrograph (H&E stain, 10x) showing a symplastic leiomyoma, containing bizarre multinucleated smooth muscle cells (arrows) with moderate-to-severe atypia, but less than 10 mitotic figures/10 HPF and no tumor cell necrosis. Photomicrograph (g) (Ki-67 staining, 10x) showing a Ki-67 index of 1% – only one nucleus positive for Ki-67 (arrowhead), cytoplasmic staining being disregarded (arrows).
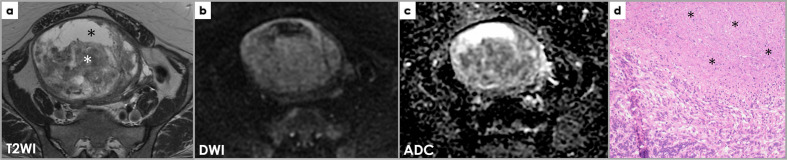
Axial T2WI (a), DWI (b) and ADC map (c) images demonstrate a large heterogeneous subserosal uterine mass with areas of high signal intensities which are low on T1WI (not shown), consistent with fluid, indicating cystic change (black *). The solid component of the mass (white *) does not show restricted diffusion) and there are no other suspicious features for malignancy; it was interpreted by the radiologist as most likely a leiomyoma with cystic degeneration. However, the patient underwent hysterectomy due to the large size of the mass and the pathology was that of a STUMP. Photomicrograph (d) of a smooth muscle tumor with tumor cell necrosis (*), but no significant cytological atypia or mitotic activity. Despite the bland cytological features and absence of significant mitotic activity, the findings are in keeping with a smooth muscle tumor of uncertain malignant potential (STUMP), in view of the presence of tumor cell necrosis.
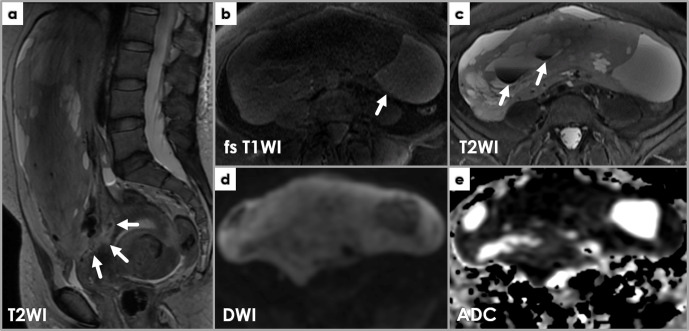
MRI showing imaging features suspicious for leiomyosarcoma. Sagittal T2WI (a) showing a large, heterogeneous mass with irregular borders (arrows) approaching the endometrium. Axial T1WI (b) and T2WI (c) depict internal high T1WI SI areas (b, arrow) and low T2WI SI areas (c, arrows). Restricted diffusion is noted throughout the mass on DWI (d) and ADC (e) images.
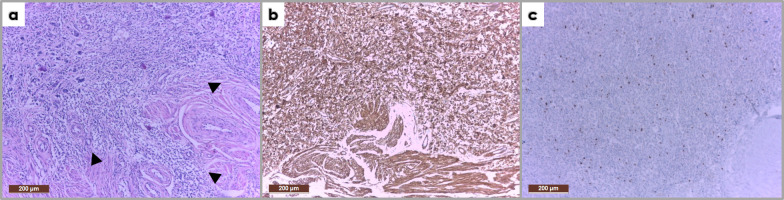
Photomicrograph (H&E stain, 10x) of the mass described within Figure 13 showing marked pleomorphism with hypercellular areas; medium-sized cells, others with fusiform aspect, with large, rounded and oval nuclei (a). The tumor infiltrates and extends beyond the myometrium (arrowheads). Immunohistochemistry (IHC) shows positive SMA staining (b) and a high Ki-67 proliferation index (c). The described histological features together with the IHC profile correspond to a uterine leiomyosarcoma.
References
Publication types
MeSH terms
LinkOut - more resources
Full Text Sources
Medical
