. 2021 Jul 20;36(3):109393.
doi: 10.1016/j.celrep.2021.109393.

Modeling alcohol-associated liver disease in a human Liver-Chip

Affiliations

Modeling alcohol-associated liver disease in a human Liver-Chip

Janna C Nawroth et al. Cell Rep. .

Abstract

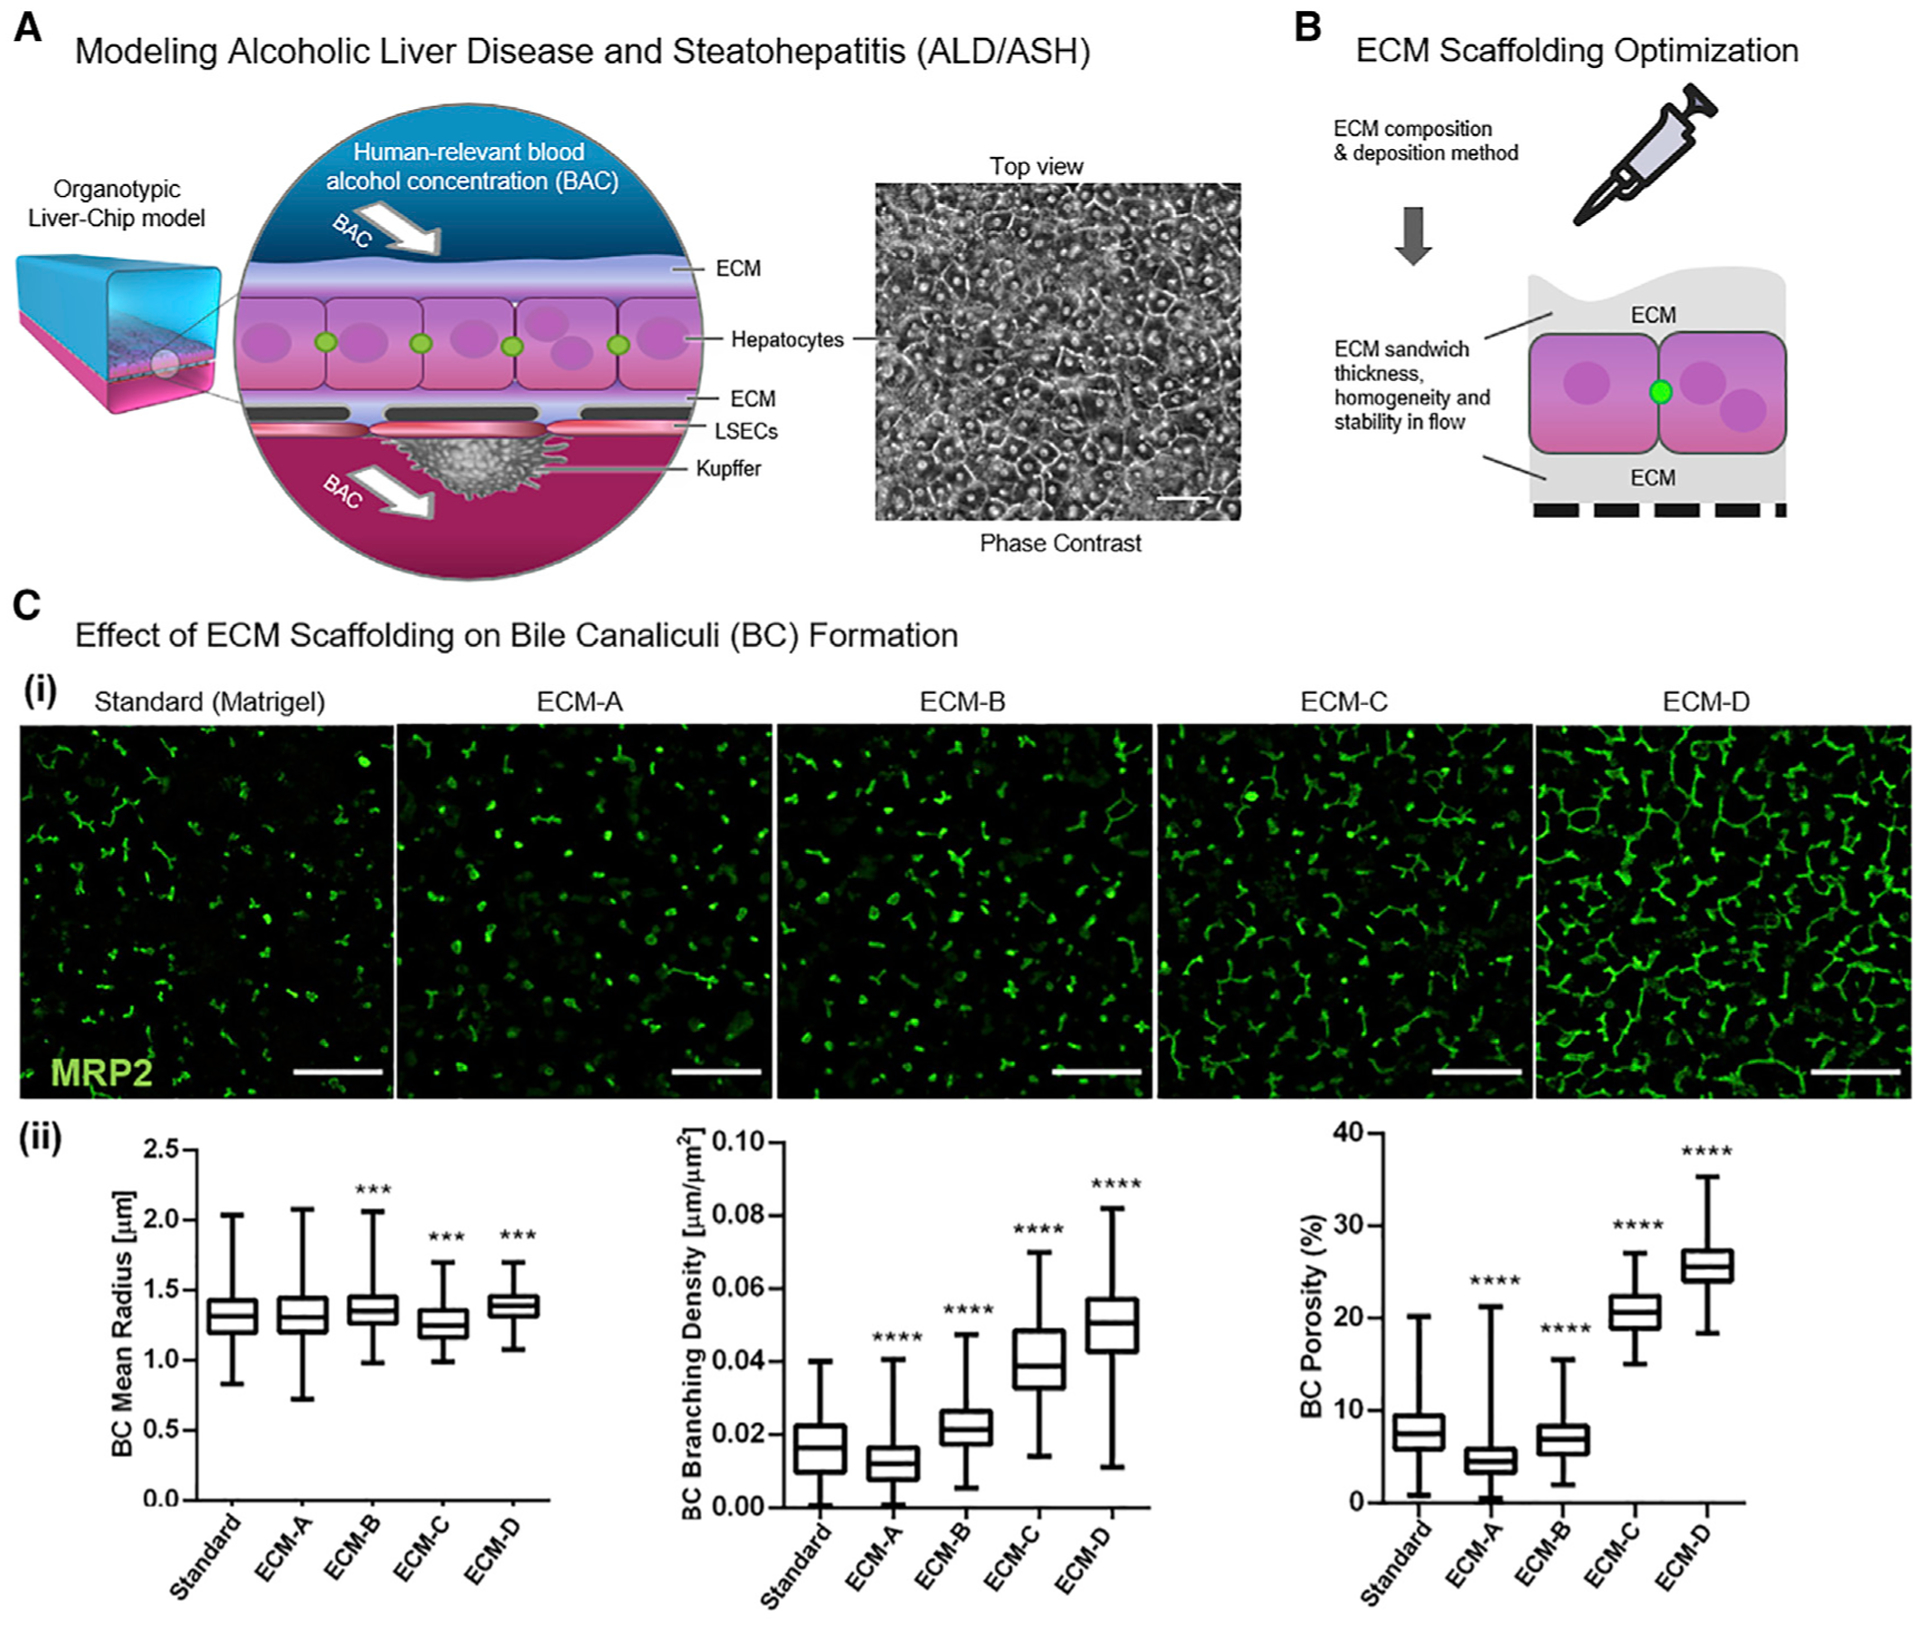
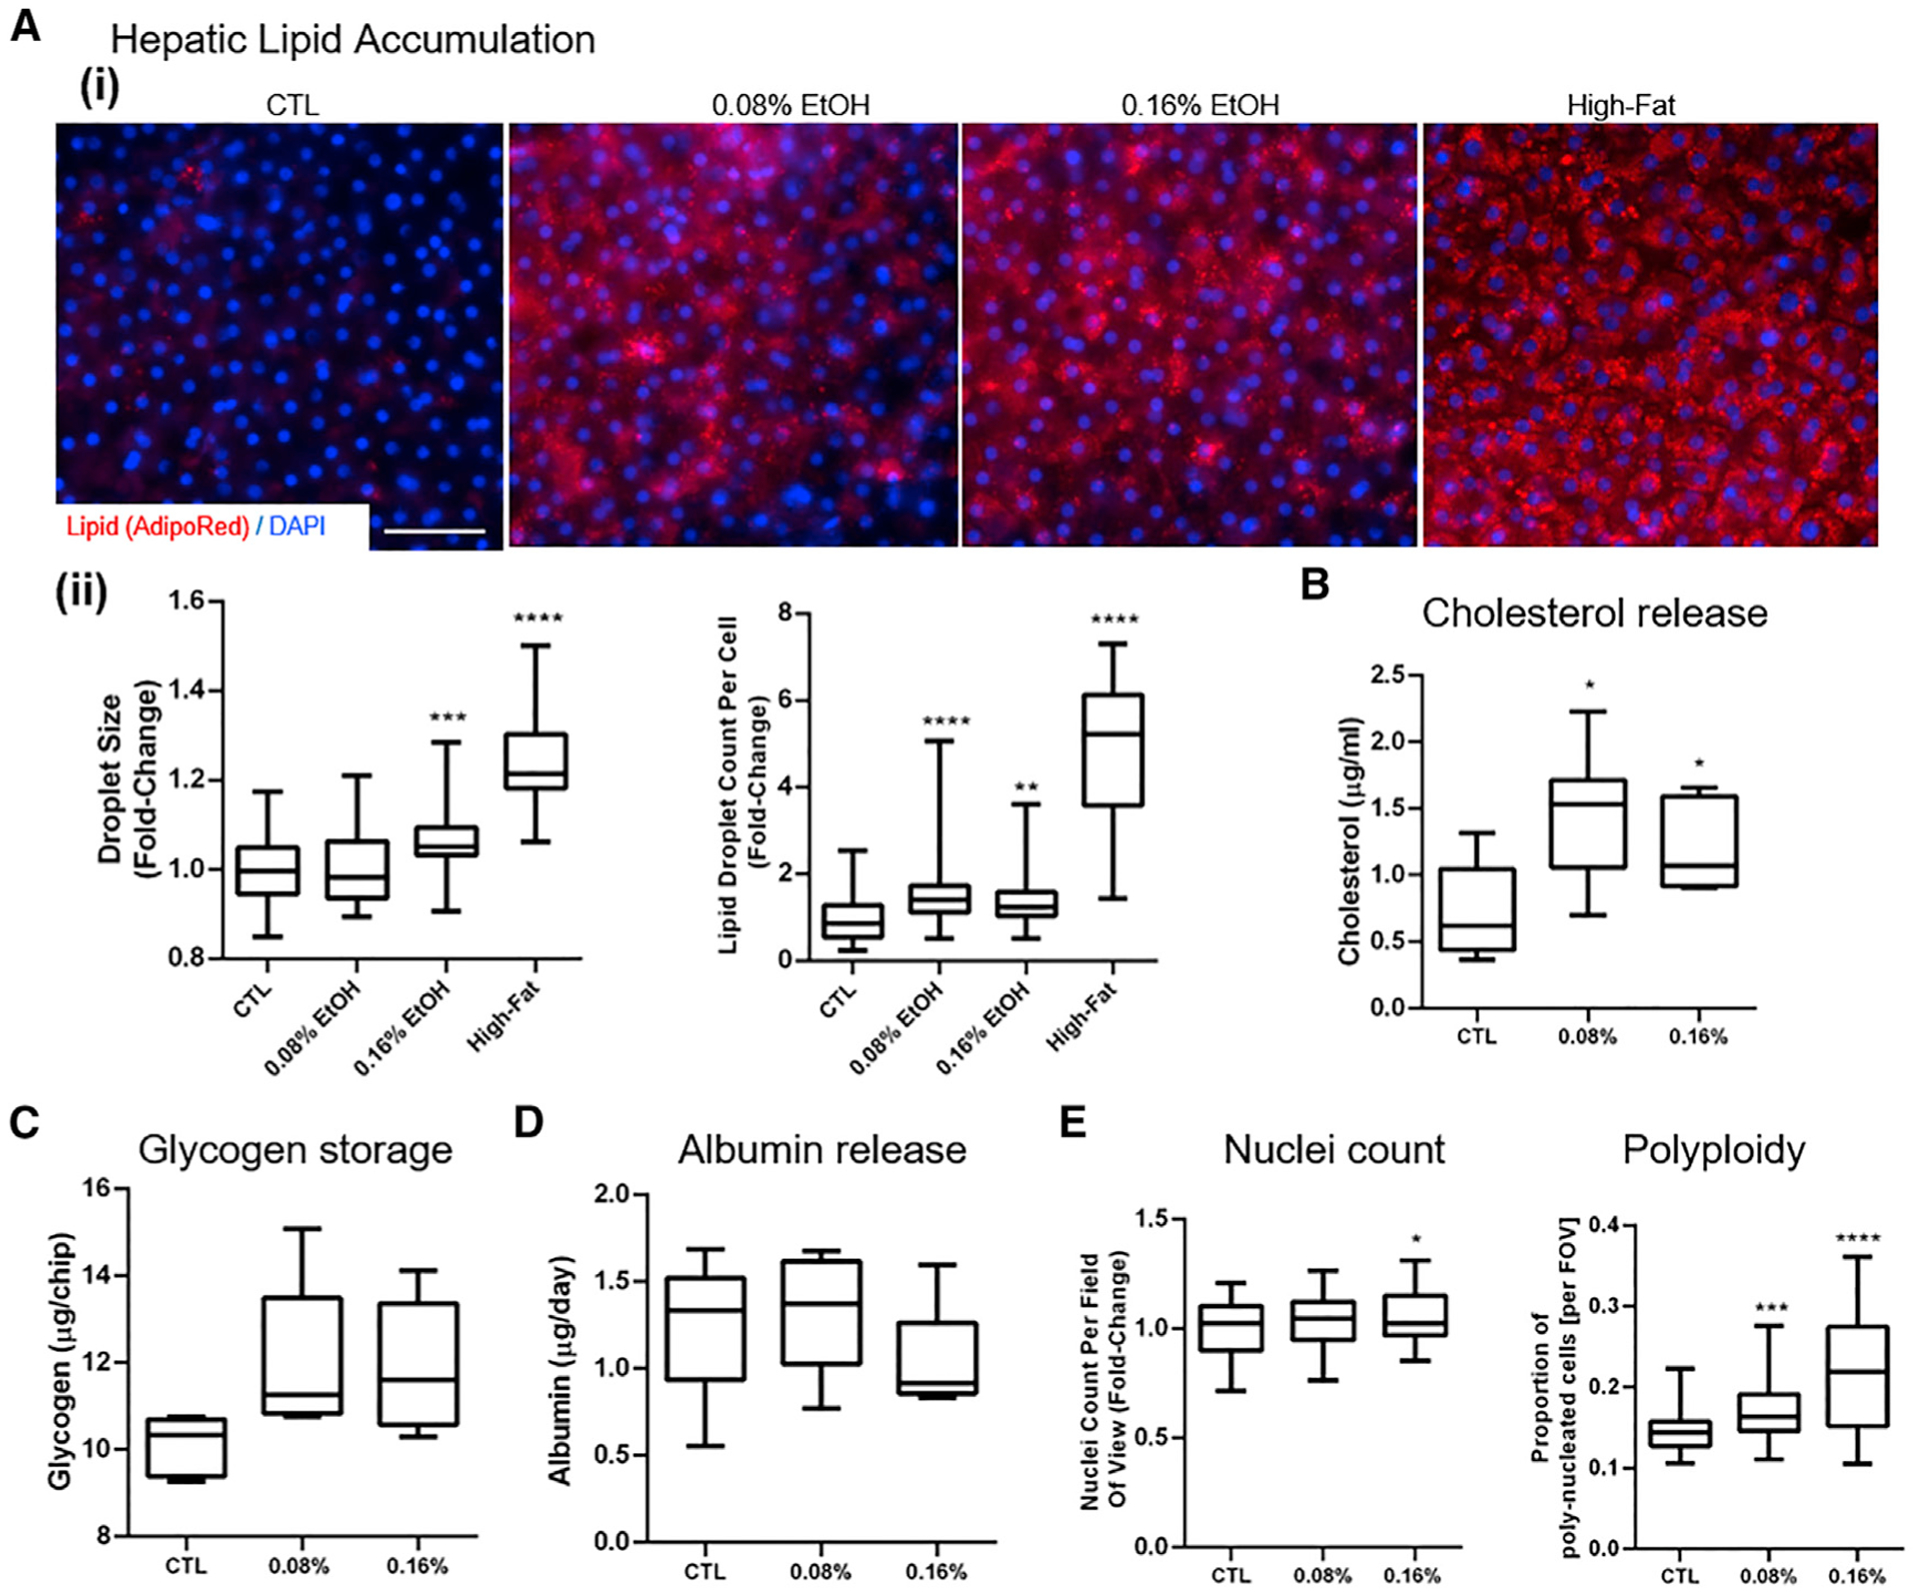
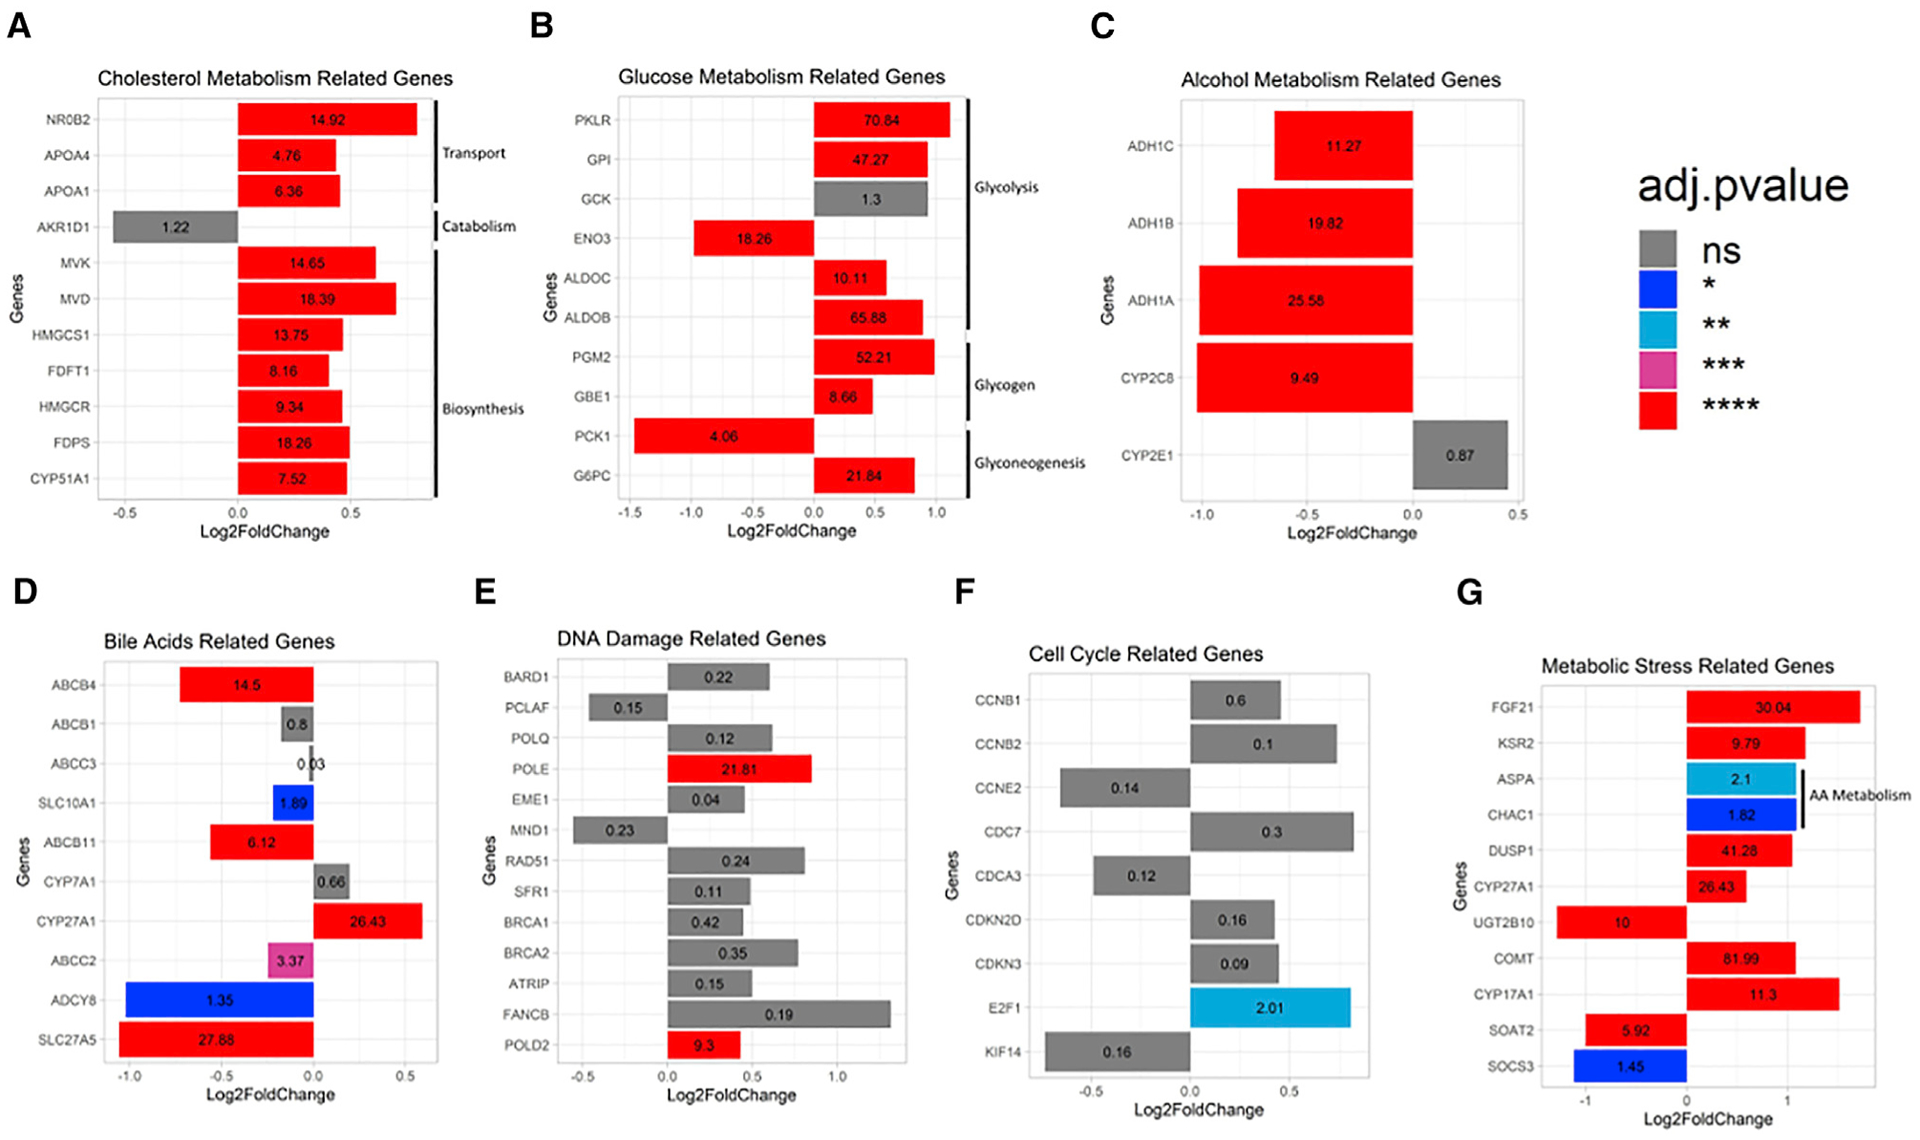
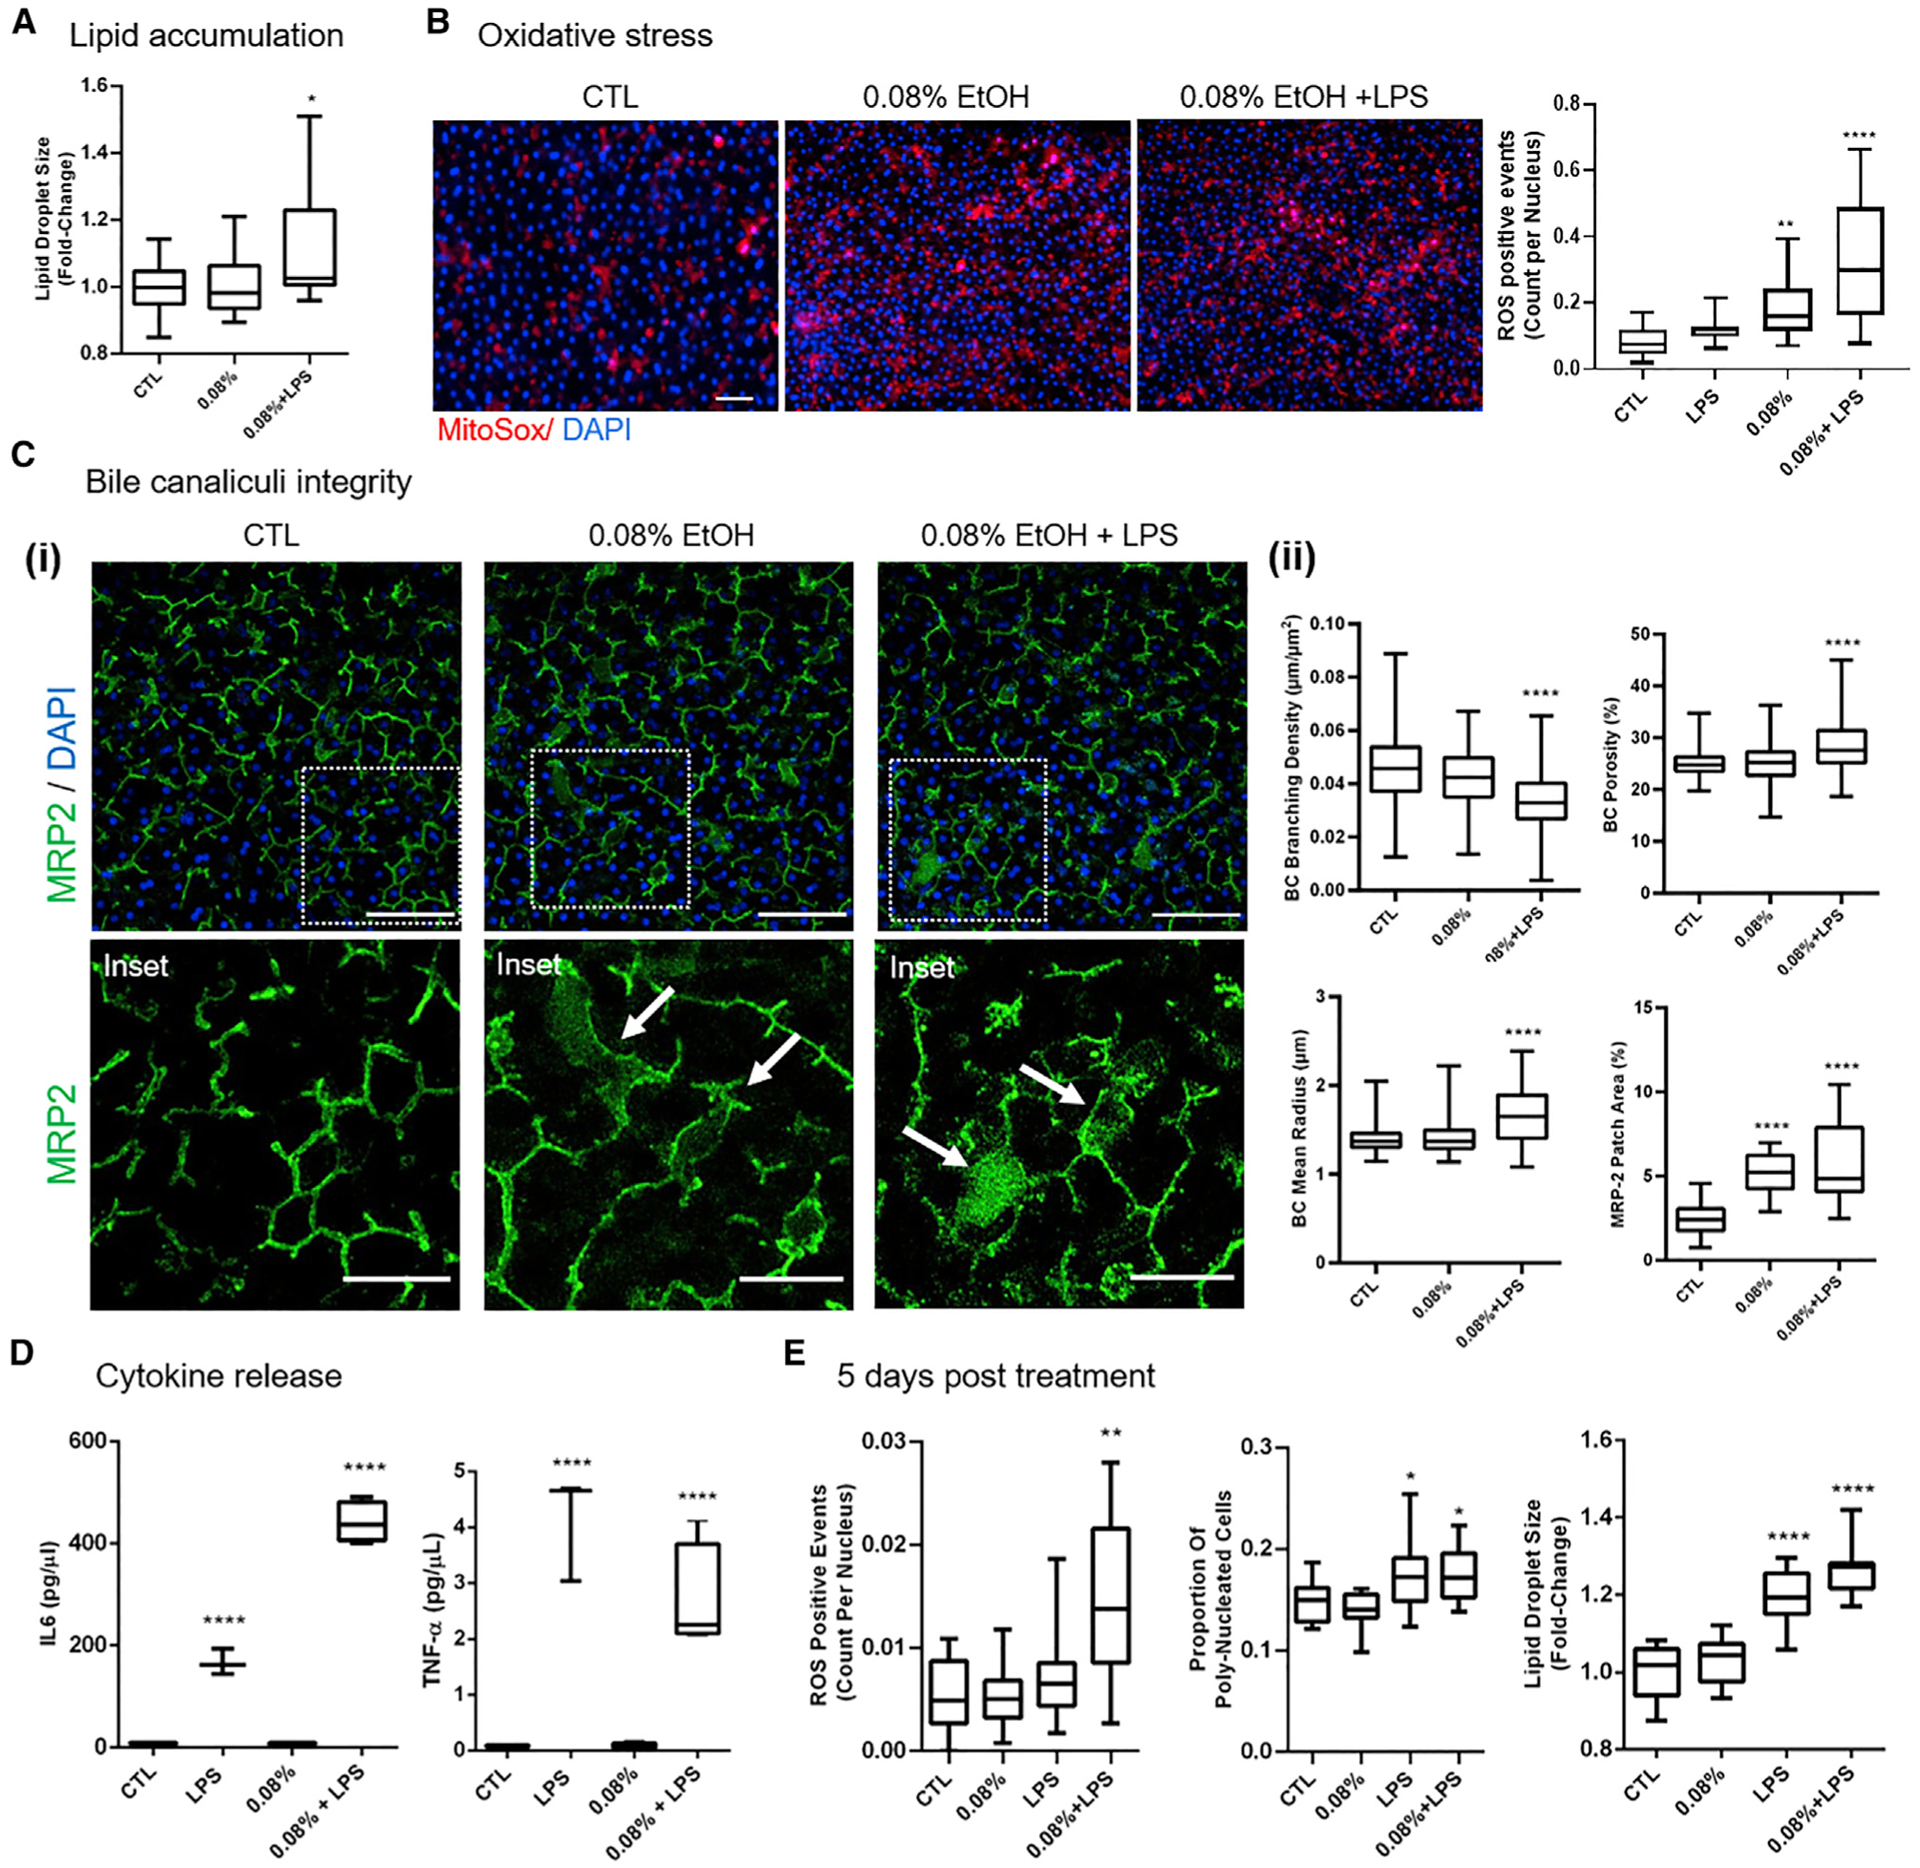
Alcohol-associated liver disease (ALD) is a global health issue and leads to progressive liver injury, comorbidities, and increased mortality. Human-relevant preclinical models of ALD are urgently needed. Here, we leverage a triculture human Liver-Chip with biomimetic hepatic sinusoids and bile canaliculi to model ALD employing human-relevant blood alcohol concentrations (BACs) and multimodal profiling of clinically relevant endpoints. Our Liver-Chip recapitulates established ALD markers in response to 48 h of exposure to ethanol, including lipid accumulation and oxidative stress, in a concentration-dependent manner and supports the study of secondary insults, such as high blood endotoxin levels. We show that remodeling of the bile canalicular network can provide an in vitro quantitative readout of alcoholic liver toxicity. In summary, we report the development of a human ALD Liver-Chip as a powerful platform for modeling alcohol-induced liver injury with the potential for direct translation to clinical research and evaluation of patient-specific responses.

Keywords: ALD; ASH; NASH; alcohol; bile canaliculi; digital pathology; fatty liver; liver disease; organ-on-chip; steatosis.


Conflict of interest statement

Declaration of interests All authors except S.L. and E.S. are current or former employees or interns of Emulate and may hold patents related to this work or equity interests in Emulate.

Figures

Figure 1.
Figure 1.. Development of the ALD Liver-Chip
(A) Approach for modeling human ALD/ASH by exposing the organotypic Liver-Chip to human-relevant blood-alcohol concentrations (BACs). Scale bar, 50 μm. (B) Different ECM composition and deposition methods were tested in the Liver-Chip to improve ECM scaffold thickness, homogeneity, and stability under flow. (C) Optimization of BC network integrity in the Liver-Chip. Scale bar, 100 μm. (i) Representative images of BC networks (MRP2, green) of the triculture Liver-Chip as a function of ECM conditions. (ii) Effects of different ECM conditions on the radius, branching density, and area fraction of BC networks. Biomimetic hepatobiliary architecture (condition ECM-C and ECM-D) is characterized by higher branching density, higher porosity, and more narrowly distributed mean radius compared to control (standard). Data are from one experiment with n = 3 chips per condition. Data represent median ± (minimum and maximum), ***p < 0.001; ****p < 0.0001 versus control (branching density and porosity, Kruskal-Wallis and Dunnett’s multiple comparisons test; radius, Kolmogorov–Smirnov (KS) test and Bonferroni correction for multiple comparisons test).
Figure 2.
Figure 2.. Assessment of liver toxicity, metabolic changes, and polyploidy in the ALD/ASH Liver-Chip
(A) Hepatic lipid accumulation. (i) Lipid droplet accumulation in hepatocytes visualized using AdipoRed staining after administration of fat (oleic acid 1 μg/mL; positive control) or ethanol (0.08% and 0.16%) for 48 h. Scale bar, 50 μm. (ii) Number of lipid droplets per cell and lipid droplet size (projected area). (B–D) Quantitative analysis of hepatic functional markers in the Liver-Chip after 48 h of exposure to physiologically relevant BACs. Fluorometric assessment using ELISA of cholesterol levels in the effluent (B), glycogen storage in cell lysate (C), and albumin release (D). (E) Nuclei count per field of view and proportion of hepatocytes with multiple nuclei per cell (polyploidy). Data represent median ± (minimum and maximum). *p < 0.05; **p < 0.01; ***p < 0.001; ****p < 0.0001 versus control (Kruskal-Wallis and Dunnett’s multiple comparisons test).
Figure 3.
Figure 3.. Gene expression profiling of the Liver-Chip induced by physiologically relevant ethanol concentrations
(A–G) Differential gene expression analysis in hepatocytes from ethanol-treated (exposed for 48 h at either 0.08% or 0.16%; see STAR Methods) and control Liver-Chip revealed significant differences in the expression of genes related to alcohol metabolism (A), cholesterol metabolism (B), glucose metabolism (C), bile acid production and maintenance (i.e., cholestasis) (D), DNA damage (E), cell-cycle regulation (F), and oxidative and metabolic stress (G). The adjusted p value is listed within each bar, with statistical significance indicated by bar color and *p < 0.05; **p < 0.01; ***p < 0.001; ****p < 0.0001. Data are from one experiment with two to five chips per condition.
Figure 4.
Figure 4.. Modeling the two-hit hypothesis for ALD/ASH and alcohol abstinence in the ALD Liver-Chip
Data were collected after 48 h of exposure to 0.08% ethanol or ethanol + LPS. (A) Quantification of mean lipid droplet size in the hepatocytes. Scale bar, 100 μm. (B) Representative images of MitoSox staining in the hepatocytes (left) and quantification of ROS events (right). (C) BC network changes in responses to treatment. (i) Representative images of changes in MRP2 BC staining (green) showing large MRP2-positive patches in the treatment conditions (arrows). Main scale bar, 100 μm; inset scale bar, 50 μm. (ii) Quantification of the changes in BC radius, branching density, and porosity, as well as the relative area of MRP2 patches. (D) Release of IL-6 and TNF-α as measured by multiplexed immunoassays. Data are from two (48 h ethanol) or one (48 h high-fat diet; 5 days of recovery) independent experiments; minimally n = 2 chips per condition, five to eight images per chip where applicable. Data represent median ± (minimum and maximum). *p < 0.05; **p < 0.01; ****p < 0.0001 versus control (Kruskal-Wallis and Dunnett’s multiple comparisons test). (E) Quantification of mean lipid droplet size and frequency of oxidative stress events and polyploidy in hepatocytes after 48 h of exposure of the Liver-Chip to either ethanol or ethanol + LPS followed by 5 days of recovery without exposure to ethanol.

References

    1. Abe K, Bridges AS, and Brouwer KLR (2009). Use of sandwich-cultured human hepatocytes to predict biliary clearance of angiotensin II receptor blockers and HMG-CoA reductase inhibitors. Drug Metab. Dispos 37, 447–452. - PMC - PubMed
    1. Aljomah G, Baker SS, Liu W, Kozielski R, Oluwole J, Lupu B, Baker RD, and Zhu L (2015). Induction of CYP2E1 in non-alcoholic fatty liver diseases. Exp. Mol. Pathol 99, 677–681. - PMC - PubMed
    1. Anders S, and Huber W (2010). Differential expression analysis for sequence count data. Genome Biol. 11, R106. - PMC - PubMed
    1. Arab JP, Karpen SJ, Dawson PA, Arrese M, and Trauner M (2017). Bile acids and nonalcoholic fatty liver disease: Molecular insights and therapeutic perspectives. Hepatology 65, 350–362. - PMC - PubMed
    1. Asrani SK, Devarbhavi H, Eaton J, and Kamath PS (2019). Burden of liver diseases in the world. J. Hepatol 70, 151–171. - PubMed

Publication types