. 2021 Jul 20;36(3):109406.
doi: 10.1016/j.celrep.2021.109406.

The histone chaperone HIR maintains chromatin states to control nitrogen assimilation and fungal virulence

Affiliations

The histone chaperone HIR maintains chromatin states to control nitrogen assimilation and fungal virulence

Sabrina Jenull et al. Cell Rep. .

Abstract

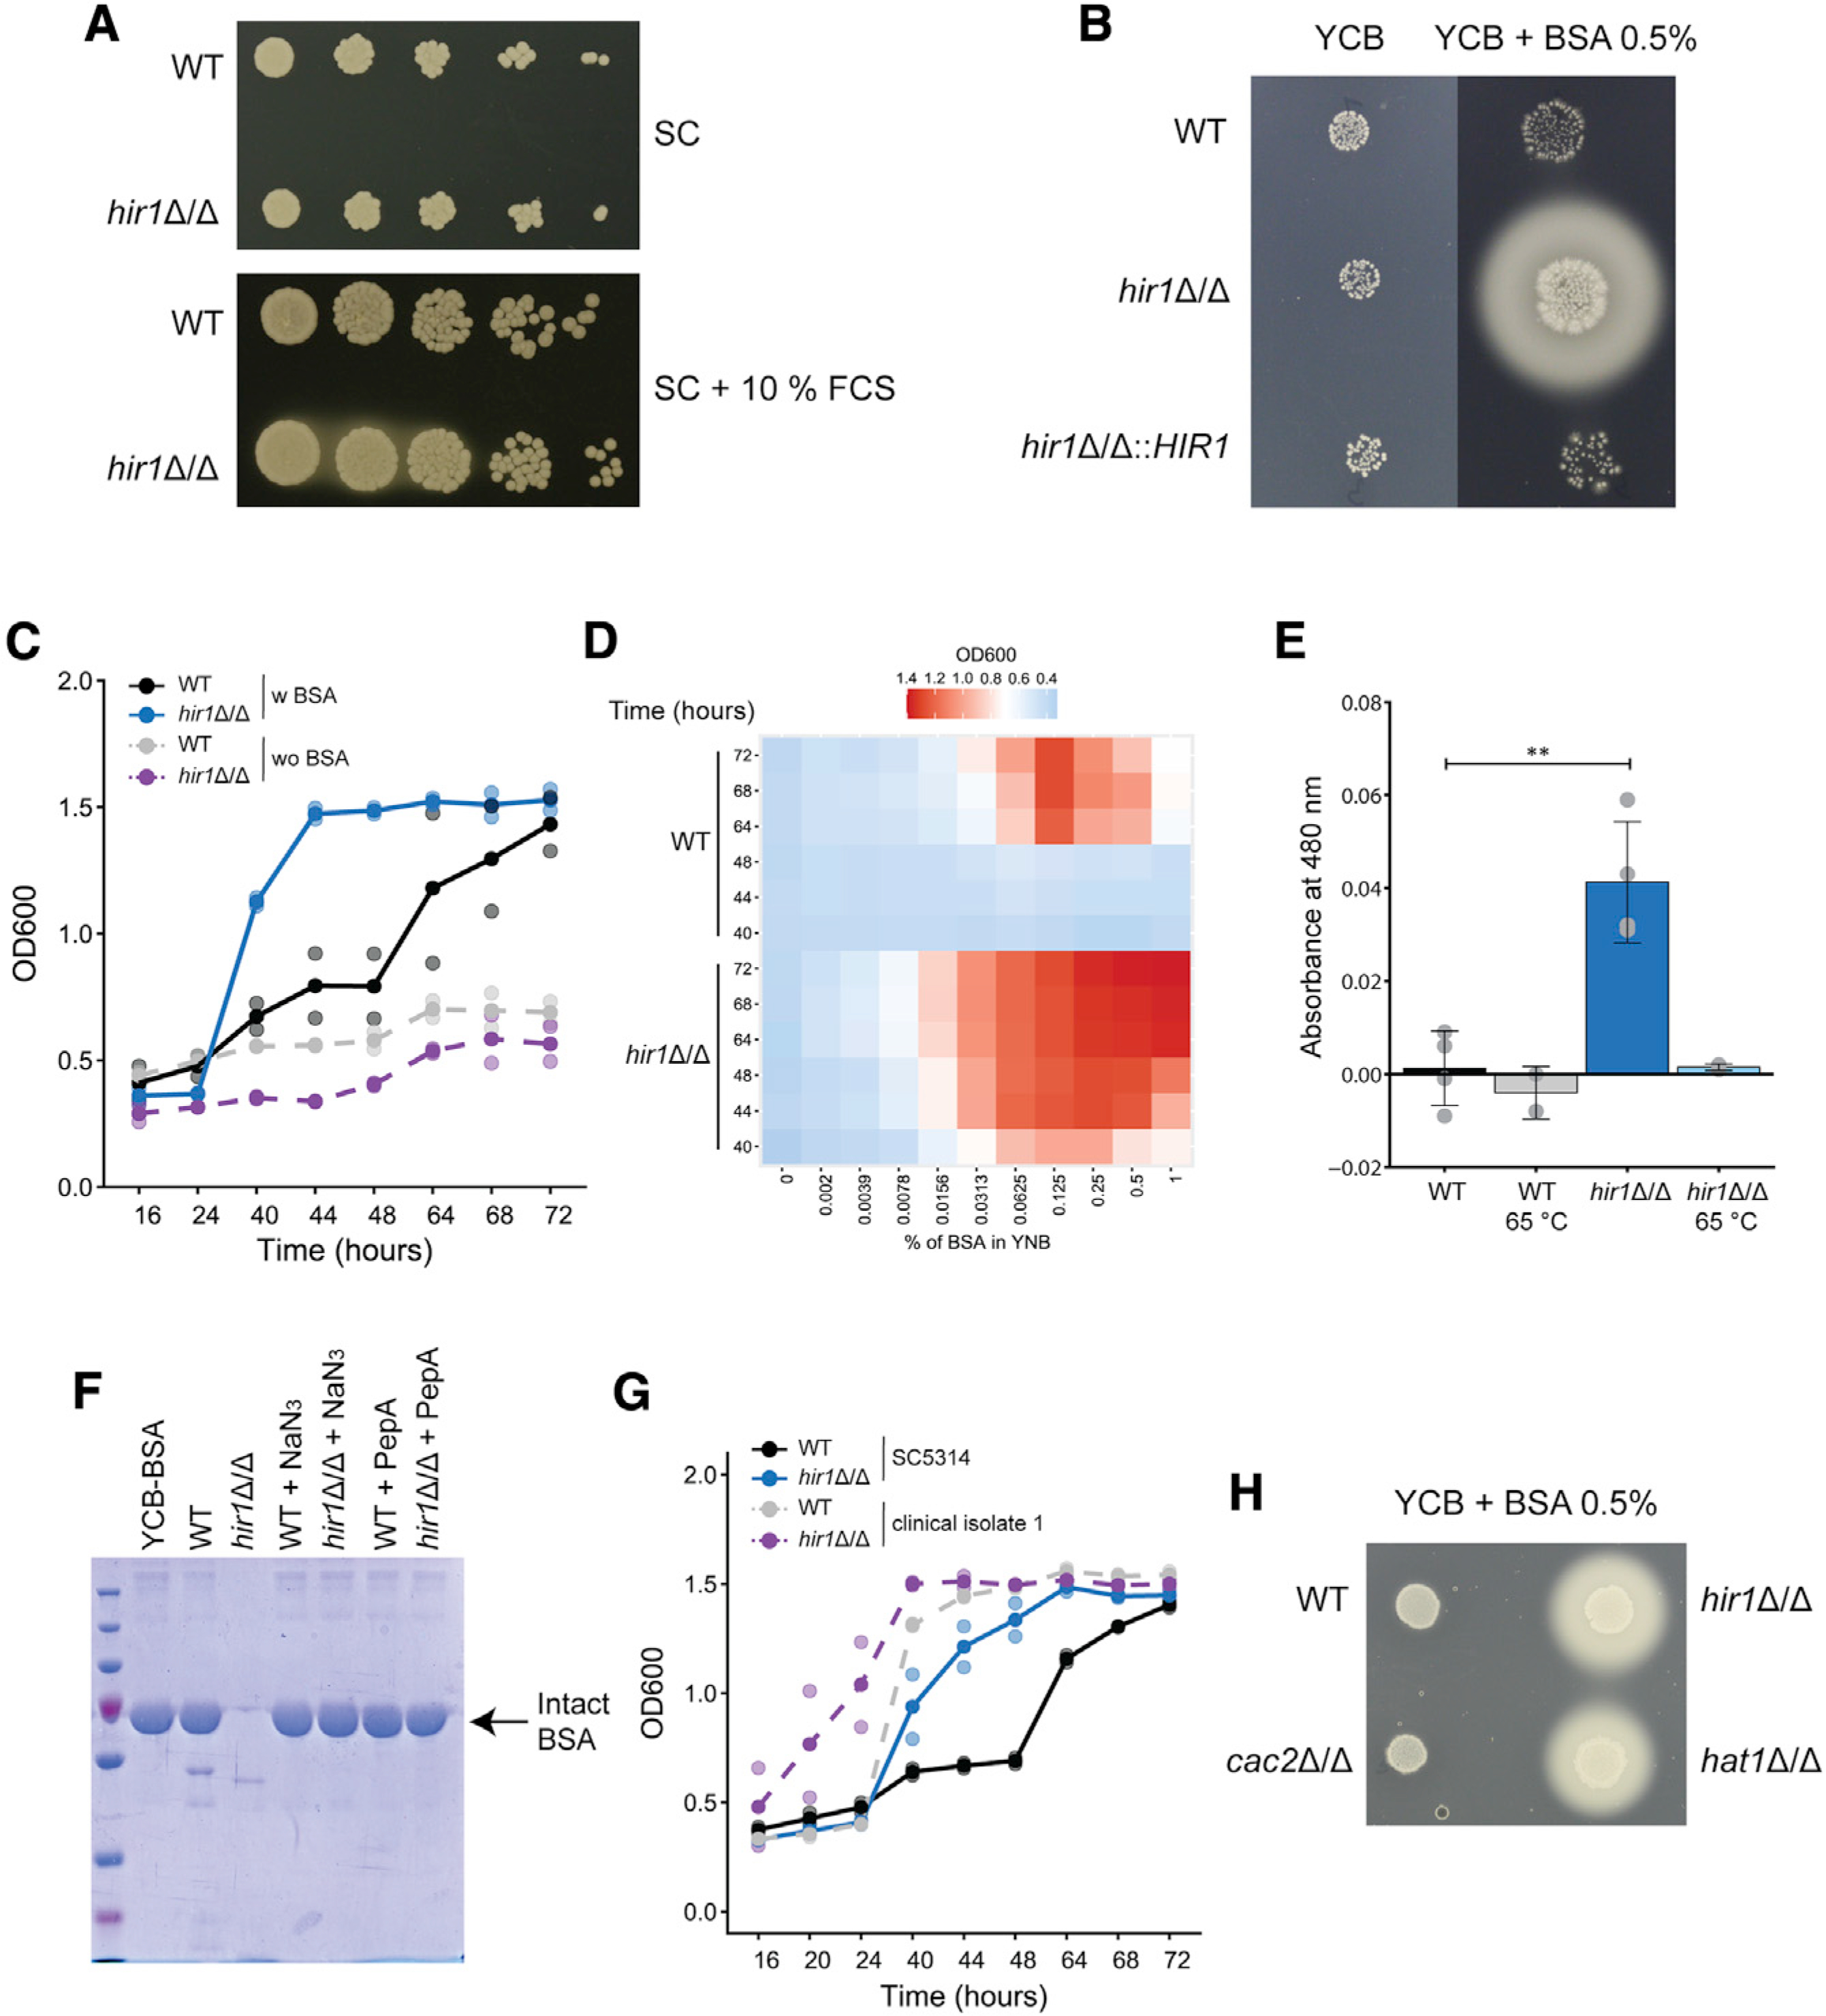
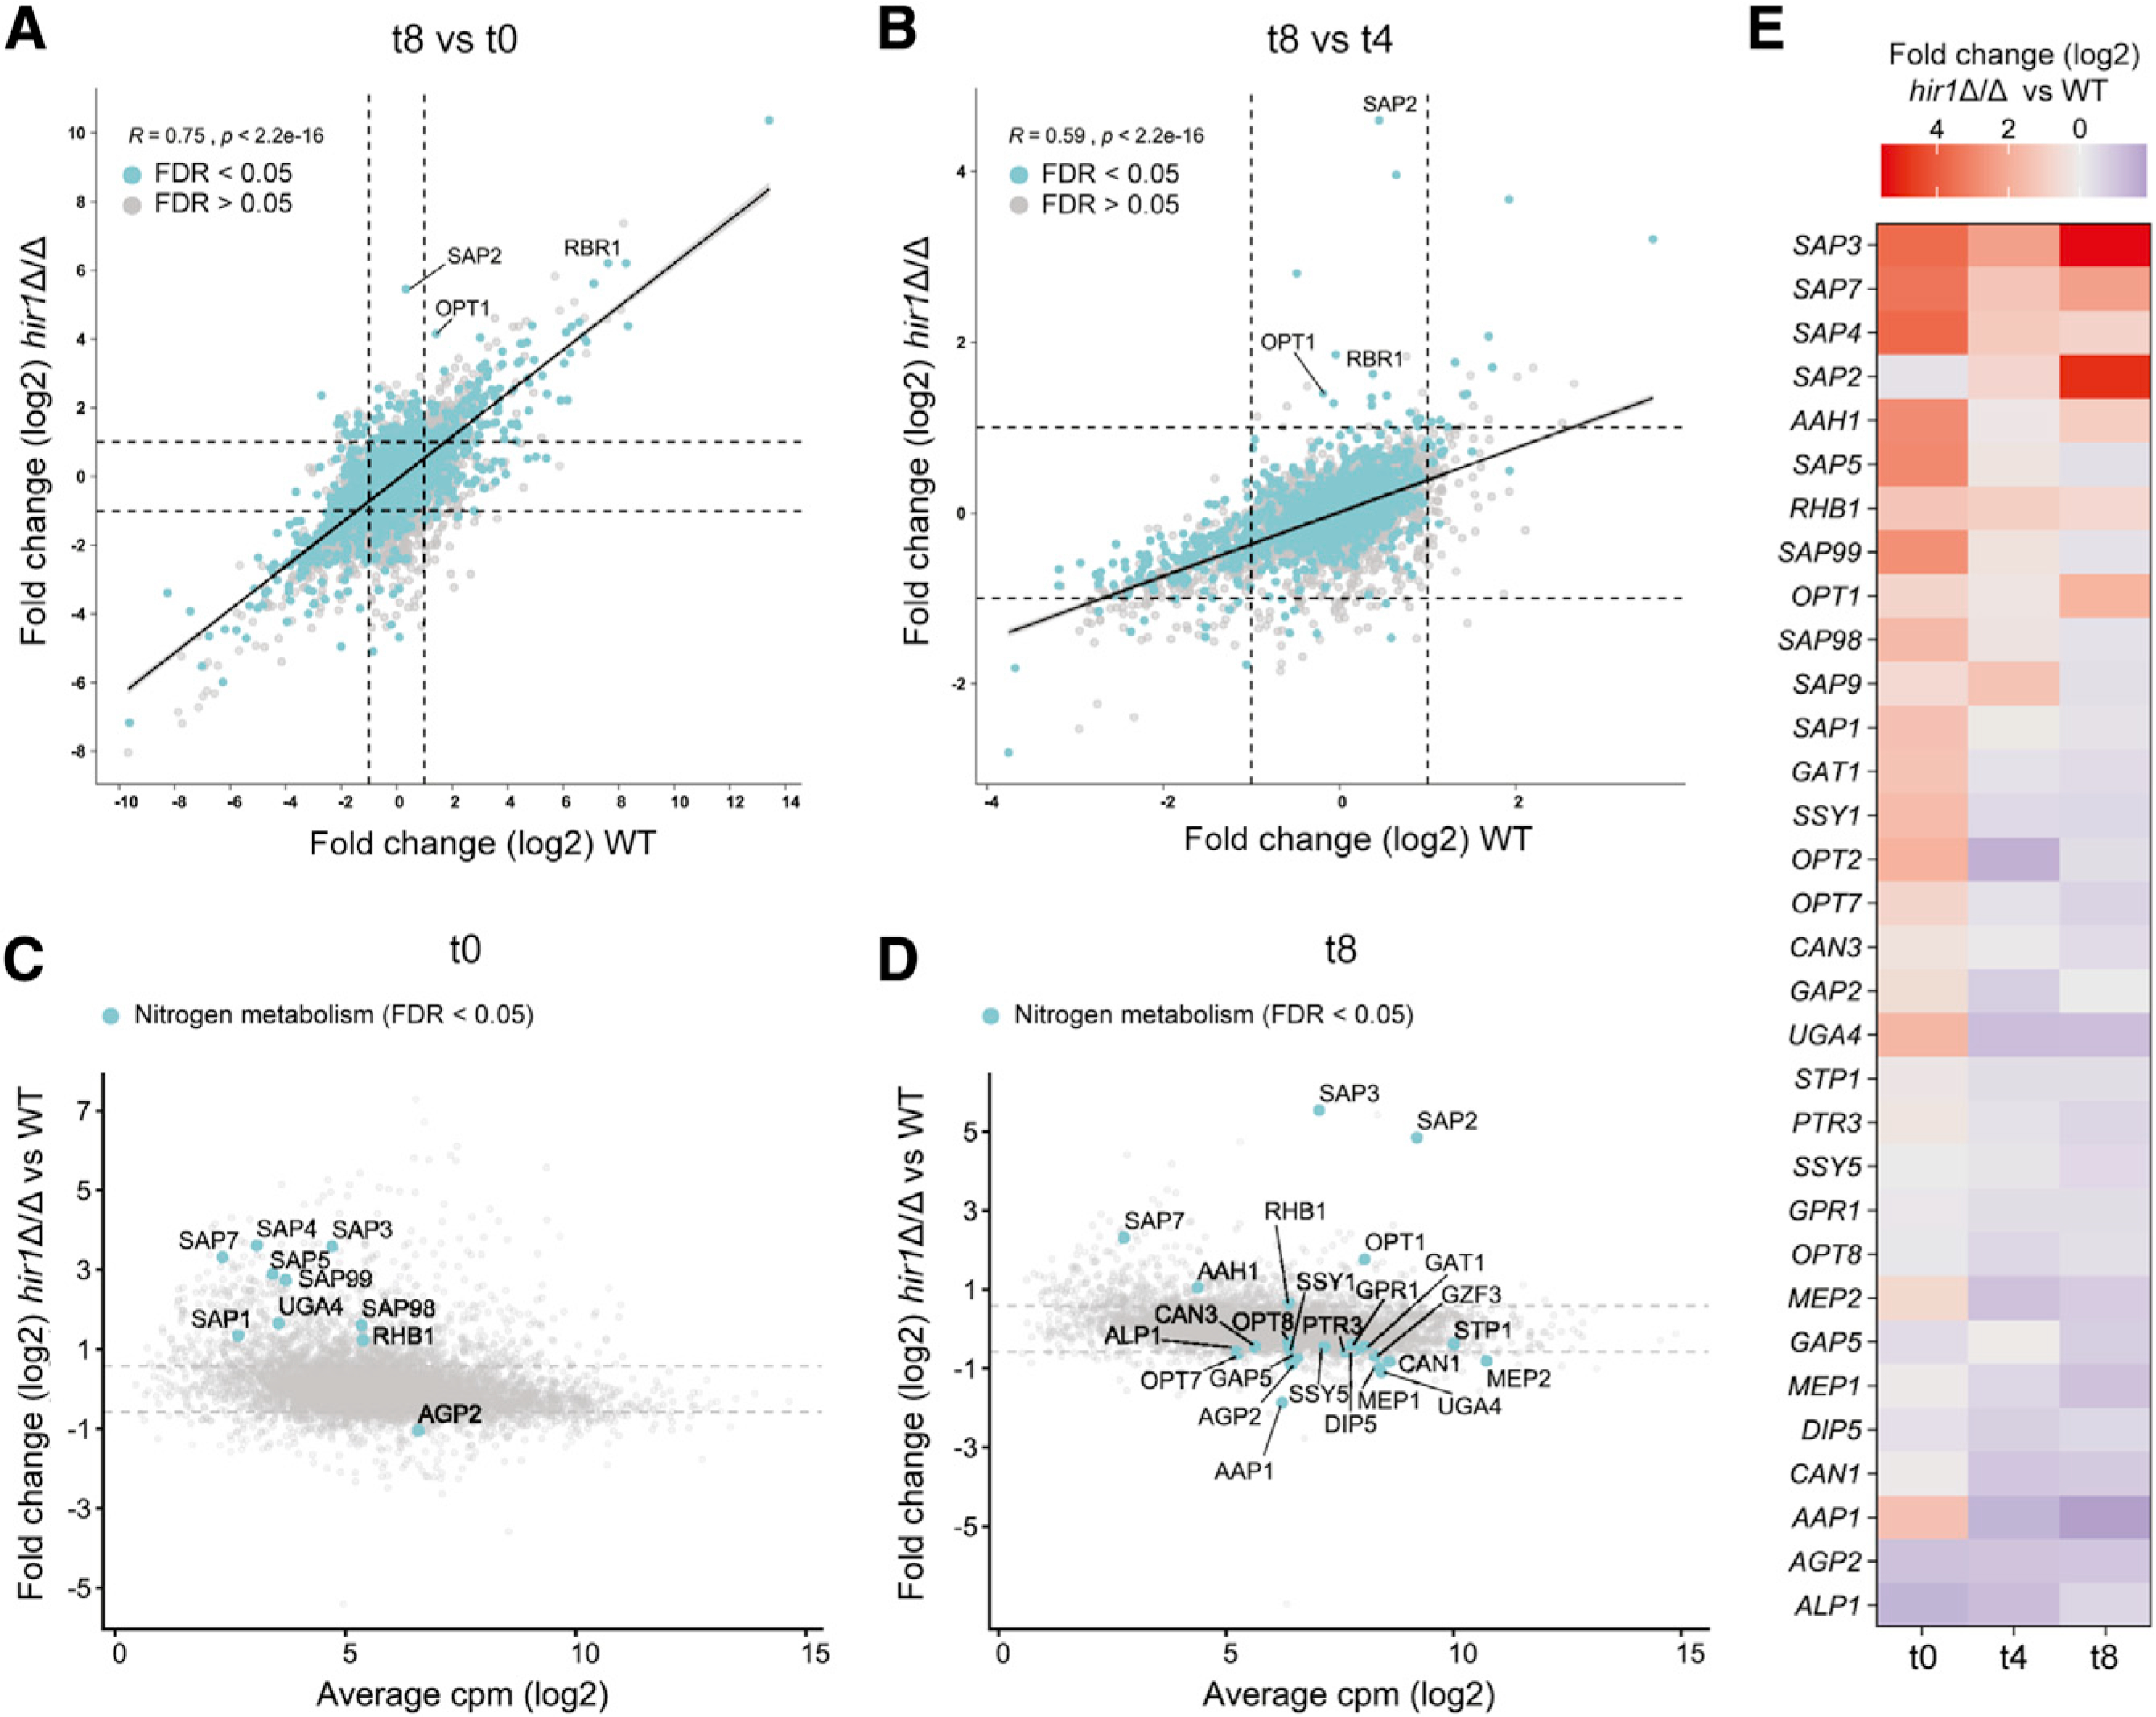
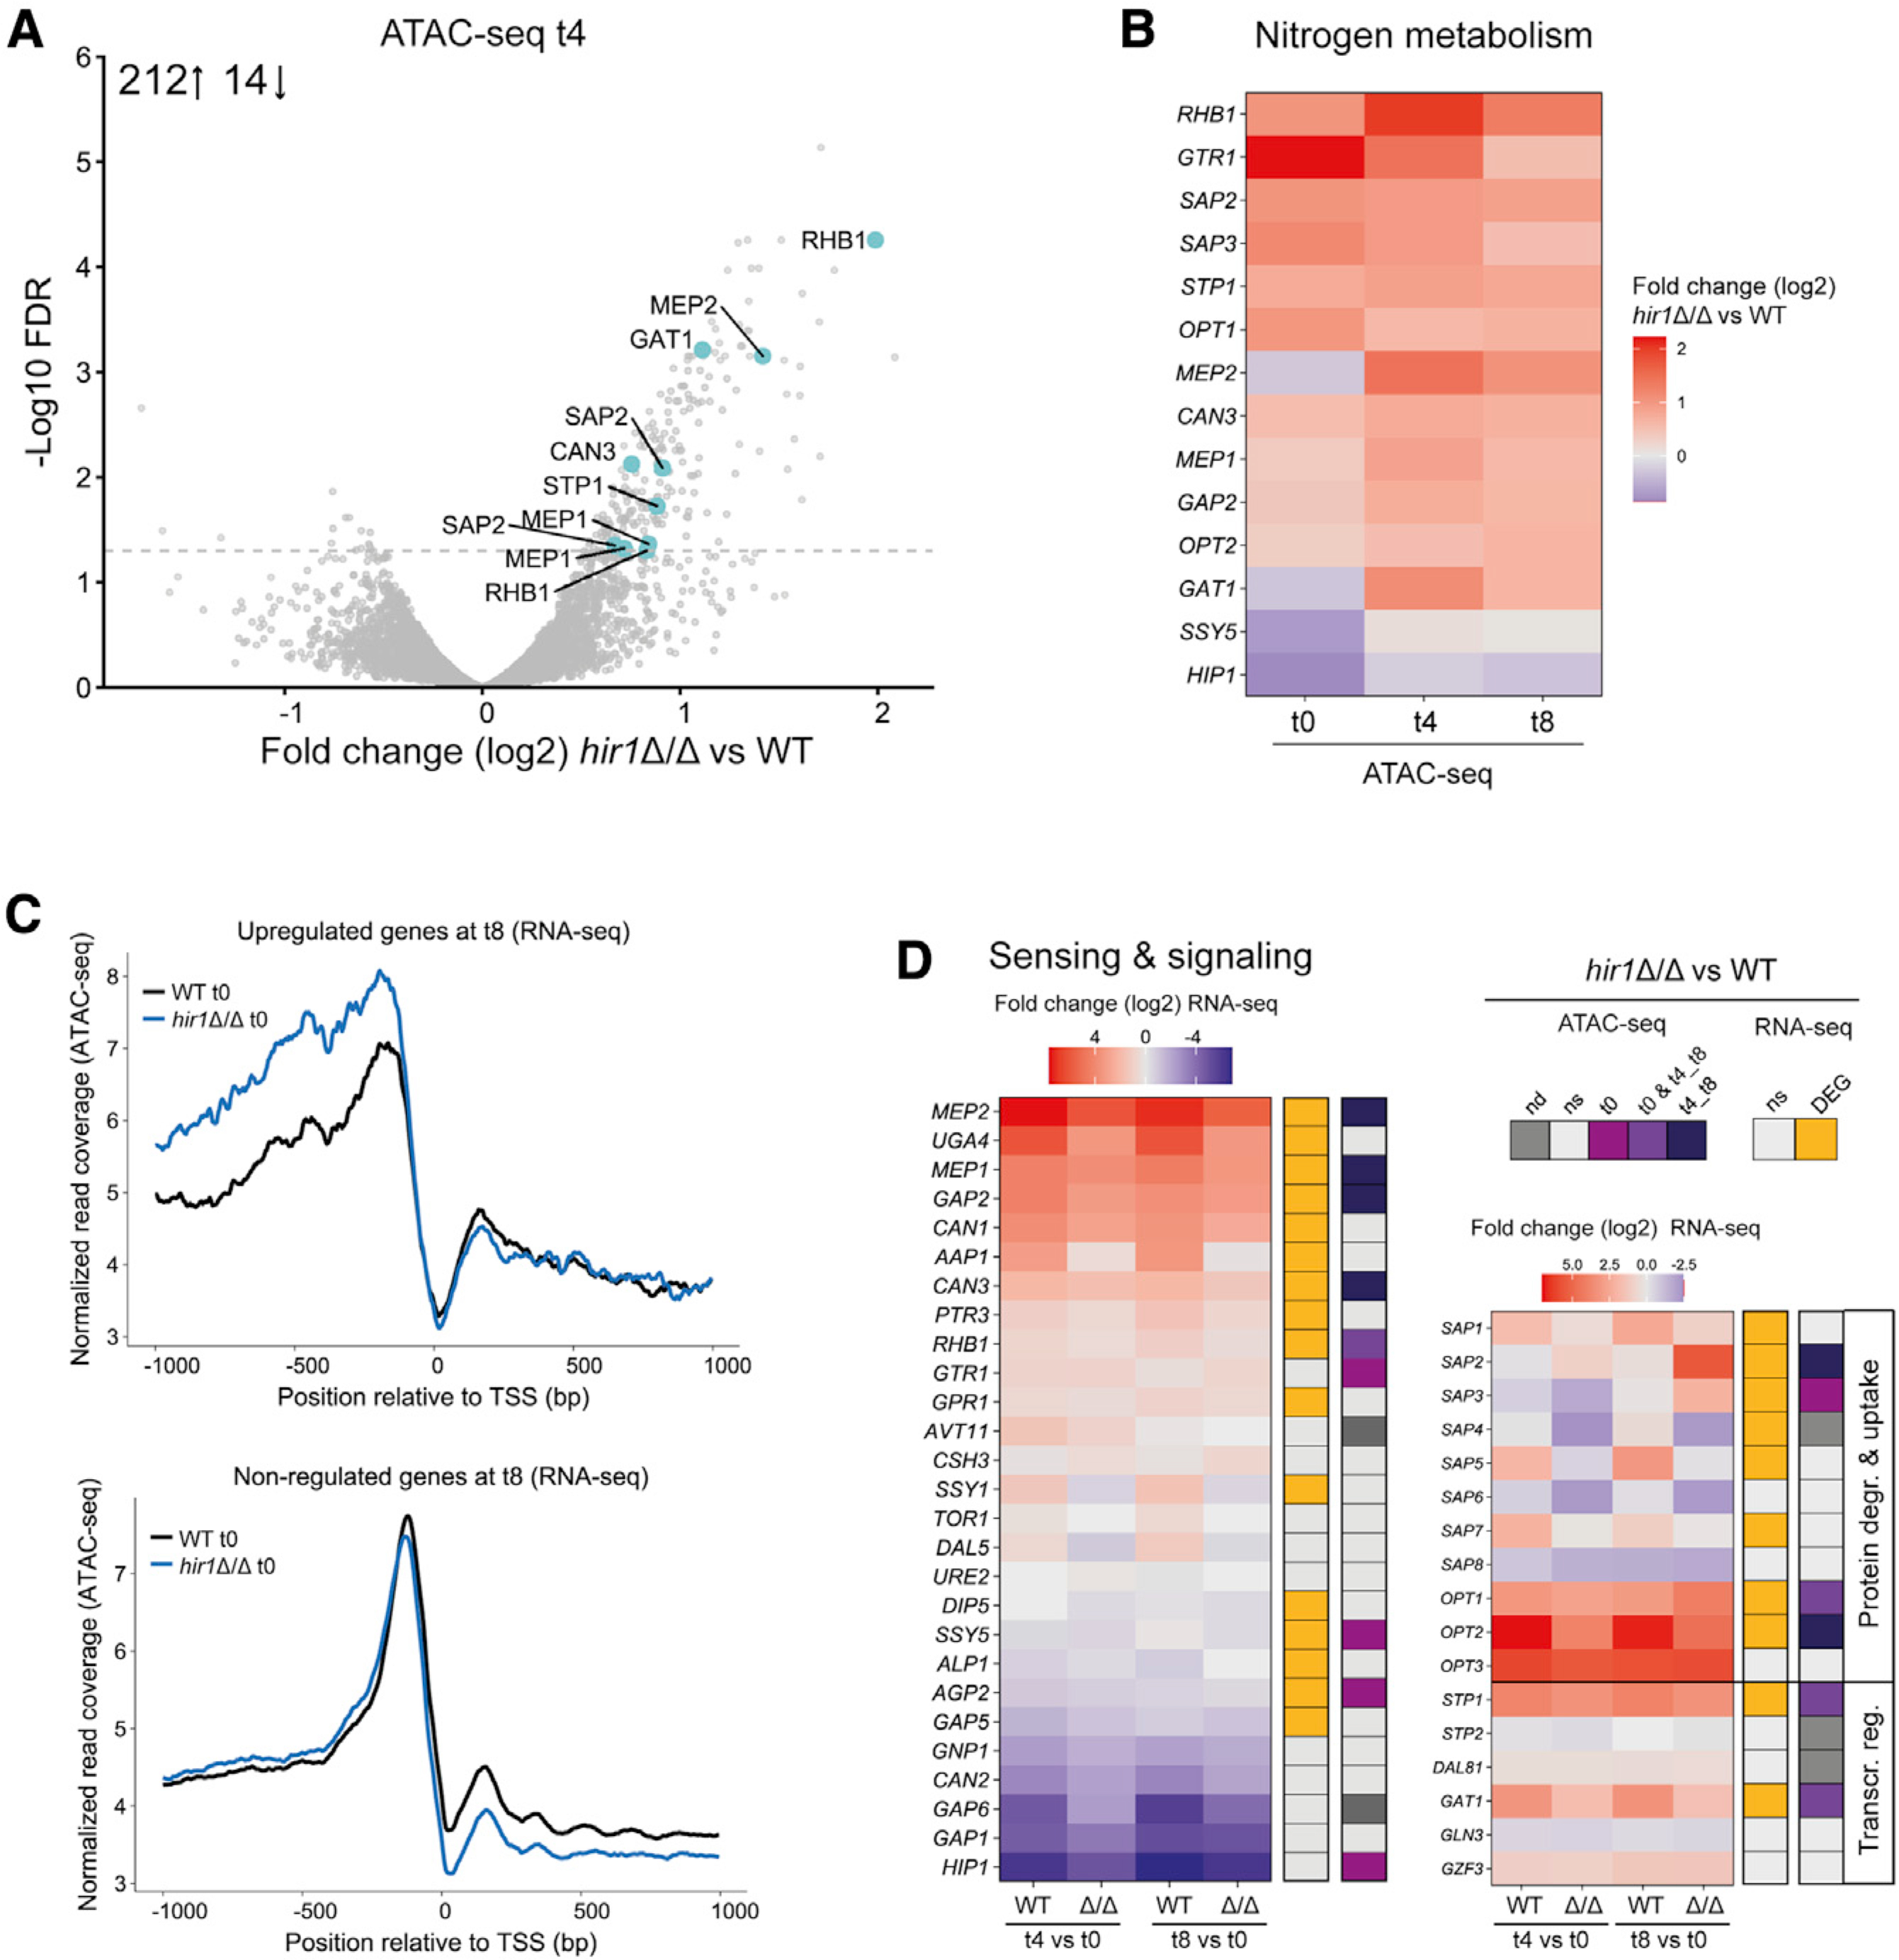
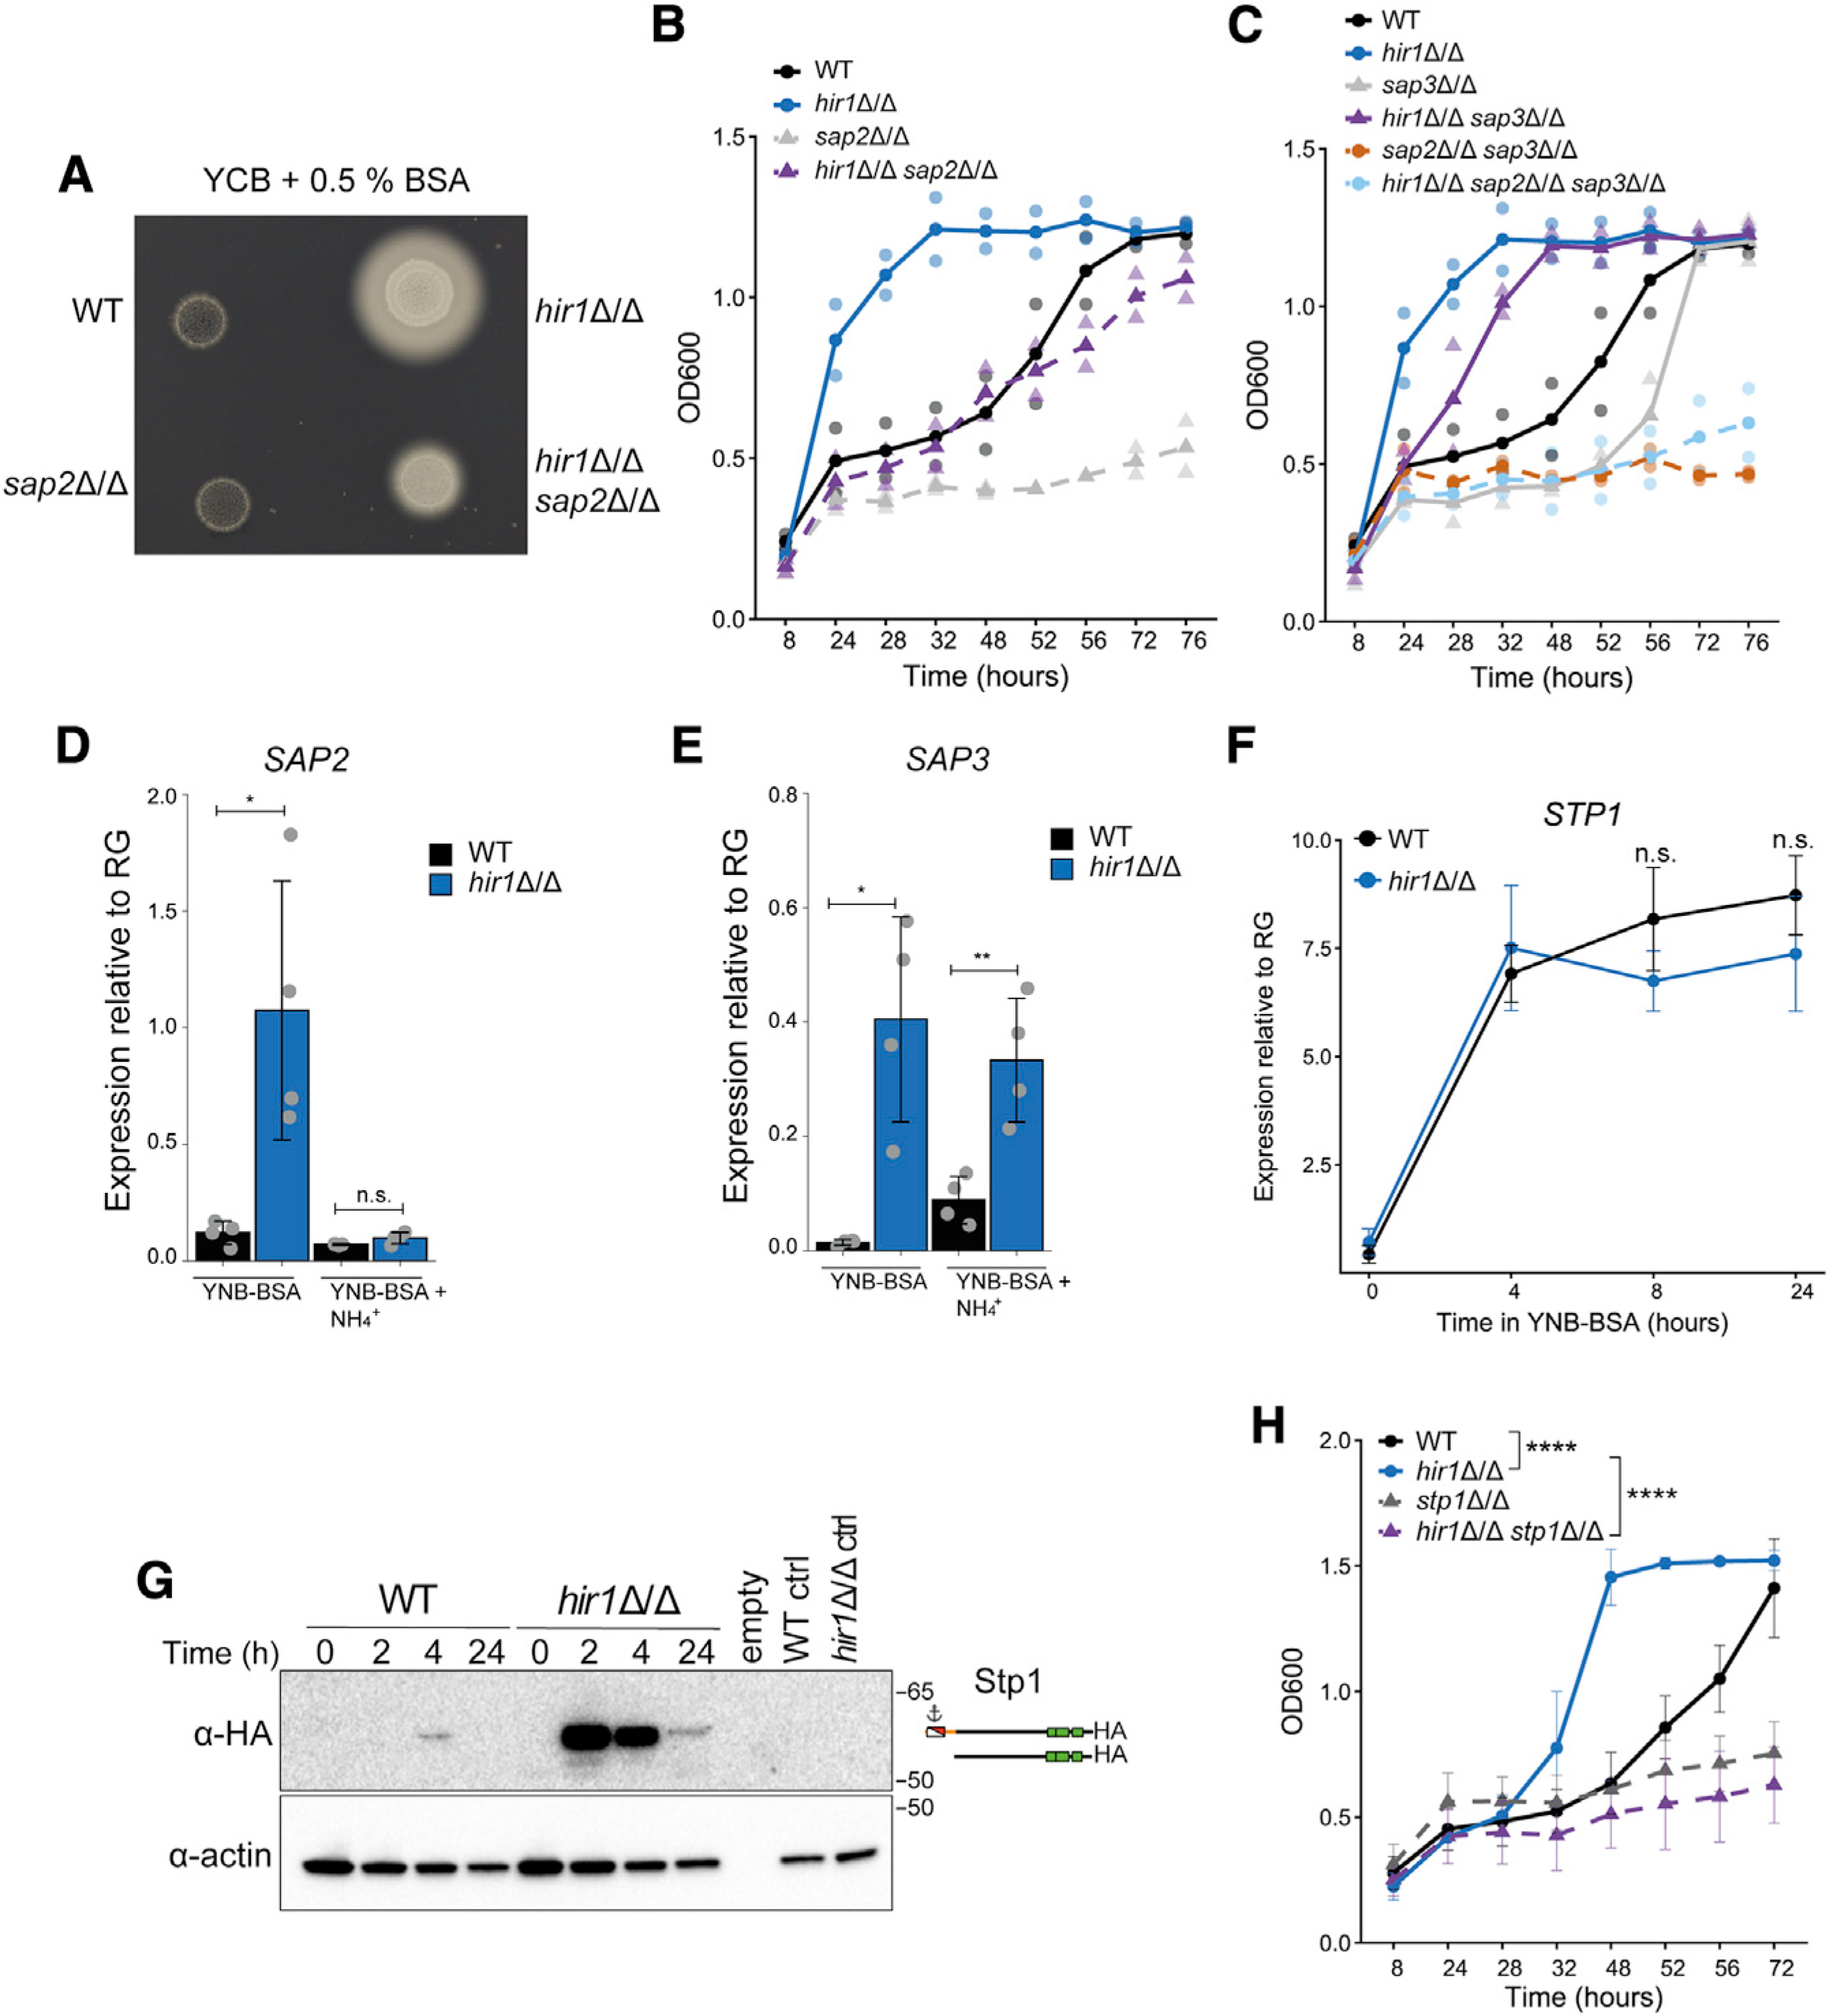
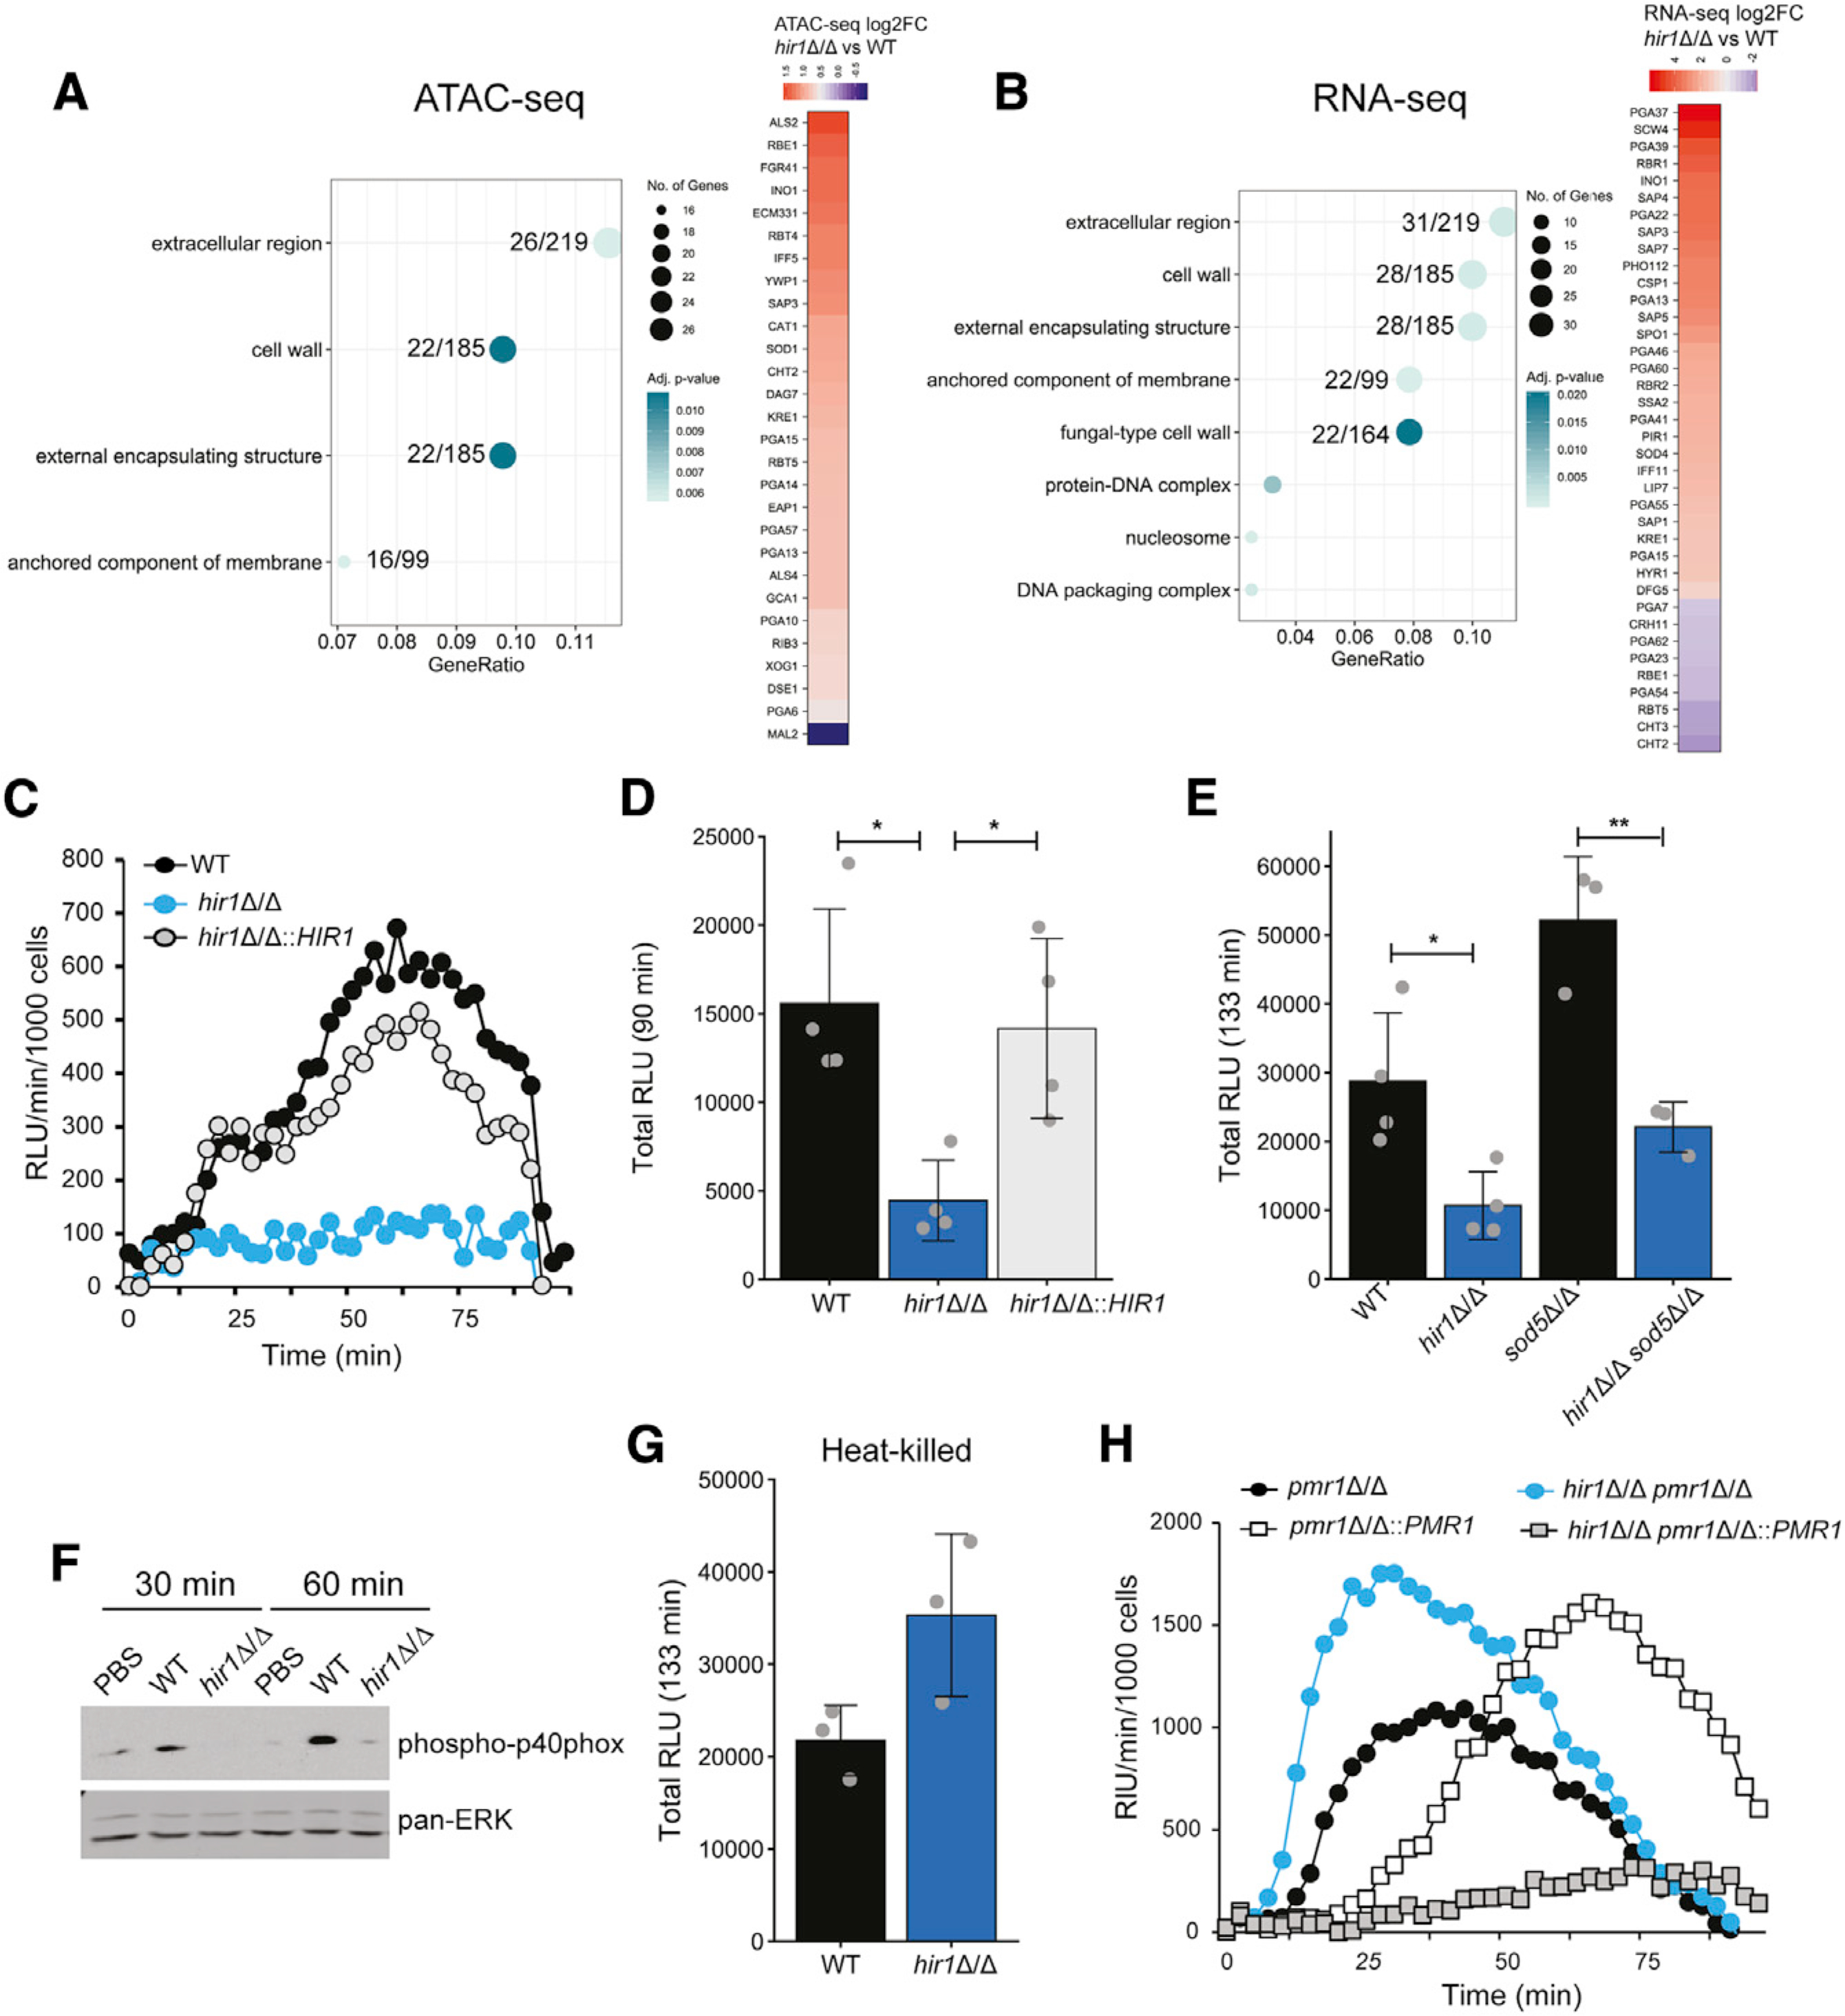
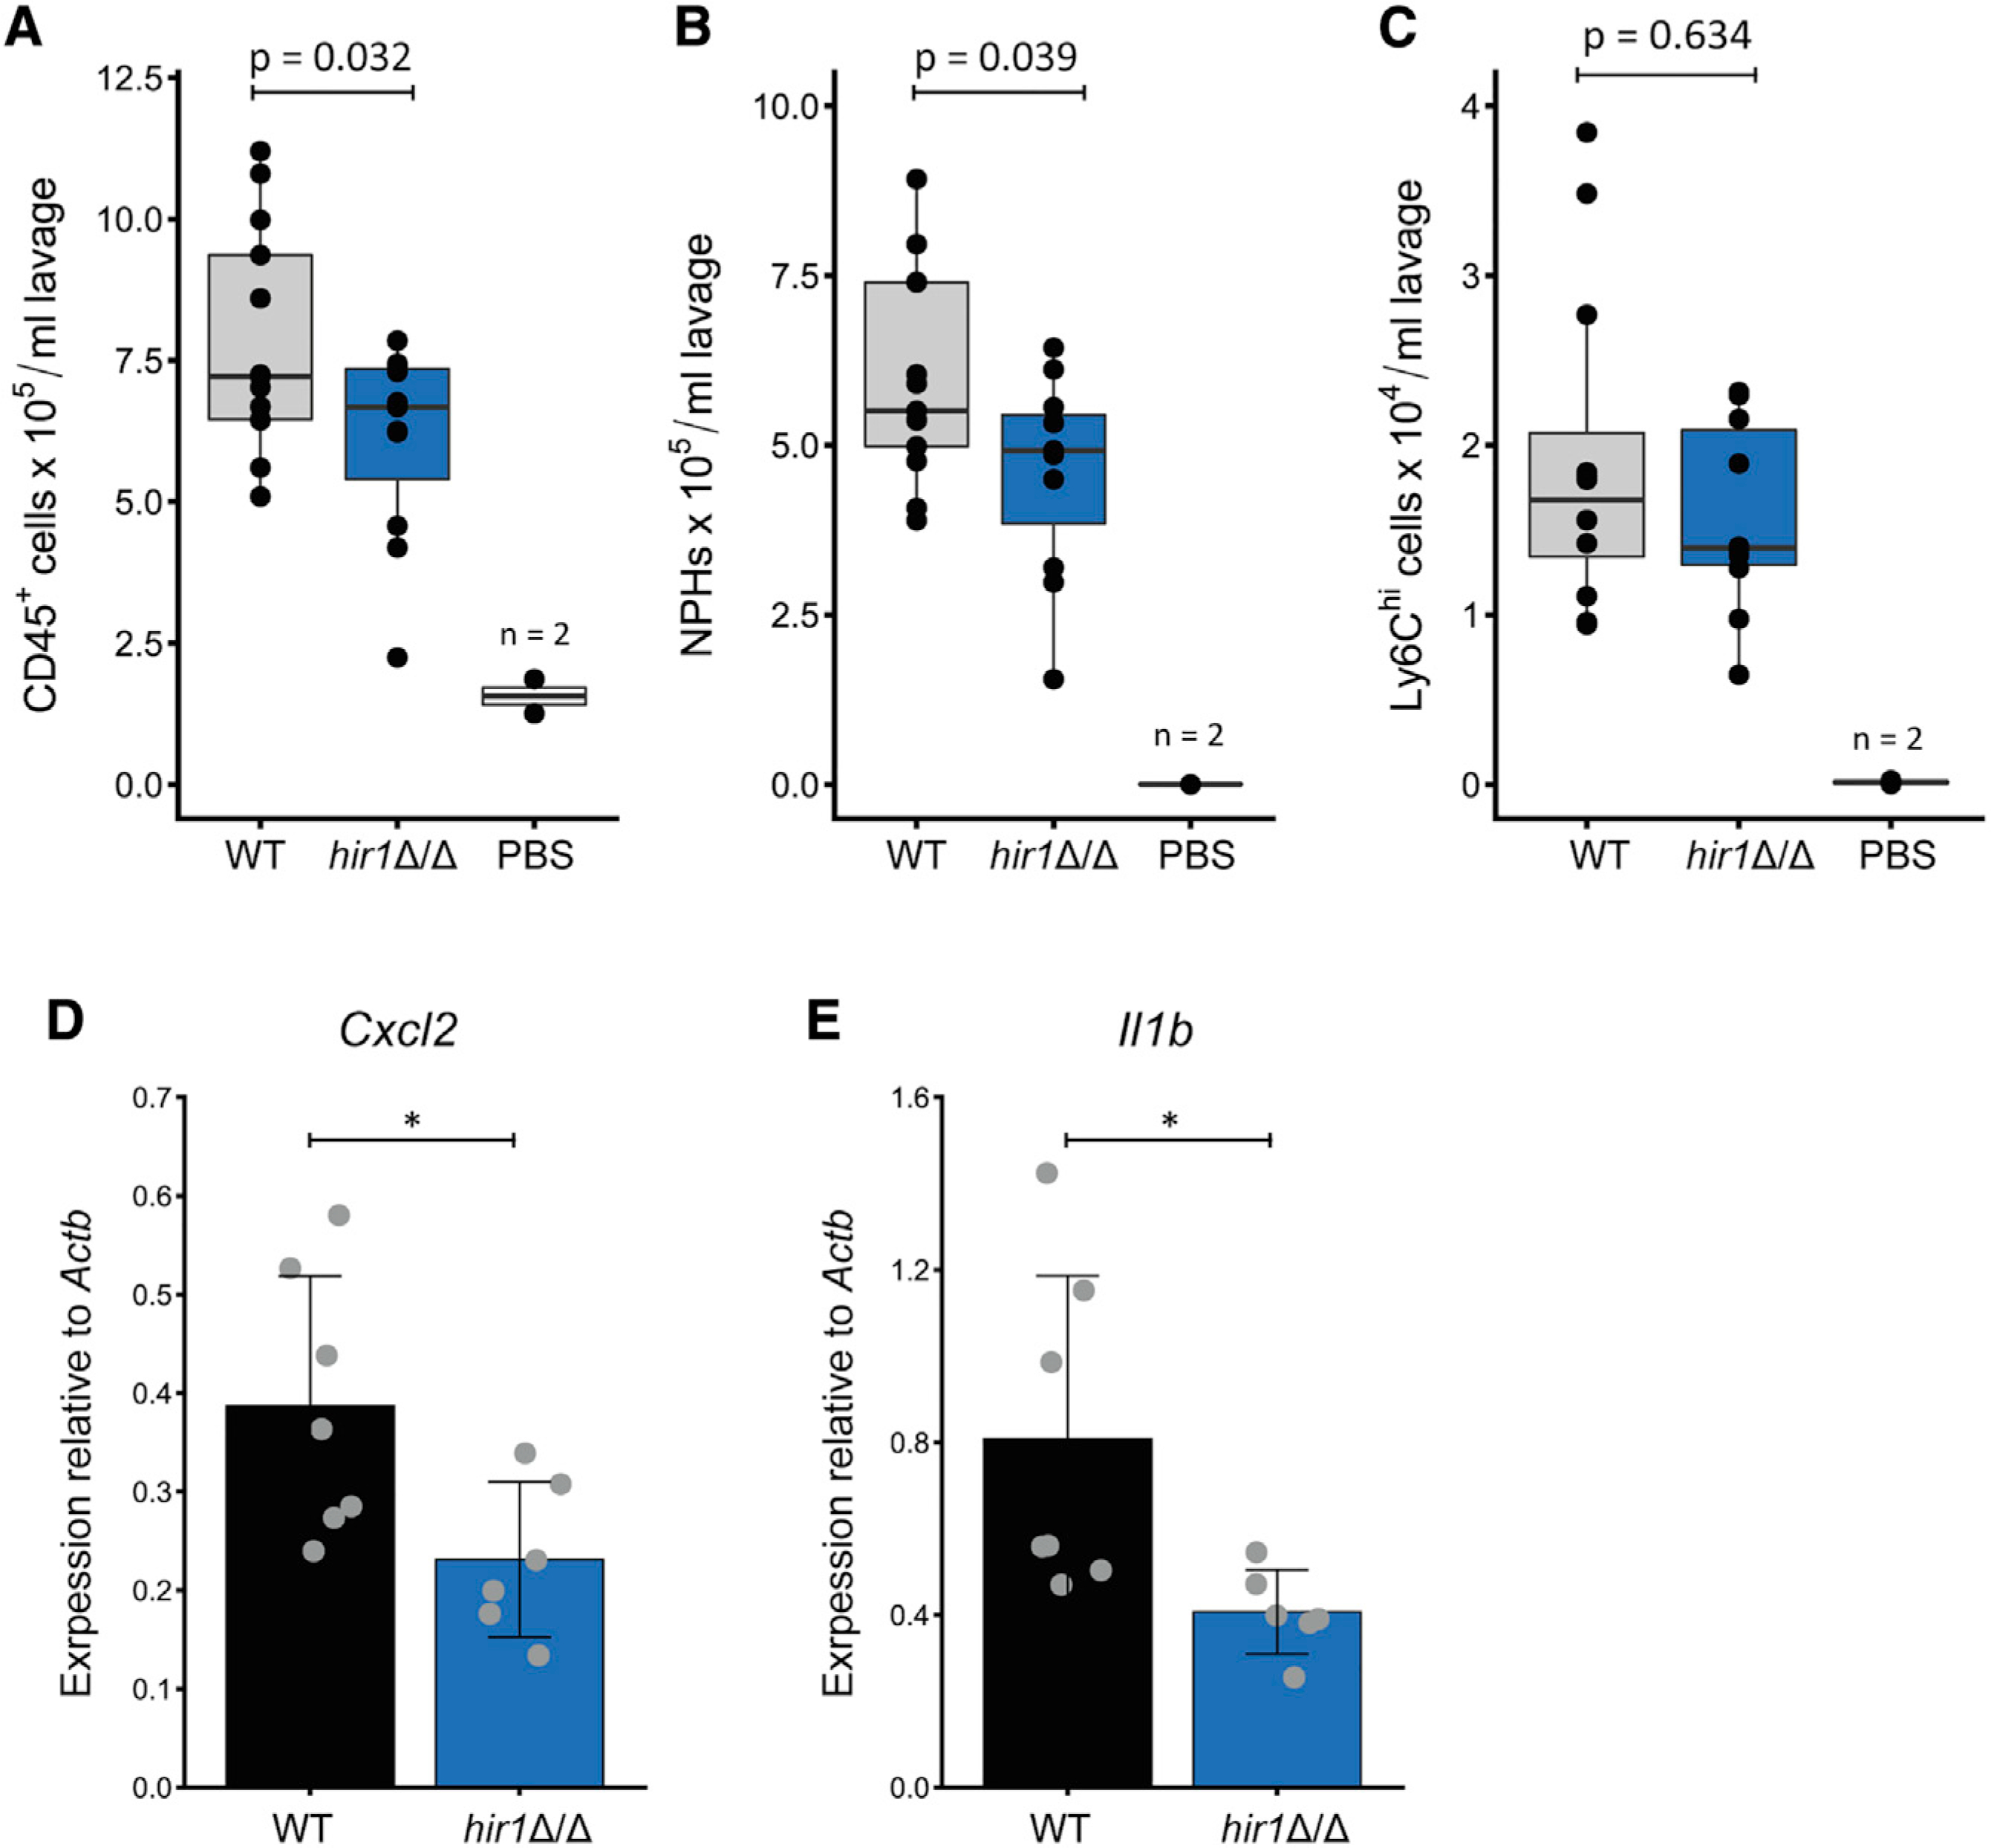
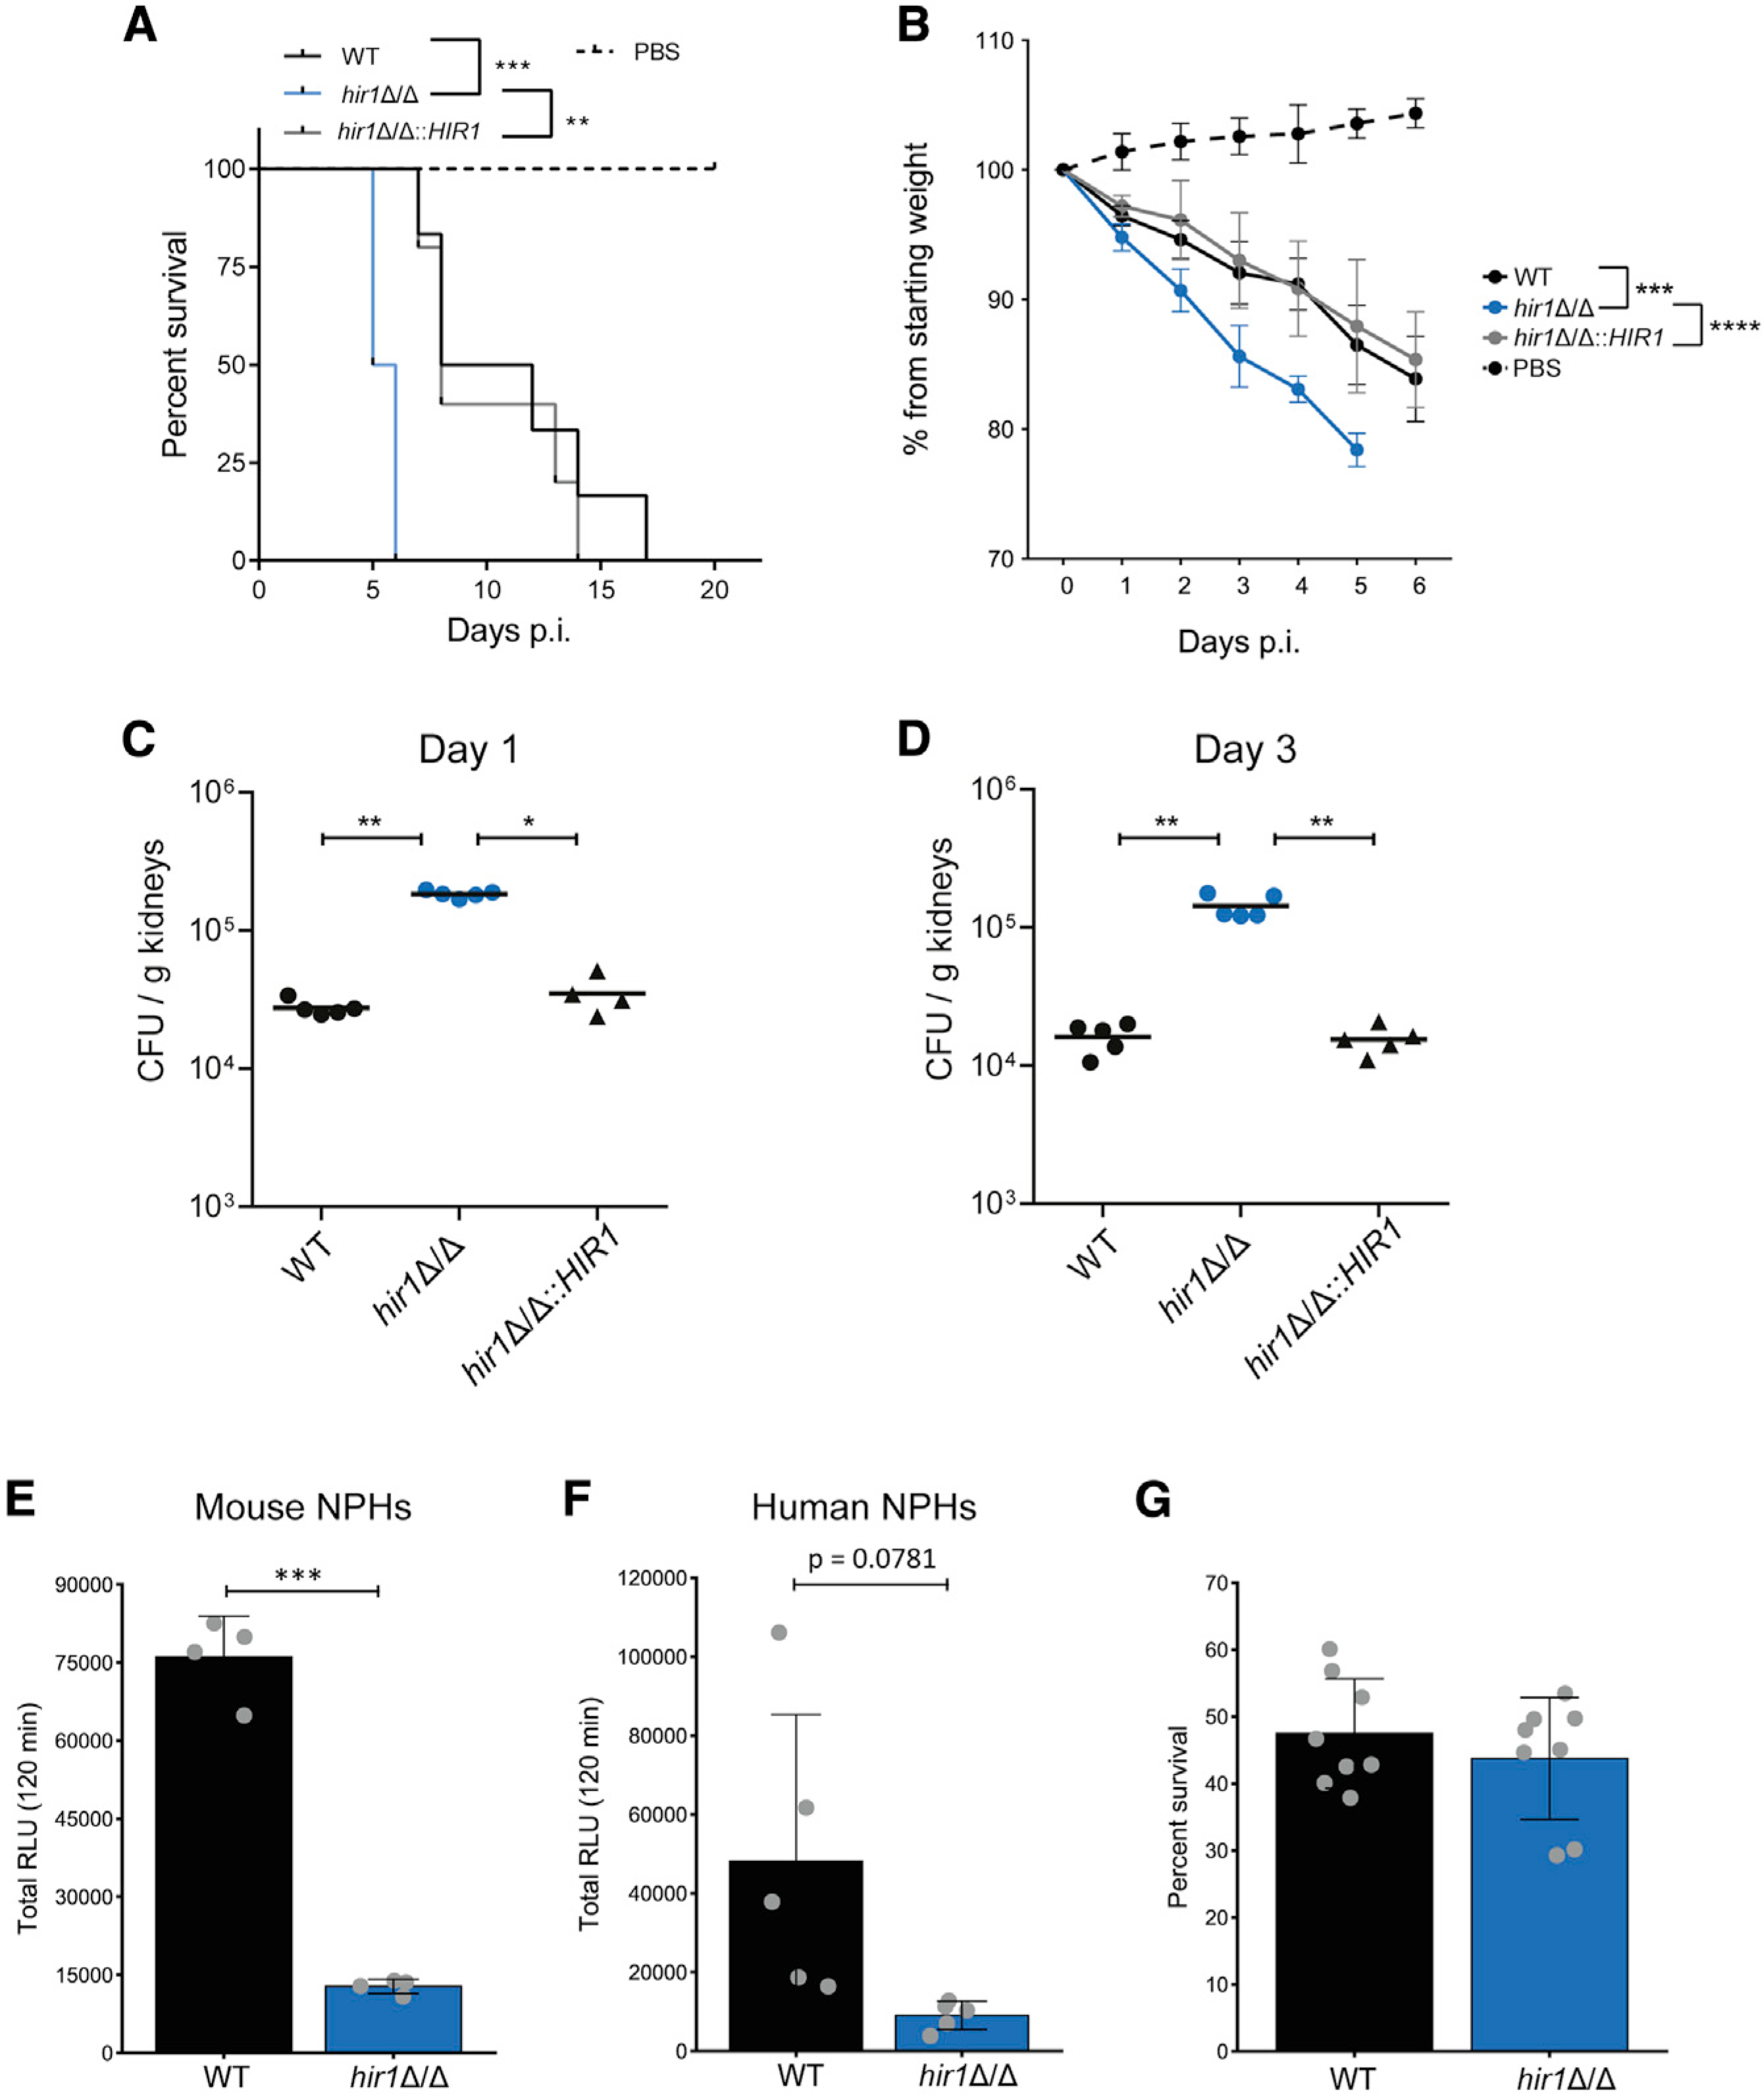
Adaptation to changing environments and immune evasion is pivotal for fitness of pathogens. Yet, the underlying mechanisms remain largely unknown. Adaptation is governed by dynamic transcriptional re-programming, which is tightly connected to chromatin architecture. Here, we report a pivotal role for the HIR histone chaperone complex in modulating virulence of the human fungal pathogen Candida albicans. Genetic ablation of HIR function alters chromatin accessibility linked to aberrant transcriptional responses to protein as nitrogen source. This accelerates metabolic adaptation and increases the release of extracellular proteases, which enables scavenging of alternative nitrogen sources. Furthermore, HIR controls fungal virulence, as HIR1 deletion leads to differential recognition by immune cells and hypervirulence in a mouse model of systemic infection. This work provides mechanistic insights into chromatin-coupled regulatory mechanisms that fine-tune pathogen gene expression and virulence. Furthermore, the data point toward the requirement of refined screening approaches to exploit chromatin modifications as antifungal strategies.

Keywords: Candida albicans; extracellular proteases; fungal pathogen; histone chaperone; hypervirulence; immune recognition; metabolic genes; nitrogen assimiliation; systemic infections.


Conflict of interest statement

Declaration of interests The authors declare no competing interests.

Figures

Figure 1.
Figure 1.. Deletion of HIR1 drives proteolytic activities
(A) Spot dilution assay on SC agar medium ±10% FCS. Images were taken after 1 day at 30°C and are representative of 3 biological replicates. Brightness (−50) and contrast (+20) were adjusted. (B) Images of colony spots after 3 days at 30°C and are representative of 3 biological replicates. (C) Growth of the indicated C. albicans strains in liquid YCB-BSA at 30°C. See also Figure S1E. Graphs show the mean (solid dots) and single measurements (opaque dots) from 2 biological replicates. (D) Growth of C. albicans in YNB supplemented with the indicated percentage of BSA at 30°C. Colors of the heatmap indicate mean OD600 values from 3–4 biological replicates. (E) Azocasein assay with YCB-BSA 24 h culture supernatants heat-treated (65°C, 10 min) or not treated prior the assay. Graphs show the mean ± SD from 2–4 biological replicates. ***p < 0.001 with Student’s t test after equal variance testing (F test). (F) Coomassie staining of supernatants from 16 h YCB-BSA cultures, non-treated or treated with 0.01% sodium azide (NaN3) or 1 μM PepstatinA (PepA). The arrow indicates full-length BSA. The gel image is representative of 2 biological replicates. (G) Growth of the indicated C. albicans strains and clinical isolates in liquid YCB-BSA at 30°C. See also Figure S1F. Graphs show the mean (solid dots) and single measurement values (opaque dots) from 2 biological replicates. (H) Images of colony spots as in (B) after 4 days at 30°C, which are representative of 2 biological replicates. w, with; wo, without. See also Figure S1.
Figure 2.
Figure 2.. Hir1 is required for transcriptional adaptation to protein as the major nitrogen source
(A and B) The log2-fold change in mRNA abundance in the WT (x axis) is plotted against the log2-fold change in mRNA levels in hir1Δ/Δ cells (y axis) after 8 h of growth in YCB-BSA (t8) relative to YPD growth (t8 versus t0; A) or after 8 h growth in YCB-BSA relative to 4 h in YCB-BSA (t8 versus t4; B). Turquoise dots represent DEGs (FDR <0.05) in hir1Δ/Δ versus WT at t8. Dashed gray lines indicate log2-fold changes of 0.58 and −0.58. Linear regression lines are indicated. The Pearson’s correlation coefficient (R) and the corresponding p value are shown. (C and D) The average log2 cpm value (x axis) is plotted against the log2-fold change in mRNA abundance between hir1Δ/Δ and WT cells at t0 (C) or t8 (D). Selected genes involved in nitrogen metabolism with differential expression (FDR <0.05) are highlighted. Gray dashed lines indicate log2-fold changes of 0.58 and −0.58. (E) Heatmap showing genes related to nitrogen metabolism differentially expressed at least at one of the tested growth conditions. DEG, differentially expressed gene; cpm, counts per million reads; FDR, false discovery rate; t0 (YPD), t4 (YCB-BSA 4 h), t8 (YCB-BSA 8 h). See also Figure S2.
Figure 3.
Figure 3.. Hir1 controls chromatin accessibility of loci related to nitrogen metabolism
(A) Volcano plot depicting the log2-fold change in ATAC-seq peak signals after 4 h in YCB-BSA (t4; x axis) between the WT and hir1Δ/Δ cells. Each dot represents one ATAC-seq peak, which was annotated to the next adjacent gene. Turquoise color indicates selected genes involved in nitrogen metabolism. The gray dashed line represents a FDR of 0.05. The number insert illustrates the number of significantly up- or downregulated peaks (FDR <0.05). (B) Heatmap of genes involved in nitrogen metabolism with differential ATAC-seq peak signals (peaks located max. 2 kb upstream the TSS; FDR <0.05) during at least one growth condition. (C) Normalized ATAC-seq reads from cells grown in YPD (t0) plotted as coverage tracks around the TSS of all genes that are transcriptionally upregulated (FDR <0.05 and log2-fold change >0.58; top graph) or not differentially expressed (FDR >0.05; bottom graph) in hir1Δ/Δ versus WT after 8 h growth in YCB-BSA medium (t8). (D) Heatmaps of selected genes related to nitrogen sensing and assimilation. The colored code indicates whether a gene is differentially regulated (FDR <0.05) in the RNA-seq and ATAC-seq dataset at any (RNA-seq) or the indicated time point (ATAC-seq). FDR, false discovery rate; TSS, transcription start site; DEG, differentially expressed gene; ns, not significant (FDR >0.05); nd, not detected; degr., degradation; Transcr. reg, transcriptional regulation. See also Figure S3.
Figure 4.
Figure 4.. Hir1-mediated proteolytic activity is linked to Sap2 and SPS-sensor control
(A) Colony spot assay on YCB-BSA agar plates after 4 days at 30°C. Images are representative of 3 biological replicates. (B and C) C. albicans growth in liquid YCB-BSA at 30°C. The indicated genotypes were analyzed always together in one experiment but were split into (B) and (C) for clarity. Graphs show the mean (solid dots) and single measurements (opaque dots) from 2 biological replicates. (D and E) Quantitative real-time PCR analysis of SAP2 (D) and SAP3 (E) relative to the reference gene (RG) PAT1 after 8 h in YNB-BSA with or without 20 mM ammonium sulfate (+ NH4+) at 30°C. Graphs show the mean ± SD from 4 biological replicates. ns = p > 0.05, *p < 0.05, **p < 0.01 with one-way ANOVA followed by Tukey’s multiple comparison. (F) Quantitative real-time PCR analysis of STP1 expression relative to PAT1 in YNB-BSA. Graphs show the mean ± SD from 3 biological replicates. Indicated p values were calculated with Student’s t test after equal variance testing (F test). (G) Immunoblot analysis of 3xHA-tagged Stp1 during growth in YNB-BSA at 30°C. Immunoblot is representative of 3 biological replicates. The full-length and processed forms of Stp1–3xHA are schematically depicted. Untagged strains grown for 2 h in YNB-BSA served as control (ctrl). (H) Growth in liquid YCB-BSA at 30°C. Graphs show the mean ± SD from 3 biological replicates. ****p < 0.0001 with one-way ANOVA followed by Tukey’s multiple comparison test at the 48 h time point after testing for equal variances (Bartlett’s test). See also Figure S4.
Figure 5.
Figure 5.. Hir1 affects fungal recognition by macrophages in vitro
(A and B) GO enrichment analysis of ATAC-seq peaks (A) and RNA-seq signals (B) differentially regulated (FDR <0.05) in hir1Δ/Δ cells during growth in YPD. The GeneRatio denotes the number of genes enriched in the depicted GO term relative to the total number of input genes. The number of genes from the input dataset relative to the total number of genes associated with the plotted GO category is depicted. (C–E) ROS assay of BMDMs challenged with the indicated strains, depicted as RLU per minute per 1,000 BMDMs over time (C) or as the total RLU after the indicated time (D and E). Graphs show the mean ± SD from 3–4 biological replicates. *p < 0.05, **p < 0.01 with one-way ANOVA followed by Tukey’s multiple comparison test after testing for equal variances (Bartlett’s test) for (D) and with Student’s t test after testing for equal variances (F-test) in (E). (F) Immunoblot analysis of phosphorylated p40phox in BMDMs challenged with the indicated fungal strains or PBS. Blot is representative of 3 biological replicates. (G) ROS assay of BMDMs infected with heat-killed C. albicans. Graphs show the mean ± SD from 3 biological replicates. (H) ROS assay of BMDMs challenged with different fungal genotypes presented as RLU per minute per 1,000 BMDMs over time. Results are representative of 3 biological replicates. FDR, false discovery rate; BMDMs, bone-marrow-derived macrophages; RLU, relative luciferase units. See also Figure S5.
Figure 6.
Figure 6.. Deletion of hir1Δ/Δ alters in vivo host responses during acute infection
(A–C) Number of CD45+ cells (A), neutrophils (CD11b+ Ly6G+; B), and Cd11b+ Ly6Chi cells (C) in the peritoneum after 4 h of intraperitoneal (i.p.) mouse infection with the indicated fungal strain or PBS. Boxplots indicate median values (horizontal line), first and third quartiles (top and bottom hinges, respectively) with the whiskers extending 1.5-fold of the inter-quartile range. Data represent 13 (WT infected), 11 (hir1Δ/Δ infected), or 2 (PBS) animals pooled from 3 independent experiments. p values are derived from Student’s t test after equal variance testing (F test). (D and E) Quantitative real-time PCR analysis for Cxcl2 (D) and Il1b (E) expression (relative to Actb [β-actin]) in peritoneal cells after 4 h of i.p. infection. Graphs show the mean value ± SD from 6–7 animals. Data are pooled from 2 independent experiments. *p < 0.05 with Student’s t test after equal variance testing (F test). NPHs, neutrophils; MPHs, macrophages. See also Figure S6.
Figure 7.
Figure 7.. HIR1-deficient C. albicans is hypervirulent in vivo
(A) Mouse survival after intravenous (i.v.) challenge with 5–6 mice per fungal infection group and with 2 mice for the PBS control. **p < 0.01, ***p < 0.001 with Mantel Cox log-rank test. (B. Mouse weights corresponding to the experiment in A. Graph shows the mean ± SD. ***p < 0.001, ****p < 0.0001 with two-way repeated-measures ANOVA followed by Tukey’s multiple comparison test for weight loss within the first 4 days. (C and D) Fungal burdens in kidneys at day 1 (C) and day 3 (D) post-i.v. infection. Each symbol corresponds to one animal. Horizontal lines indicate the mean from 4–5 animals. *p < 0.05, **p < 0.01 with Mann-Whitney U test). (E and F) ROS assay of bone-marrow-derived murine neutrophils (E) or human neutrophils (F). Graphs show the mean ± SD from 4 replicates pooled from 2 independent experiments (E) or 5 blood donors (F). ***p < 0.001 with Student’s t test after equal variance testing (F-test). (G) Fungal survival after 1 h of co-culture with bone marrow-derived murine neutrophils. Graphs show the mean ± SD from 8 replicates pooled from 4 independent experiments. CFUs, colony forming units; NPHs, neutrophils. See also Figure S7.

Similar articles

Cited by

References

    1. Altmeier S, Toska A, Sparber F, Teijeira A, Halin C, and LeibundGut-Landmann S (2016). IL-1 Coordinates the Neutrophil Response to C. albicans in the Oral Mucosa. PLoS Pathog. 12, e1005882. - PMC - PubMed
    1. Alves R, Barata-Antunes C, Casal M, Brown AJP, Van Dijck P, and Paiva S (2020). Adapting to survive: How Candida overcomes host-imposed constraints during human colonization. PLoS Pathog. 16, e1008478. - PMC - PubMed
    1. Amin AD, Vishnoi N, and Prochasson P (2013). A global requirement for the HIR complex in the assembly of chromatin. Biochim. Biophys. Acta 1819, 264–276. - PubMed
    1. Anders S, Pyl PT, and Huber W (2015). HTSeq–a Python framework to work with high-throughput sequencing data. Bioinformatics 31, 166–169. - PMC - PubMed
    1. Andréasson C, Heessen S, and Ljungdahl PO (2006). Regulation of transcription factor latency by receptor-activated proteolysis. Genes Dev. 20, 1563–1568. - PMC - PubMed

Publication types

MeSH terms