. 2021 Jul 20;36(3):109422.
doi: 10.1016/j.celrep.2021.109422.

Immune mechanisms orchestrate tertiary lymphoid structures in tumors via cancer-associated fibroblasts

Affiliations

Immune mechanisms orchestrate tertiary lymphoid structures in tumors via cancer-associated fibroblasts

Anthony B Rodriguez et al. Cell Rep. .

Abstract

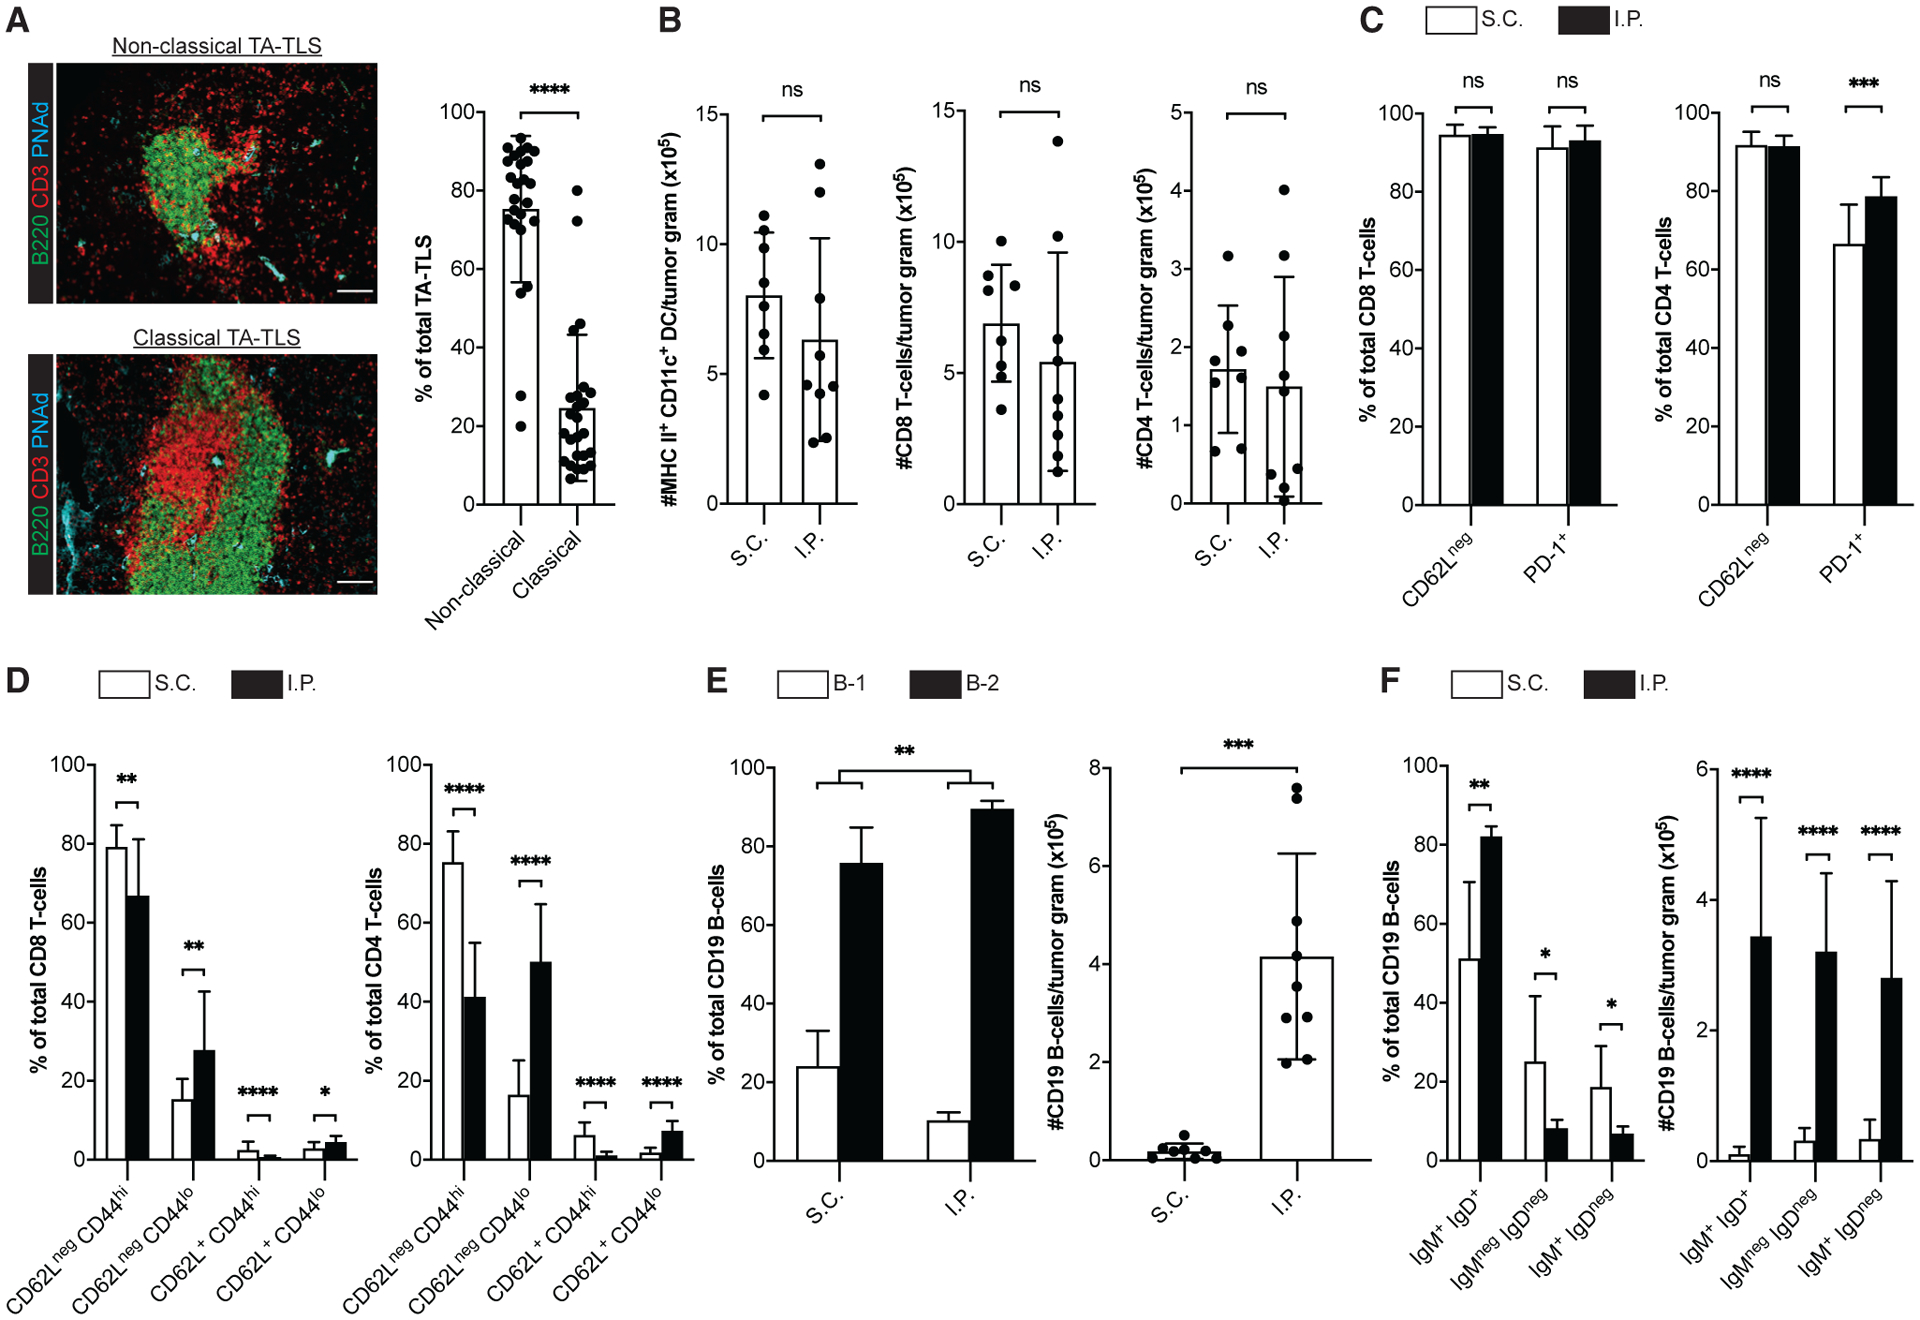
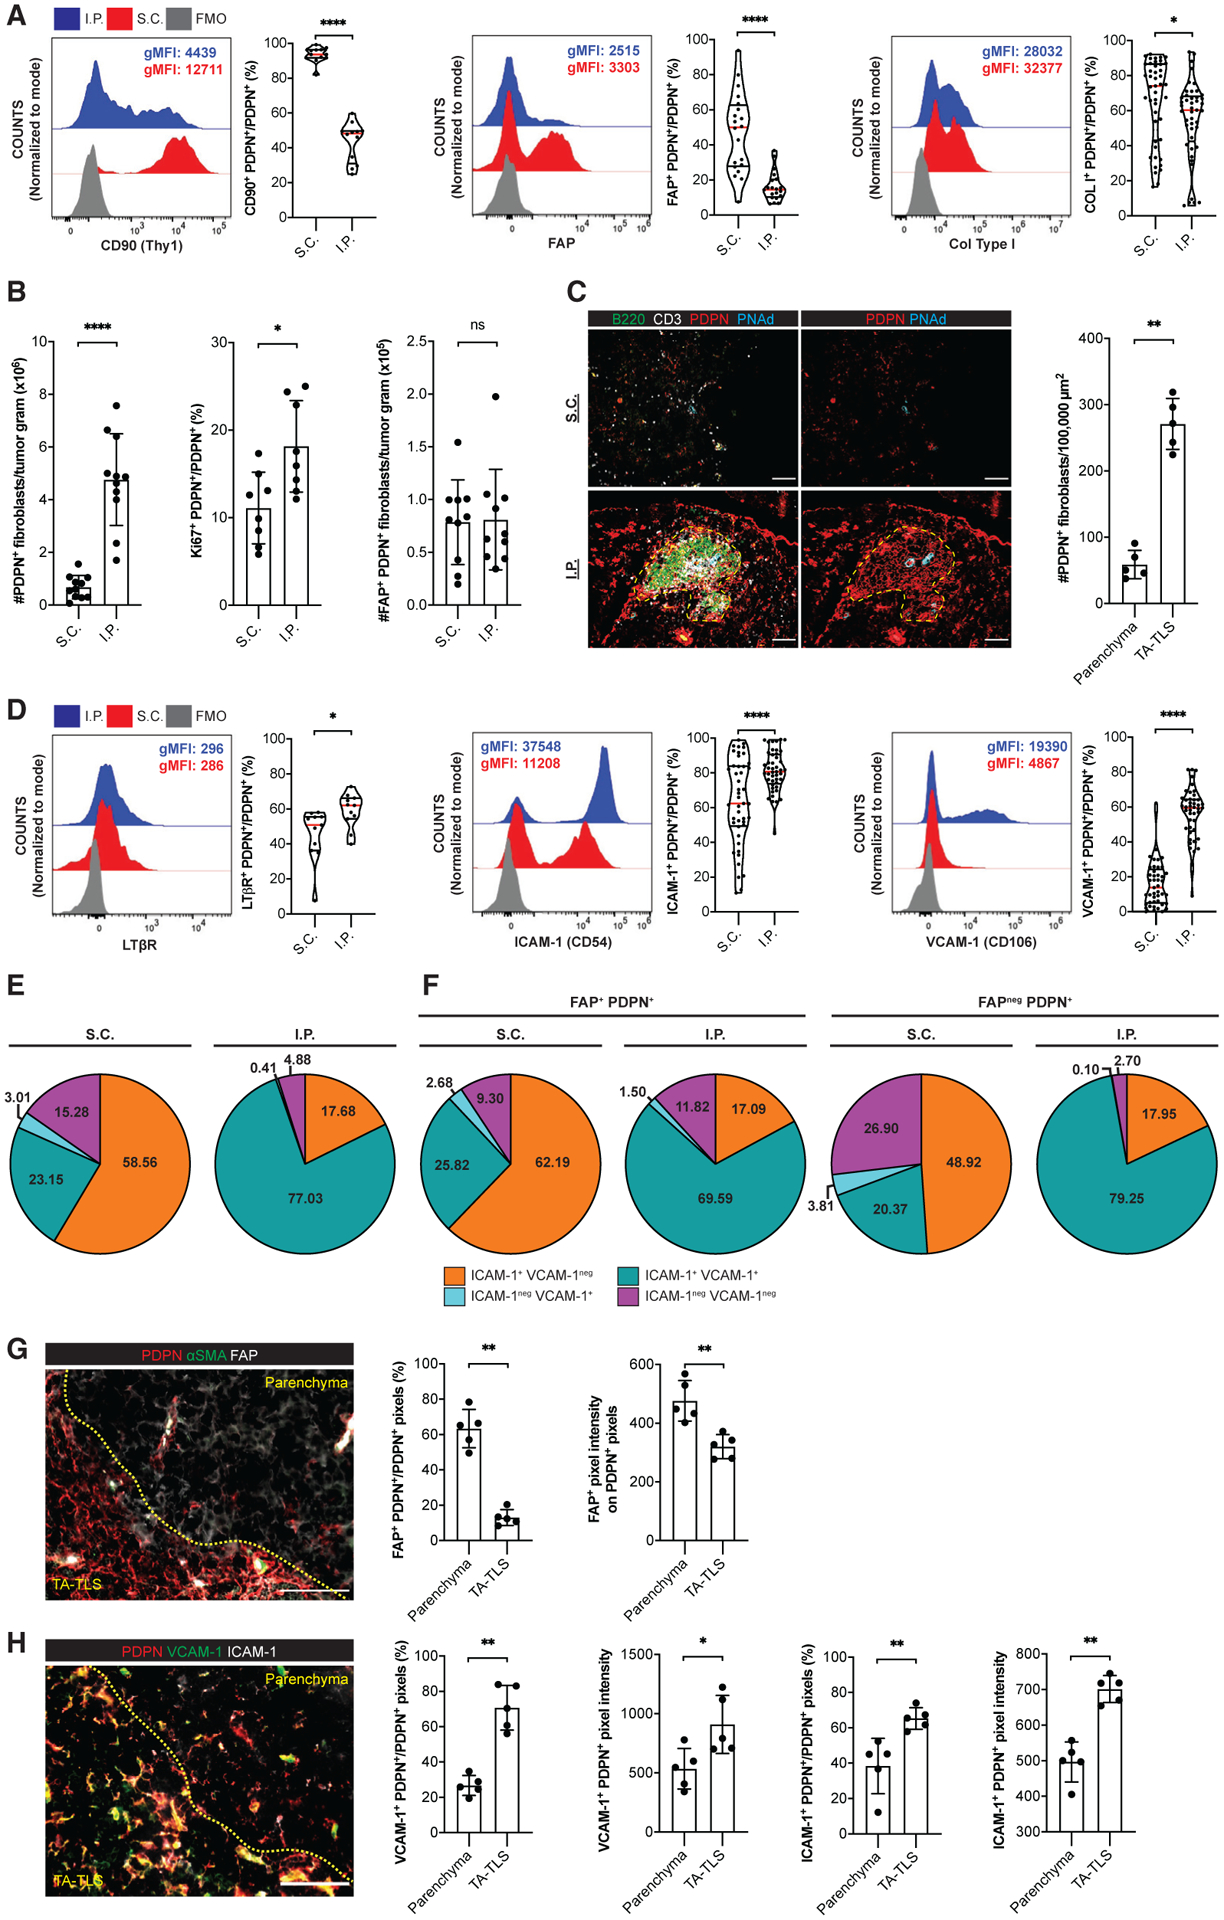
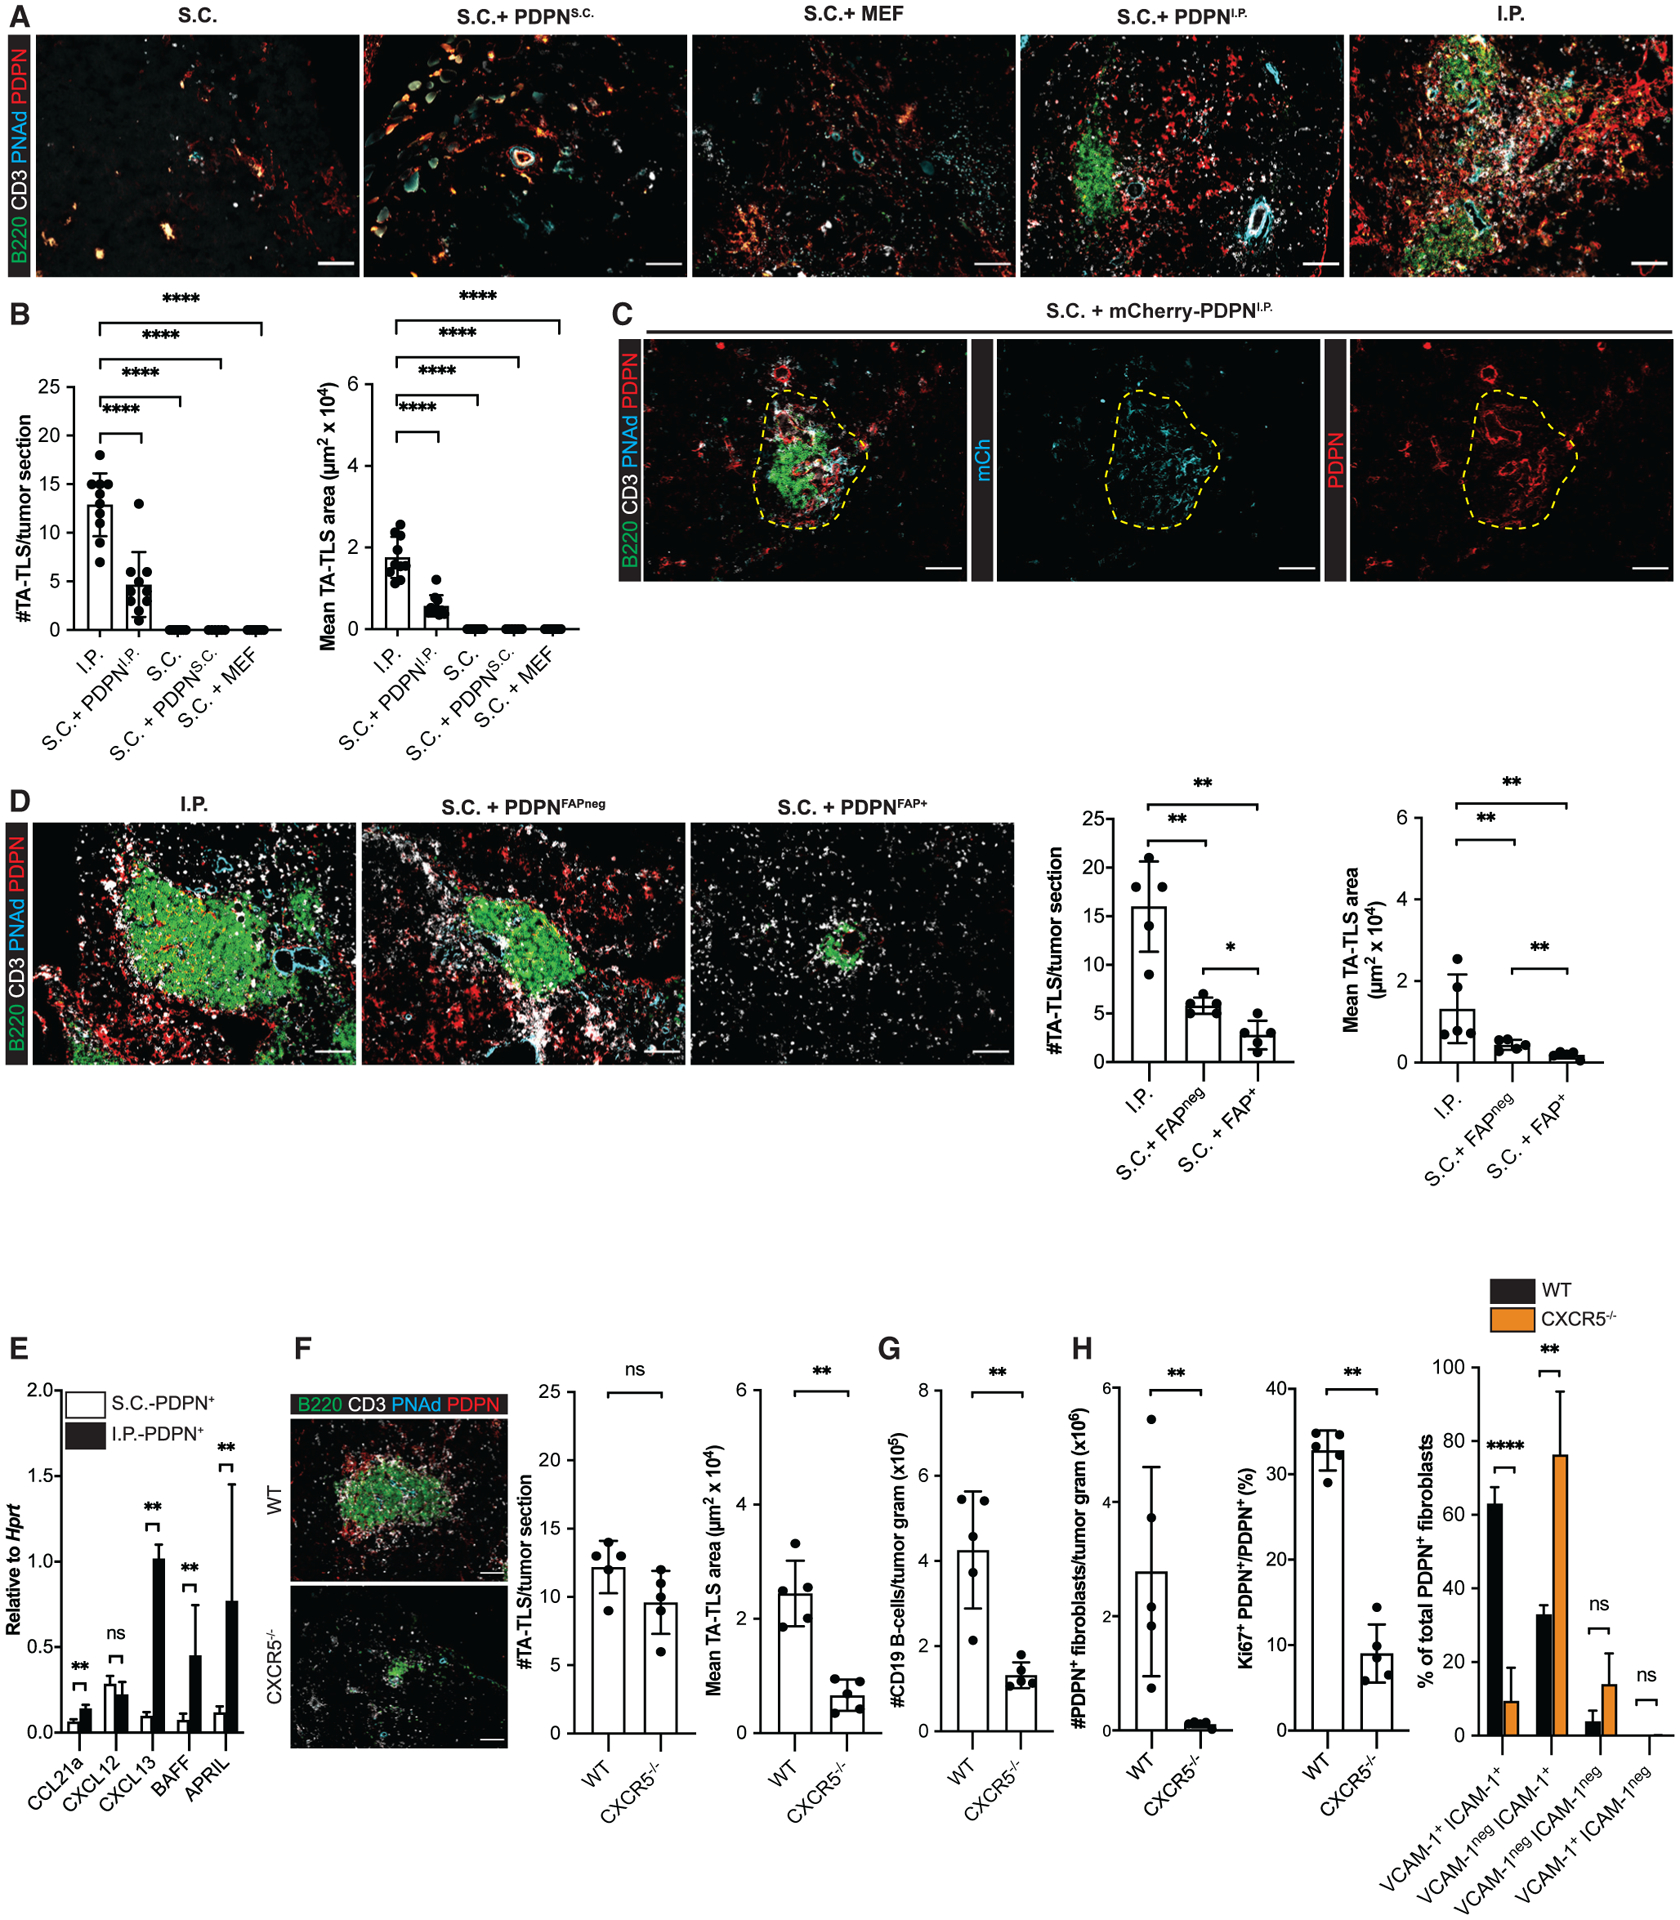
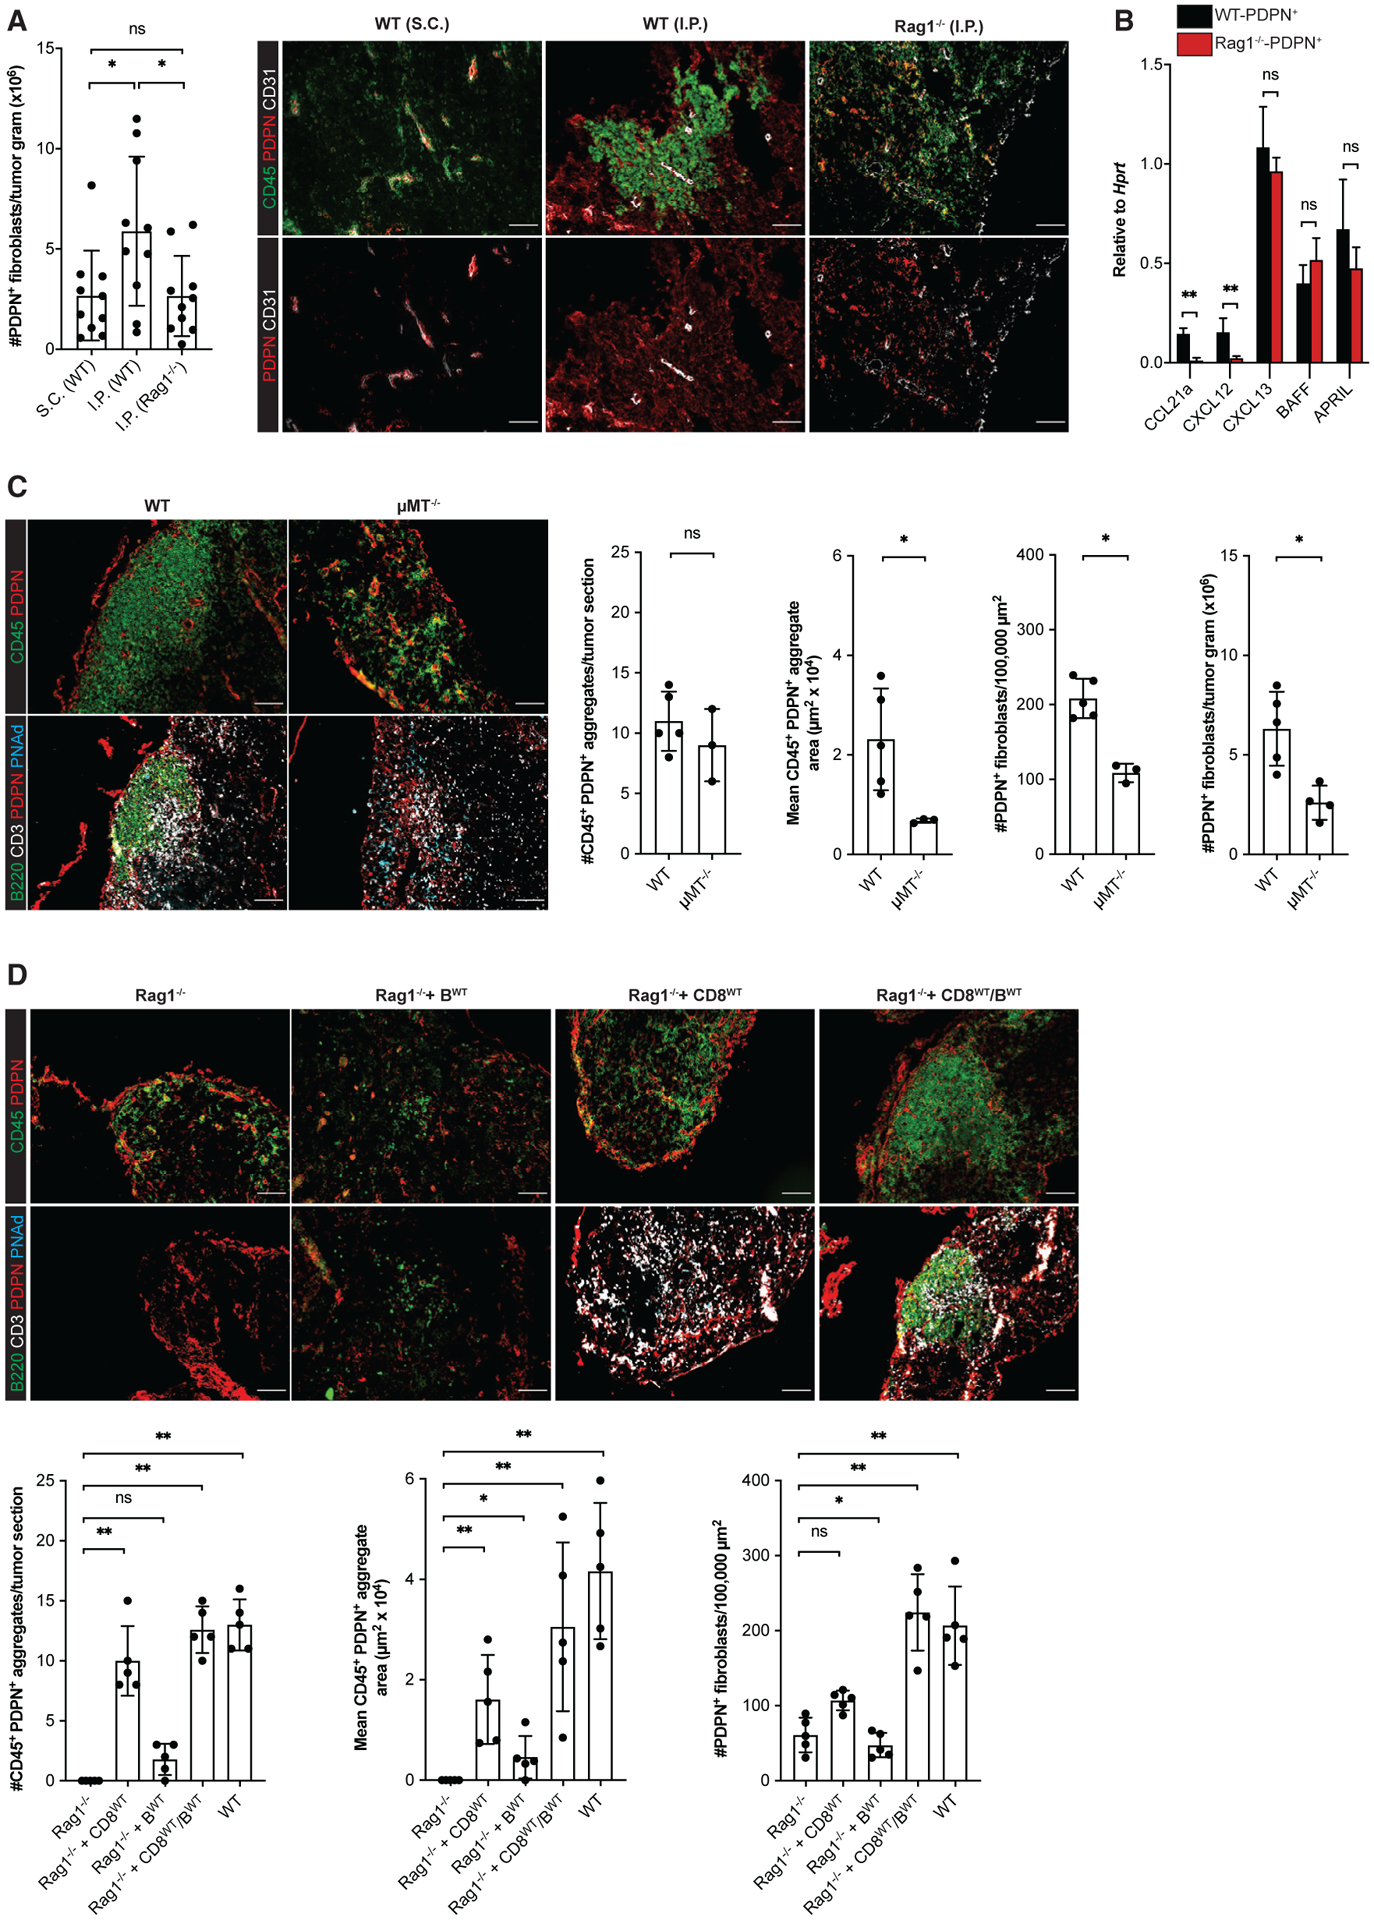
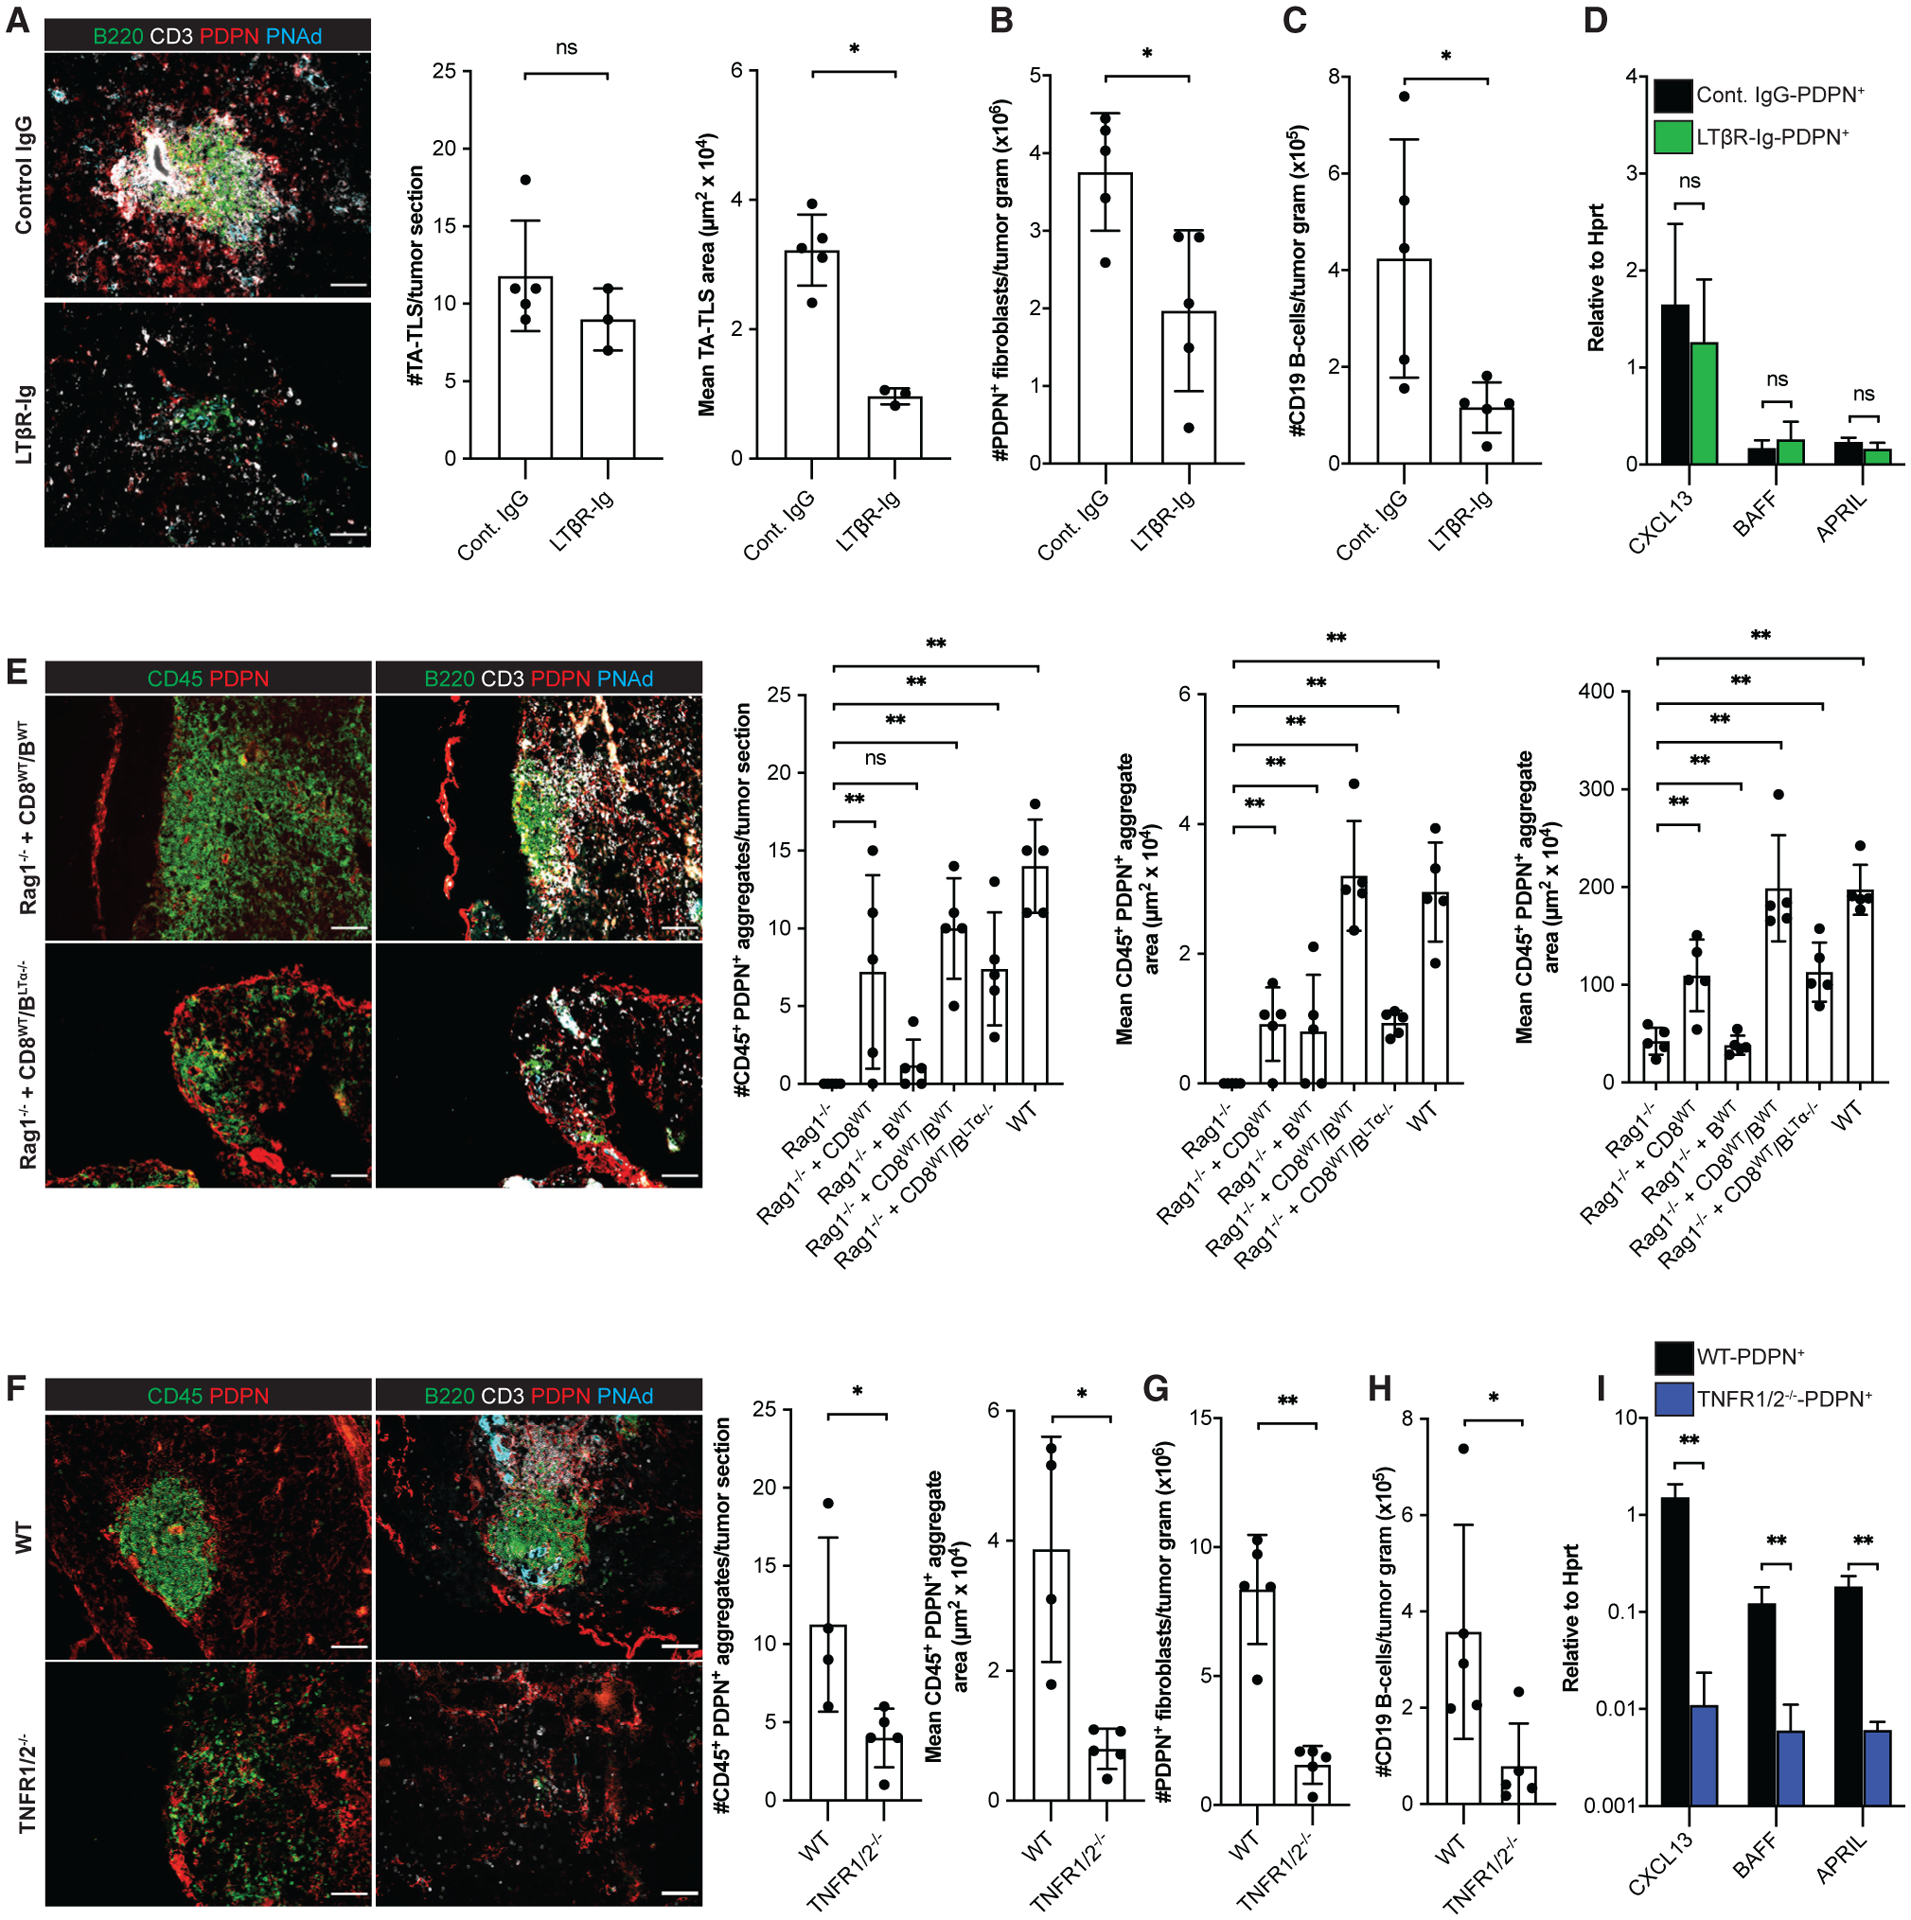
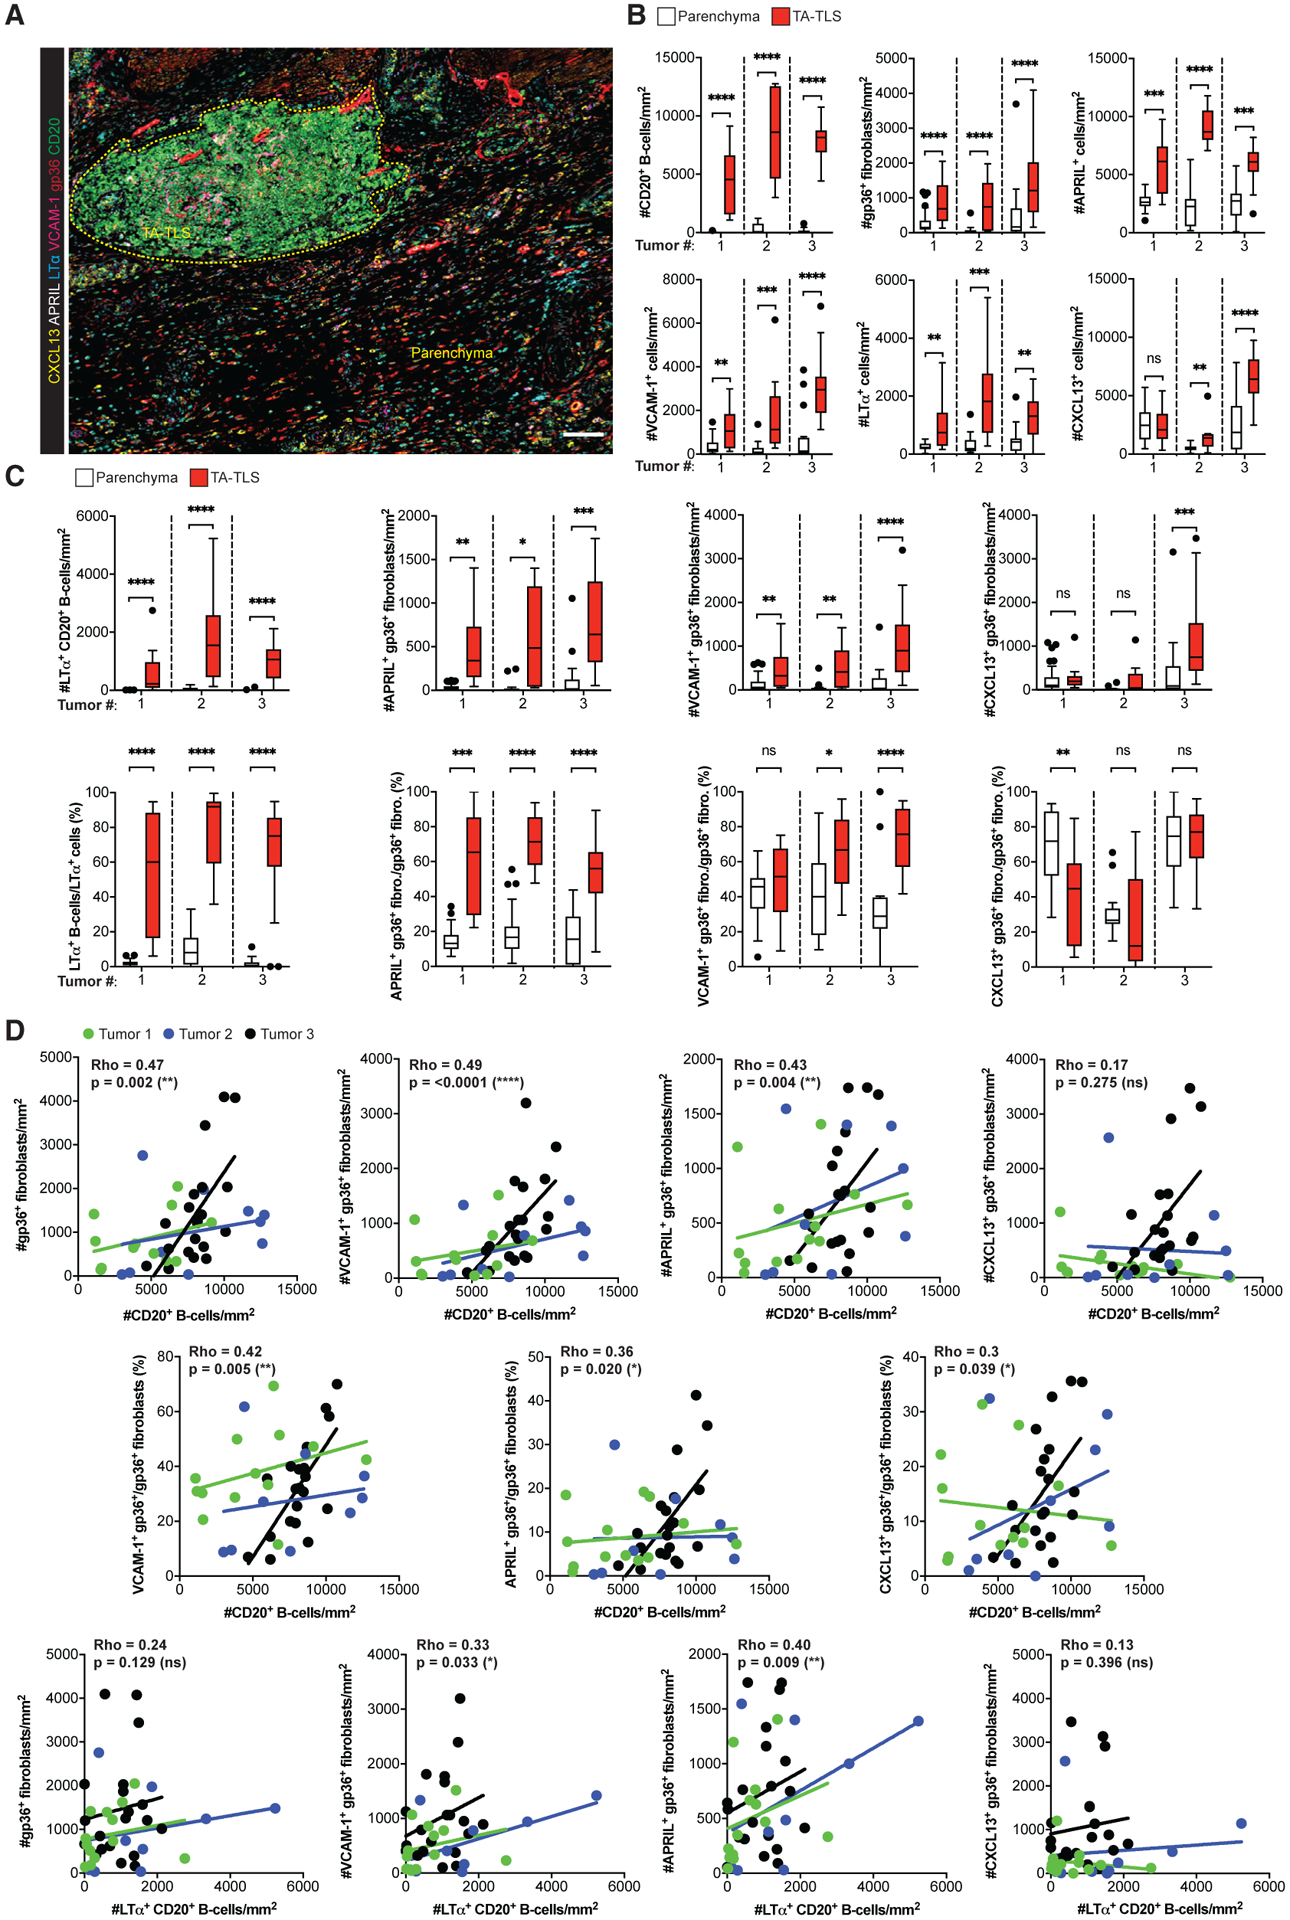
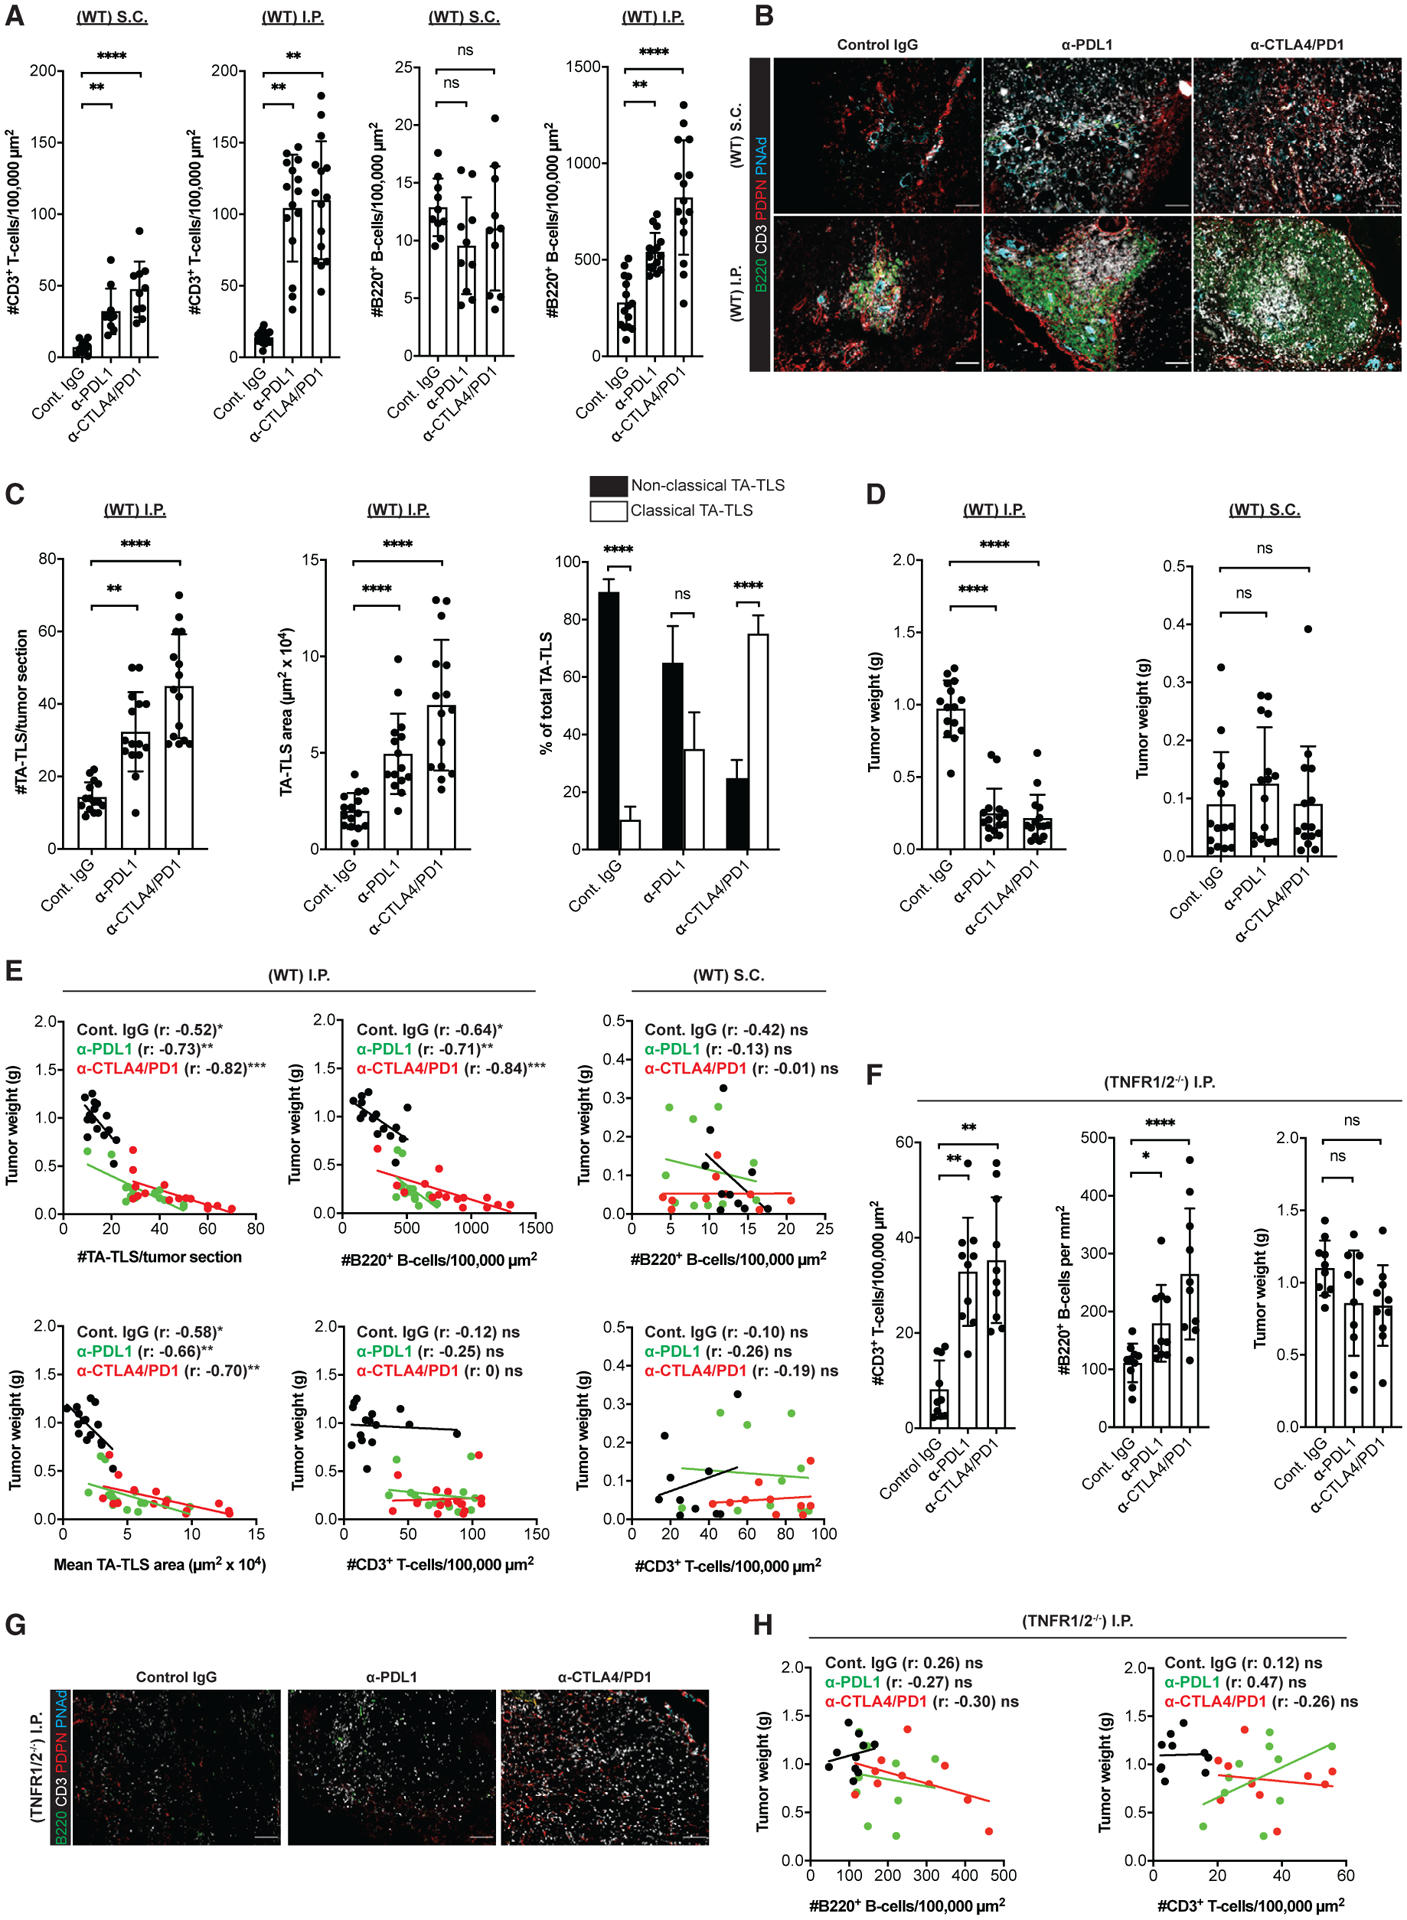
Tumor-associated tertiary lymphoid structures (TA-TLS) are associated with enhanced patient survival and responsiveness to cancer therapies, but the mechanisms underlying their development are unknown. We show here that TA-TLS development in murine melanoma is orchestrated by cancer-associated fibroblasts (CAF) with characteristics of lymphoid tissue organizer cells that are induced by tumor necrosis factor receptor signaling. CAF organization into reticular networks is mediated by CD8 T cells, while CAF accumulation and TA-TLS expansion depend on CXCL13-mediated recruitment of B cells expressing lymphotoxin-α1β2. Some of these elements are also overrepresented in human TA-TLS. Additionally, we demonstrate that immunotherapy induces more and larger TA-TLS that are more often organized with discrete T and B cell zones, and that TA-TLS presence, number, and size are correlated with reduced tumor size and overall response to checkpoint immunotherapy. This work provides a platform for manipulating TA-TLS development as a cancer immunotherapy strategy.

Keywords: B lymphocytes; B16 melanoma; CD8 T lymphocytes; cancer-associated fibroblasts; checkpoint blockade immunotherapy; lymphoid tissue inducer cell; lymphoid tissue organizer cell; lymphotoxin-β receptor; tertiary lymphoid structure; tumor necrosis factor receptor.


Conflict of interest statement

Declaration of interests The authors declare no competing interests.

Figures

Figure 1.
Figure 1.. TA-TLSs in I.P. tumors are associated with enhanced representations of distinctly differentiated T cells and naive B cells
(A–F) Day 14 S.C. or I.P. B16-OVA tumors from C57BL/6 (WT) mice were prepared for IF (A) or flow cytometry (B–F) as described in STAR Methods. (A) Representative images and summary data for TA-TLS organizational types in I.P. tumors. Scale bar: 100 μm. Data are from five experiments; n = 25 tumors. (B–F) CD45+ single-cell suspensions were stained with the indicated markers to define subpopulations (DC = CD3neg CD19neg CD11c+ MHC II+; T cells = CD19neg CD3+ CD8+ or CD4+; B cells = CD3neg CD19+ CD5+ or CD5neg) and activation state and were quantitated by flow cytometry. Data are from two to five experiments; n = 8–18 tumors per group. Results are mean ± standard deviation (SD), analyzed by unpaired Welch’s t test. nsp > 0.05, *p < 0.05, **p < 0.01, ***p < 0.001, ****p < 0.0001.
Figure 2.
Figure 2.. A population of CAF from I.P. tumors exhibit lymphoid tissue organizer cell characteristics
(A–E, G, and H) Day 14 S.C. or I.P. B16-OVA tumors from WT mice were prepared for flow cytometry (A, B, D, and E) or IF (C, G, and H) as described in STAR Methods. (A and D) Left, representative histograms and geometric mean fluorescence intensities (gMFIs) of indicated markers on PDPNhi CD31neg CD45neg Ter119neg CAF. gMFIs calculated on cells gated above the fluorescence minus one (FMO) control. Right, percentage of CAF expressing indicated markers. Data are from two to five experiments; n = 11–45 tumors per group. (B, E, and F) CAF subpopulations were quantitated by flow cytometry. Data are from two to three experiments; n = 8–11 tumors per group. (C, G, and H) Left, representative images of tumors stained with indicated markers. Yellow dashes delimit TA-TLS area. Scale bar: 100 μm. Right, summary data of PDPN+ CAF densities (C) and marker expression in parenchymal and TA-TLS regions (G and H) from one experiment; n = 5 tumors per group. Pixel intensities were calculated using a PDPN mask. Results are mean ± SD analyzed by unpaired Welch’s t test. nsp > 0.05, **p < 0.01, ***p < 0.001, ****p < 0.0001.
Figure 3.
Figure 3.. CAF act as surrogate lymphoid tissue organizer cells that orchestrate TA-TLS formation
(A–D) S.C. tumors were induced by co-injection of B16-OVA cells together with the indicated populations of fibroblasts. Day 14 S.C. or I.P. tumors were prepared for IF as described in STAR Methods. (A, C, and D, left) Representative images. Yellow dashed region (C) represents TA-TLS area. Scale bar: 100 μm. (B and D, right) Summary data from one to two experiments; n = 5 or 10 tumors per group. (E) CAF from day 14 S.C. and I.P. tumors were purified, and expression of the indicated RNA transcripts was determined as described in STAR Methods. Data from two experiments presented as 2−ΔCT relative to Hprt; n = 6 tumors per group. (F–H) Day 14 I.P. tumors from WT or CXCR5−/− mice were prepared for IF (F) or flow cytometry (G and H) as described in STAR Methods. (F) Left: representative images. Scale bar: 100 μm. Right: summary data from one experiment; n = 5 tumors per group. (G and H) Cell populations were quantitated as outlined in Figures 1 and 2. Data represent one experiment; n = 5 tumors per group. Results are mean ± SD, analyzed using Kruskal-Wallis H test with Dunn’s post-test (B and D) or unpaired Welch’s t test (E–H). nsp > 0.05, *p < 0.05, **p < 0.01, ****p < 0.0001.
Figure 4.
Figure 4.. CD8 T cells and B cells act coordinately as lymphoid tissue inducer cells driving TA-TLS development
(A, C, and D) Day 14 I.P. B16-OVA tumors from WT mice, μMT−/− mice, Rag1−/− mice, and Rag1−/− mice repleted with CD8 T cells and/or B cells 3 days prior to tumor implantation were prepared for and analyzed by flow cytometry or IF as described in STAR Methods. Scale bars: 100 μm. Data are from one to two experiments; n = 3–10 tumors per group. (B) CAF from day 14 i.p. tumors from WT or Rag1−/− mice were purified, and expression of the indicated RNA transcripts was determined as described in STAR Methods. Data from two experiments presented as 2−ΔCT relative to Hprt; n = 6 tumors per group. Results are mean ± SD analyzed using Kruskal-Wallis H test with Dunn’s post-test (A and D) or unpaired Welch’s t test (B and C). nsp > 0.05, *p < 0.05, **p < 0.01, ****p < 0.0001.
Figure 5.
Figure 5.. Induction and robust development of PDPN+ reticular networks in TA-TLS are regulated by TNFR and LTbR signaling, respectively
Day 14 I.P. B16-OVA tumors from WT mice, WT mice treated with LTβR-Ig fusion protein, TNFR1/2−/− mice, Rag1−/− mice, and Rag1−/− mice repleted with CD8 T cells and/or B cells 3 days prior to tumor implantation were analyzed by IF or flow cytometry as described in STAR Methods. (A, E, and F) Scale bars: 100 μm. Data are from one experiment; n = 3–5 tumors per group. (B, C, G, and H) Data are from one experiment; n = 5 tumors per group. (D and I) CAF from day 14 i.p. tumors from WT mice, WT mice treated with LTβR-Ig, or TNFR1/2−/− mice were purified and expression of the indicated RNA transcripts determined as described in STAR Methods. Data are from two experiments presented as 2−ΔCT relative to Hprt; n = 6 tumors per group. Results are mean ± SD analyzed using unpaired Welch’s t test (A–D and F–I) or Kruskal-Wallis H test with Dunn’s post-test (E). nsp > 0.05, *p < 0.05, **p < 0.01.
Figure 6.
Figure 6.. Human TA-TLS are associated with LT+ B cells and a co-extensive reticular network of CAF with lymphoid tissue organizer characteristics
Human melanoma biopsies containing TA-TLS were collected, prepared, stained, and analyzed as described in STAR Methods. (A) Representative image of a TA-TLS-containing melanoma sample. Dashed yellow line represents TA-TLS area. Scale bar: 100 μm. (B and C) Densities and percentages of single- (B) and dual-stained (C) cell populations in parenchyma and TA-TLS regions of tumors from three patients (n = 12–39 parenchyma and TA-TLS regions of interest). Data were analyzed by Wilcoxon rank-sum test, and boxplots were generated according to Tukey’s method. (D) Correlations between density of B cell populations and density or fraction of fibroblast populations. Dots represent individual TA-TLS. Each line represents the correlation for an individual tumor. Rho represents the multilevel correlation coefficient for the three tumors. Spearman’s linear mixed-models multilevel correlation analysis was determined for all tumors together to account for the nested data structure. nsp > 0.05, *p < 0.05, **p < 0.01, ***p < 0.001, ****p < 0.0001.
Figure 7.
Figure 7.. TA-TLS number, size, and organization are augmented by checkpoint immunotherapy and correlated with tumor control
WT or TNFR1/2−/− mice were treated with control IgG, anti-PDL1, or anti-CTLA4/PD1 beginning 3 days after S.C. or I.P. tumor implantation. Tumors were harvested on day 14, weighed, and prepared for IF. (A) Summary data for intratumoral parenchymal (non-TA-TLS) T and B cell densities in WT mouse tumors. (B) Representative images showing typical TA-TLS size and organization in tumors from WT mice treated as indicated. Scale bar: 100 μm. (C) Summary data of TA-TLS characteristics in tumors from WT mice. Classical TA-TLS are distinguished from non-classical by the presence of distinct T and B cell compartments. (D) Tumor weights determined at harvest on day 14. (E) Spearman correlation analysis of WT mouse tumor weights with TA-TLS number, size, or densities of intratumoral parenchymal T and B cells. Each dot represents an individual tumor. (F) Left and middle: summary data for intratumoral parenchymal (non-TA-TLS) T and B cell densities in TNFR1/2−/− mouse tumors. Right: tumor weights were determined at harvest on day 14. (G) Representative intratumoral images of i.p. tumors from TNFR1/2−/− mice treated as indicated. Scale bars: 100 μm. (H) Spearman correlation analysis of TNFR1/2−/− mouse tumor weights with densities of T and B cells. Each dot represents an individual tumor. (A–E) Data are from two to three experiments; n = 10–15 tumors per group. (F–H) Data are from two experiments; n = 10 tumors per group. Results shown as mean ± SD analyzed using Kruskal-Wallis H test with Dunn’s post-test (A, C, D, and F) or Spearman’s multilevel correlation analysis (E and H). nsp > 0.05, *p < 0.05, **p < 0.01.

References

    1. Barone F, Nayar S, Campos J, Cloake T, Withers DR, Toellner K-M, Zhang Y, Fouser L, Fisher B, Bowman S, et al. (2015). IL-22 regulates lymphoid chemokine production and assembly of tertiary lymphoid organs. Proc. Natl. Acad. Sci. USA 112, 11024–11029. - PMC - PubMed
    1. Bénézech C, Luu N-T, Walker JA, Kruglov AA, Loo Y, Nakamura K, Zhang Y, Nayar S, Jones LH, Flores-Langarica A, et al. (2015). Inflammation-induced formation of fat-associated lymphoid clusters. Nat. Immunol 16, 819–828. - PMC - PubMed
    1. Binder DC, Engels B, Arina A, Yu P, Slauch JM, Fu Y-X, Karrison T, Burnette B, Idel C, Zhao M, et al. (2013). Antigen-specific bacterial vaccine combined with anti-PD-L1 rescues dysfunctional endogenous T cells to reject long-established cancer. Cancer Immunol. Res 1, 123–133. - PMC - PubMed
    1. Bombardieri M, Barone F, Humby F, Kelly S, McGurk M, Morgan P, Challacombe S, De Vita S, Valesini G, Spencer J, and Pitzalis C (2007). Activation-induced cytidine deaminase expression in follicular dendritic cell networks and interfollicular large B cells supports functionality of ectopic lymphoid neogenesis in autoimmune sialoadenitis and MALT lymphoma in Sjögren’s syndrome. J. Immunol 179, 4929–4938. - PubMed
    1. Browning JL, Allaire N, Ngam-Ek A, Notidis E, Hunt J, Perrin S, and Fava RA (2005). Lymphotoxin-beta receptor signaling is required for the homeostatic control of HEV differentiation and function. Immunity 23, 539–550. - PubMed

Publication types

MeSH terms

Substances