

Variability of multi-omics profiles in a population-based child cohort
- PMID: 34289836
- PMCID: PMC8296694
- DOI: 10.1186/s12916-021-02027-z
Variability of multi-omics profiles in a population-based child cohort
Abstract
Background: Multiple omics technologies are increasingly applied to detect early, subtle molecular responses to environmental stressors for future disease risk prevention. However, there is an urgent need for further evaluation of stability and variability of omics profiles in healthy individuals, especially during childhood.
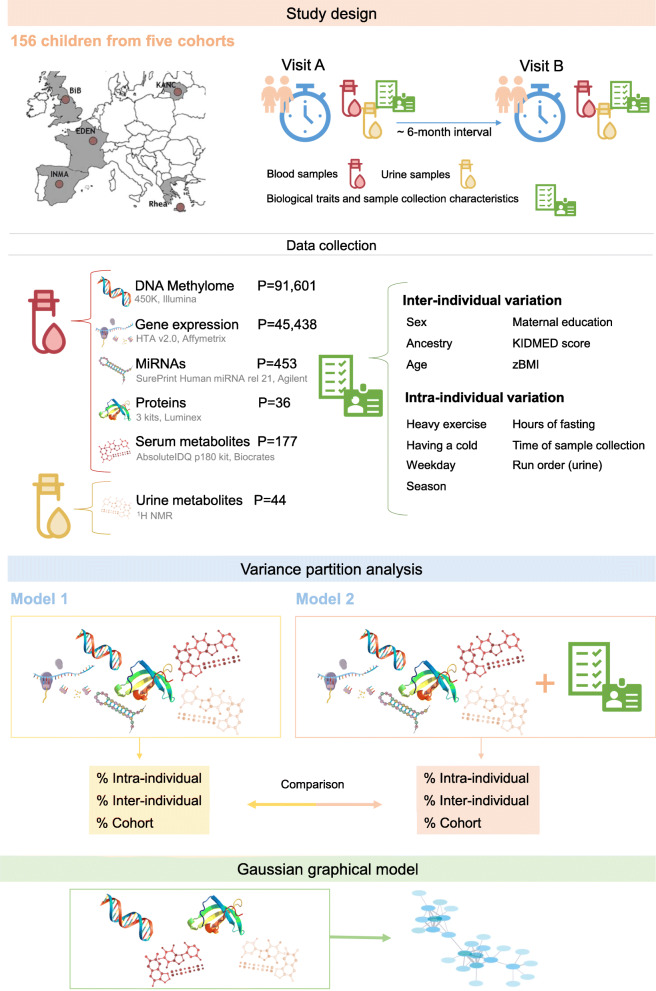
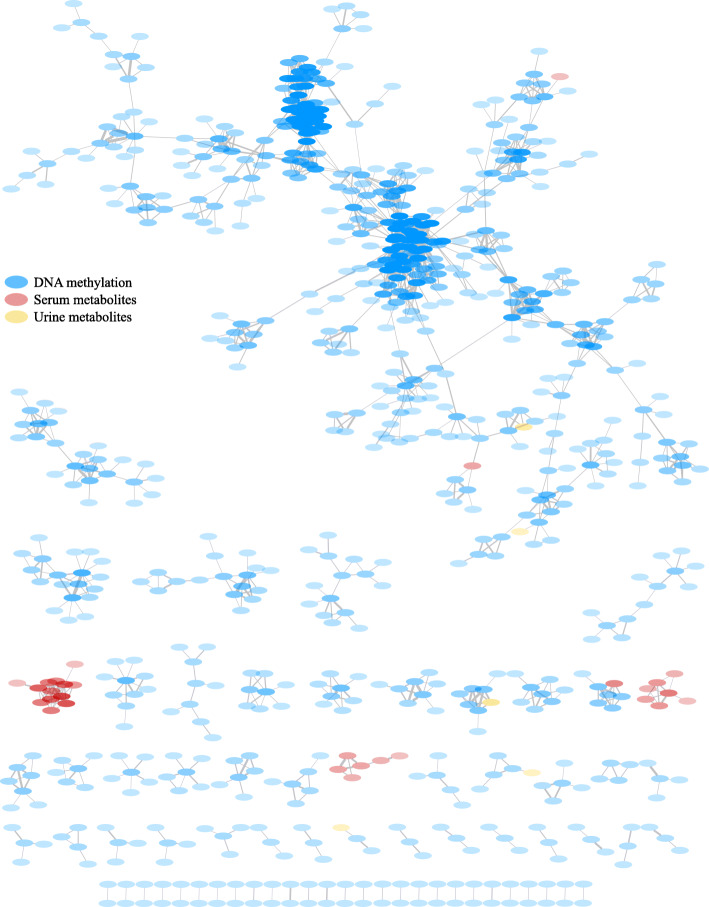
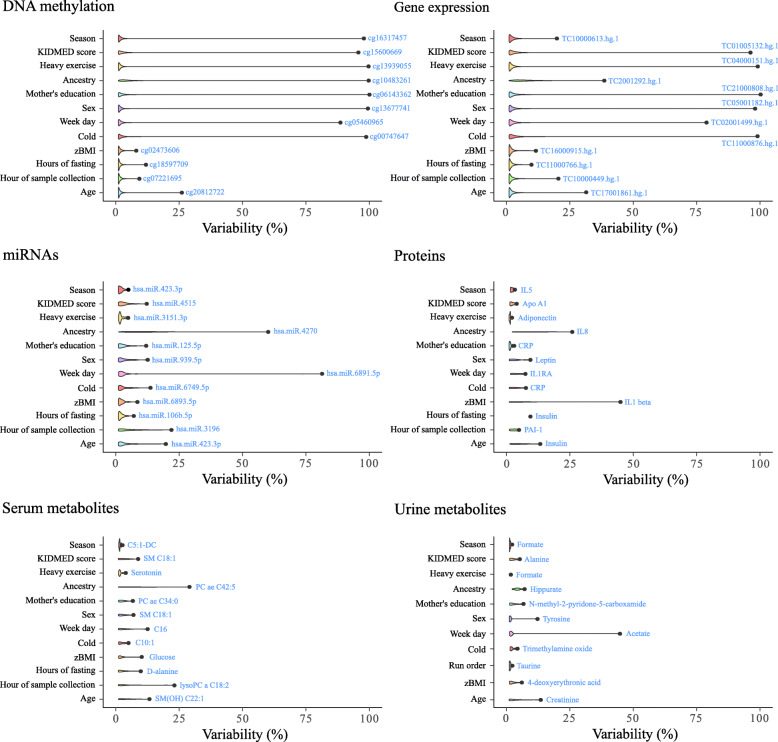
Methods: We aimed to estimate intra-, inter-individual and cohort variability of multi-omics profiles (blood DNA methylation, gene expression, miRNA, proteins and serum and urine metabolites) measured 6 months apart in 156 healthy children from five European countries. We further performed a multi-omics network analysis to establish clusters of co-varying omics features and assessed the contribution of key variables (including biological traits and sample collection parameters) to omics variability.
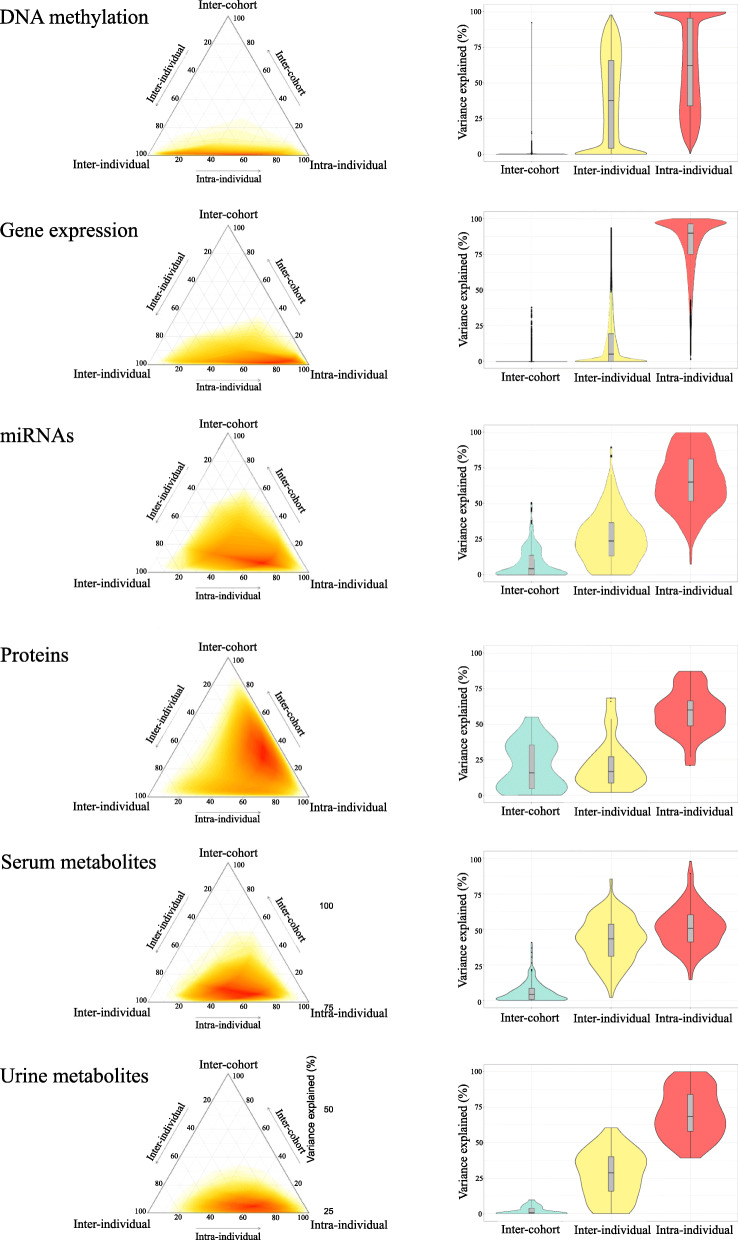
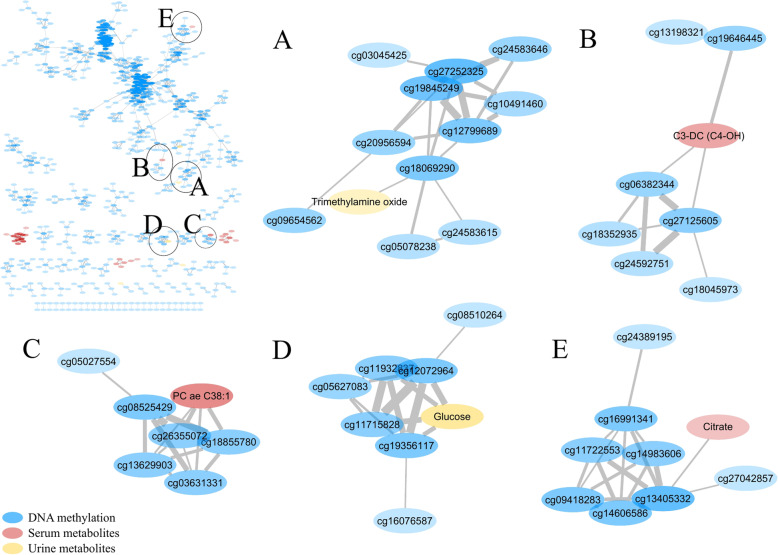
Results: All omics displayed a large range of intra- and inter-individual variability depending on each omics feature, although all presented a highest median intra-individual variability. DNA methylation was the most stable profile (median 37.6% inter-individual variability) while gene expression was the least stable (6.6%). Among the least stable features, we identified 1% cross-omics co-variation between CpGs and metabolites (e.g. glucose and CpGs related to obesity and type 2 diabetes). Explanatory variables, including age and body mass index (BMI), explained up to 9% of serum metabolite variability.
Conclusions: Methylation and targeted serum metabolomics are the most reliable omics to implement in single time-point measurements in large cross-sectional studies. In the case of metabolomics, sample collection and individual traits (e.g. BMI) are important parameters to control for improved comparability, at the study design or analysis stage. This study will be valuable for the design and interpretation of epidemiological studies that aim to link omics signatures to disease, environmental exposures, or both.
Keywords: Children; Cross-omics; DNA methylation; Exposome; Metabolomics; Multi-omics; Population study; Variability; mRNA; miRNA.
© 2021. The Author(s).
Conflict of interest statement
The authors declare that they have no competing interests. MC is currently affiliated to AstraZeneca but the company had no role in the design, conduct, or analysis of the H2020-EU funded project.
Figures
References
-
- Zhan X, Long Y, Lu M. Exploration of variations in proteome and metabolome for predictive diagnostics and personalized treatment algorithms: innovative approach and examples for potential clinical application. J. Proteomics. 2018;188:30–40. 10.1016/j.jprot.2017.08.020. - PubMed
-
- Barker DJP. The origins of the developmental origins theory. J Intern Med. 2007;261(5):412–7. 10.1111/j.1365-2796.2007.01809.x. - PubMed
Publication types
MeSH terms
Substances
Grants and funding
LinkOut - more resources
Full Text Sources
Medical
