. 2021 Jul 21;7(30):eabf3895.
doi: 10.1126/sciadv.abf3895. Print 2021 Jul.

Nuclear NAD+ homeostasis governed by NMNAT1 prevents apoptosis of acute myeloid leukemia stem cells

Affiliations

Nuclear NAD+ homeostasis governed by NMNAT1 prevents apoptosis of acute myeloid leukemia stem cells

Xiangguo Shi et al. Sci Adv. .

Abstract

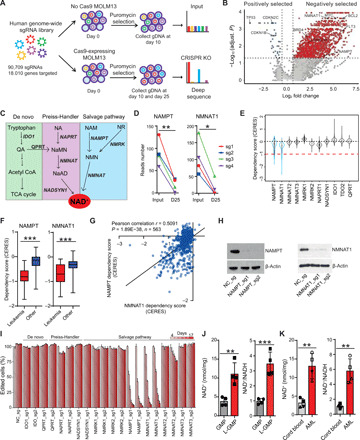
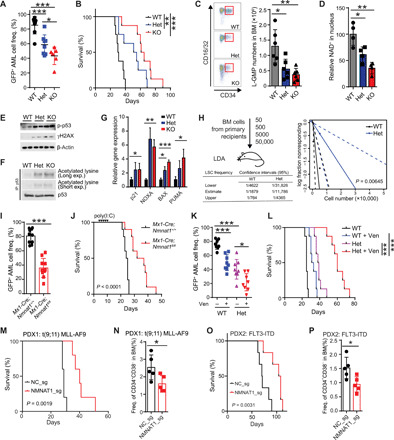
Metabolic dysregulation underlies malignant phenotypes attributed to cancer stem cells, such as unlimited proliferation and differentiation blockade. Here, we demonstrate that NAD+ metabolism enables acute myeloid leukemia (AML) to evade apoptosis, another hallmark of cancer stem cells. We integrated whole-genome CRISPR screening and pan-cancer genetic dependency mapping to identify NAMPT and NMNAT1 as AML dependencies governing NAD+ biosynthesis. While both NAMPT and NMNAT1 were required for AML, the presence of NAD+ precursors bypassed the dependence of AML on NAMPT but not NMNAT1, pointing to NMNAT1 as a gatekeeper of NAD+ biosynthesis. Deletion of NMNAT1 reduced nuclear NAD+, activated p53, and increased venetoclax sensitivity. Conversely, increased NAD+ biosynthesis promoted venetoclax resistance. Unlike leukemia stem cells (LSCs) in both murine and human AML xenograft models, NMNAT1 was dispensable for hematopoietic stem cells and hematopoiesis. Our findings identify NMNAT1 as a previously unidentified therapeutic target that maintains NAD+ for AML progression and chemoresistance.


Figures

Fig. 1
Fig. 1. Whole-genome CRISPR screen identifies NAMPT and NMNAT1 as genetic dependencies in AML.
(A) A schematic outline of the genome-wide CRISPR-Cas9 screen. (B) A volcano plot showing both positively and negatively selected genes (FDR < 0.25). (C) A schematic showing the three NAD+ biosynthesis pathways, with metabolites and enzymes in normal and italic font, respectively. (D) The read numbers of four sgRNAs against NAMPT (left) and NMNAT1 (right) at day 25 compared to input. (E) Cancer cell line dependency scores (CERES) of genes involved in NAD+ biosynthesis (n = 563). The box plot presents interquartile range, and the whiskers show 95% confidence interval. (F) CERES of NAMPT and NMNAT1 in leukemia (n = 26) and other cancer cell lines (n = 505). Box plots are annotated with the lower quartile, median, and upper quartile for each category’s z scores. (G) Scatter plot showing the correlation between the dependency score of NAMPT and NMNAT1 (n = 563). (H) Immunoblots of NAMPT (left) and NMNAT1 (right) in MOLM13 cells at day 4 after deleting these genes. (I) Competitive growth assay in Cas9-expressing MOLM13 cells that express sgRNAs against negative control (NC) or genes in the NAD+ biosynthesis pathway. The percentages of sgRNA-expressing cells were normalized to those on day 4 after transduction. (J) Measurement of intracellular NAD+ amounts (left) and NAD+/NADH (reduced form of NAD+) ratio (right) in GMP and MLL-AF9–driven L-GMPs (n = 4). (K) Intracellular NAD+ amounts (left) and NAD+/NADH ratio (right) in human cord blood CD34+ HSPCs and PDX-derived AML samples (n = 4). All data represent mean ± SD; *P < 0.05, **P < 0.01, and ***P < 0.001 by unpaired Student’s t test unless otherwise noted. See also fig. S1.
Fig. 2
Fig. 2. NMNAT1 deletion decreases nuclear NAD+ and activates the p53 pathway.
(A) Viability of MOLM13 and OCI-AML2 cells treated with FK866 (10 μM) with or without NAD+ precursors (NMN, NA, NR, and NAM; 1 mM). (B) Viability of MOLM13 and OCI-AML2 cells transduced with NMNAT1_sg (+) or negative control sgRNA [NC_sg (−)] with or without NAD+ precursors (NMN, NA, NR, and NAM; 1 mM). (C) Immunofluorescence images of NMNAT1 in MOLM13 cells. (D) Nuclear NAD+ levels in MOLM13 cells after deleting NMNAT1 or a negative control (NC) locus. (E) CRISPR domain screening using sgRNAs targeting different exons of NMNAT1 in Cas9-expressing MOLM13 cells. (F) Relative expansion of MOLM13 cells transduced with sgRNA against NMNAT1 or NC with or without the indicated mouse Nmnat1 constructs. (G) Survival curves of NSG-SGM3 mice transplanted with control or NMNAT1-deleted MOLM13 cells with the indicated murine Nmnat1 constructs. (H and I) Cell cycle analysis by BrdU incorporation (H) and annexin V staining (I) of MOLM13 cells after deleting NMNAT1 or NC. (J) Immunoblotting showing phospho-p53, γH2AX, and NMNAT1 in MOLM13 cells after lentiviral deleting NMNAT1. (K and L) Annexin V staining (K) or relative expansion (L) of MOLM13 cells after deleting NMNAT1 with or without consecutive targeting of TP53. (M) Relative expression of p53 target genes after deleting NMNAT1. (N) Immunoprecipitation assay showing increased acetylated lysine of p53 in NMNAT1-deleted MOLM13 cells. (O) Relative expansion of NMNAT1-deleted MOLM13 cells expressing WT or K320/373/381R-TP53 constructs. (P) Competitive growth assay after deleting the indicated genes. All data represent mean ± SD; *P < 0.05, **P < 0.01, and ***P < 0.001 by unpaired Student’s t test unless otherwise noted. See also fig. S2.
Fig. 3
Fig. 3. NMNAT1 deletion sensitizes AML cells to venetoclax.
(A) Waterfall plot showing the sum of drug metabolite Pearson correlation in 53 hematopoietic malignancy cell lines. Pearson correlation r value was calculated between the concentration of metabolite and drug IC50 in the 53 cell lines. The x axis represents 225 metabolites, and the y axis represents the sum of all Pearson correlation r values for all the 395 drugs. The bar in red color indicates NAD+, which is ranked fourth among 225 metabolites. (B) Waterfall plot showing the Pearson correlation r values (x axis) between the concentration of cellular NAD+ and IC50 of 395 drugs (y axis) in 53 hematopoietic malignancy cell lines. The bars in red color indicate venetoclax, which is ranked first among 395 drugs. (C) Plot showing the Pearson correlation between cellular NAD+ levels and venetoclax IC50 from 45 hematopoietic malignancy cell lines. Each dot represents one cell line. (D) Frequency of apoptotic MOLM13 cells treated with venetoclax (Ven, 1.5 to 3 nM) with or without NMN or NAM (1 mM) for 48 hours. (E) Effect of Ven (3 nM) on cell growth of MLL-AF9–driven L-GMPs with or without NMN or NAM (1 mM) supplementation for 72 hrs. (F) Cell viability of MOLM13 cells treated with FK866 (0.625 to 2.5 nM) or Ven (0.75 to 3 nM) alone or in combination for 48 hours. (G) Cell viability of MOLM13 cells after deleting NMNAT1 or the control locus and treated with the indicated concentration of Ven for 48 hours. All data represent mean ± SD; *P < 0.05, **P < 0.01, and ***P < 0.001 by unpaired Student’s t test unless otherwise noted. See also fig. S3.
Fig. 4
Fig. 4. NMNAT1 deletion suppresses leukemia progression.
(A and B) Frequency of GFP+ leukemia cell in blood (day 25) (A) and survival curve (B) of mice transplanted with MLL-AF9–transduced HSPCs isolated from Nmnat1 WT, Het, and KO mice (n = 8). (C) Representative fluorescence-activated cell sorting plot and quantification of CD34+CD16/32+ L-GMPs (red box) after Nmnat1 deletion (n = 6). (D) Relative nuclear NAD+ levels in GFP+ leukemic cells (n = 4). (E and F) Immunoblotting showing phospho-p53 (Ser15) and γH2AX (E) and acetylated (lysine) p53 after immunoprecipitation of p53 (F) in L-GMPs. (G) Expression levels of p53 target genes in L-GMPs from Nmnat1 WT, Het, and KO AML mice. (H) Limiting dilution assays performed with GFP+ BM cells from primary recipient mice (n = 6). (I and J) MLL-AF9–transduced HSPCs from Mx1-Cre;Nmnat1+/+ or Mx1-Cre;Nmnat1fl/fl mice before poly(I:C) treatment were transplanted into recipient mice and treated with poly(I:C) (indicated by arrowheads) 5 days after transplantation. Frequency of GFP+ leukemia cell in blood 3 weeks after transplantation (I), and survival curves (J) are shown (n = 10). (K and L) Frequency of GFP+ leukemia cell in PB (K) and survival curves (L) (n = 8) of Nmnat1 WT or Het AML recipient mice treated with vehicle or venetoclax (100 mg/kg, days 5 to 21). (M to P) Survival curves (M and O) and frequency of human CD45+CD34+CD38 LSCs (N and P) in NSG-SGM3 mice transplanted with MLL-AF9 (M and N) or FLT3-ITD (O and P) human AML samples with or without CRISPR-mediated deletion of NMNAT1 (n = 5 to 6). All data represent mean ± SD; *P < 0.05, **P < 0.01, and ***P < 0.001 by unpaired Student’s t test unless otherwise noted. See also fig. S4.
Fig. 5
Fig. 5. Nmnat1 is dispensable for normal hematopoiesis.
(A) Quantitative PCR showing the relative expression levels of Nmnat1 in murine hematopoietic cell populations in the BM compared to whole BM (WBM) (n = 3). (B and C) Complete blood cell counts (B) and frequencies of B cell, T cell, and myeloid cell (C) in PB of Nmnat1 WT (Nmnat1+/+), Het (Mx1-Cre; Nmnat1+/fl), and KO (Mx1-Cre; Nmnat1fl/fl) mice at 4 months after poly(I:C) injection (n = 8 to 12). WBC, white blood cells; RBC, red blood cells; HGB, hemoglobin; PLT, platelets. (D) BM cellularity of poly(I:C)-treated Nmnat1 WT, Het, and KO mice (n = 5 to 6). (E) Frequencies of LSK, HSC, MPP, HPC1, and HPC2 in the BM of poly(I:C)-treated Nmnat1 WT, Het, and KO mice (n = 5 to 6). (F) Frequencies of GMP, CMP, and MEP in the BM of poly(I:C)-treated Nmnat1 WT, Het, and KO mice (n = 5 to 6). (G) Competitive BM transplantation with 500,000 Nmnat1 WT, Het, or KO BM cells (CD45.2+), along with 500,000 competitor BM cells (CD45.1+) into lethally irradiated recipient mice. Graphs show the overall percentage of CD45.2+ cells and those in B, T, and myeloid lineages (n = 5 to 6). (H) Model for the role of NMNAT1 in AML and venetoclax resistance. All data represent mean ± SD; *P < 0.05, **P < 0.01, and ***P < 0.001 by unpaired Student’s t test unless otherwise noted. See also fig. S5.

References

    1. Ferrara F., Schiffer C. A., Acute myeloid leukaemia in adults. Lancet 381, 484–495 (2013). - PubMed
    1. Tamamyan G., Kadia T., Ravandi F., Borthakur G., Cortes J., Jabbour E., Daver N., Ohanian M., Kantarjian H., Konopleva M., Frontline treatment of acute myeloid leukemia in adults. Crit. Rev. Oncol. Hematol. 110, 20–34 (2017). - PMC - PubMed
    1. Shlush L. I., Mitchell A., Heisler L., Abelson S., Ng S. W. K., Trotman-Grant A., Medeiros J. J. F., Rao-Bhatia A., Jaciw-Zurakowsky I., Marke R., McLeod J. L., Doedens M., Bader G., Voisin V., Xu C. J., McPherson J. D., Hudson T. J., Wang J. C. Y., Minden M. D., Dick J. E., Tracing the origins of relapse in acute myeloid leukaemia to stem cells. Nature 547, 104–108 (2017). - PubMed
    1. Lagadinou E. D., Sach A., Callahan K., Rossi R. M., Neering S. J., Minhajuddin M., Ashton J. M., Pei S., Grose V., O’Dwyer K. M., Liesveld J. L., Brookes P. S., Becker M. W., Jordan C. T., BCL-2 inhibition targets oxidative phosphorylation and selectively eradicates quiescent human leukemia stem cells. Cell Stem Cell 12, 329–341 (2013). - PMC - PubMed
    1. Pei S., Minhajuddin M., Adane B., Khan N., Stevens B. M., Mack S. C., Lai S., Rich J. N., Inguva A., Shannon K. M., Kim H., Tan A. C., Myers J. R., Ashton J. M., Neff T., Pollyea D. A., Smith C. A., Jordan C. T., AMPK/FIS1-mediated mitophagy is required for self-renewal of human AML stem cells. Cell Stem Cell 23, 86–100.e6 (2018). - PMC - PubMed

Publication types

MeSH terms