. 2021 Jul 21;7(30):eabh0101.
doi: 10.1126/sciadv.abh0101. Print 2021 Jul.

Local IP3 receptor-mediated Ca2+ signals compound to direct blood flow in brain capillaries

Affiliations

Local IP3 receptor-mediated Ca2+ signals compound to direct blood flow in brain capillaries

Thomas A Longden et al. Sci Adv. .

Abstract

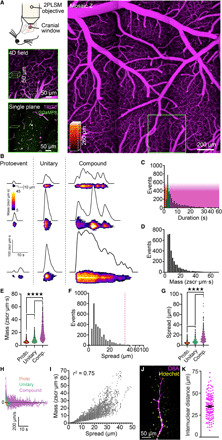
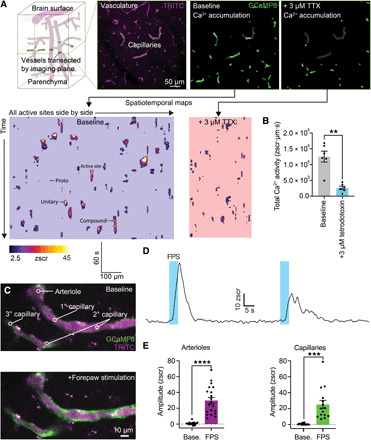
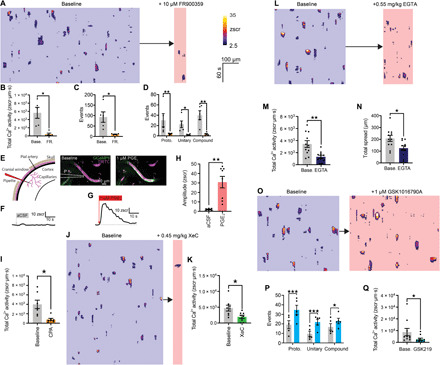
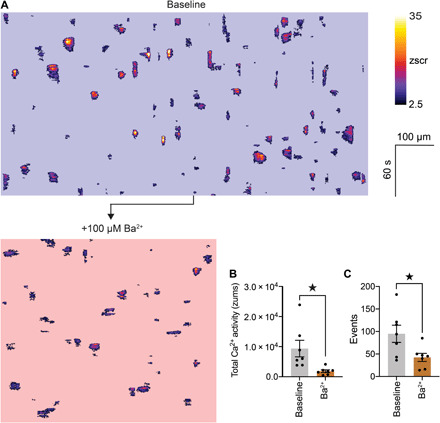
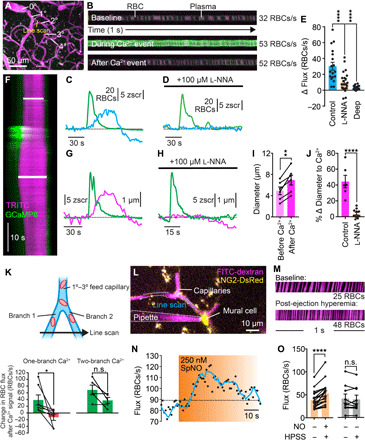
Healthy brain function depends on the finely tuned spatial and temporal delivery of blood-borne nutrients to active neurons via the vast, dense capillary network. Here, using in vivo imaging in anesthetized mice, we reveal that brain capillary endothelial cells control blood flow through a hierarchy of IP3 receptor-mediated Ca2+ events, ranging from small, subsecond protoevents, reflecting Ca2+ release through a small number of channels, to high-amplitude, sustained (up to ~1 min) compound events mediated by large clusters of channels. These frequent (~5000 events/s per microliter of cortex) Ca2+ signals are driven by neuronal activity, which engages Gq protein-coupled receptor signaling, and are enhanced by Ca2+ entry through TRPV4 channels. The resulting Ca2+-dependent synthesis of nitric oxide increases local blood flow selectively through affected capillary branches, providing a mechanism for high-resolution control of blood flow to small clusters of neurons.


Figures

Fig. 1
Fig. 1. Dynamic Ca2+ signaling in the brain endothelium.
(A) In vivo imaging strategy. Top left: A cranial window was centered over the somatosensory region, imaged using two-photon laser scanning microscopy. Left: Vascular field mapped from luminal TRITC-dextran. Bottom left: Region around a penetrating arteriole imaged at higher resolution, selected for 4D imaging, and a single plane, within the 4D block of interest above. Magenta, TRITC-dextran; green, GCaMP8. (B to I) Characterization of cEC Ca2+ events (proto, n = 1184 events; unitary, n = 786; compound, n = 1257). (B) Capillary Ca2+ events ranging from proto events to unitary singlets and multicomponent compound events. (C) Durations for all events analyzed. Color overlay indicates event classes: red, proto; green, unitary; magenta, compound. (D) Amplitudes for all events analyzed. (E) Event mass by class [P < 0.0001 (q3224 = 10.76), proto versus unitary; P < 0.0001 (q3224 = 43.89), unitary versus compound; P < 0.0001 (q3224 = 61.51), compound versus proto; one-way analysis of variance (ANOVA) and Tukey’s multiple comparisons test]. (F) Lengths of cEC Ca2+ events. The dashed line indicates the average length of a cEC [from (K)]. (G) Event length by class [P < 0.0001 (q3224 = 15.25), proto versus unitary; P < 0.0001 (q3224 = 34.45), unitary versus compound; P < 0.0001 (q3224 = 56.01), compound versus proto; one-way ANOVA and Tukey’s multiple comparisons test]. (H) Event spread velocity by class. Deviation above the line represents event expansion, whereas below the line represents contraction. (I) Relationship between cEC Ca2+ event mass and spread. (J) Di-8-ANEPPS (magenta) and Hoechst 33342 (yellow) staining of the capillary endothelium and cEC nuclei. (K) Internuclear distances measured using Di-8-ANEPPS and Hoechst 33342 (n = 150 measurements, 3 mice).
Fig. 2
Fig. 2. TTX suppresses brain cEC Ca2+ signaling in vivo.
(A) Top left: Imaging outline. A single optical section through a field of vessels within the brain was imaged for 236 s. Top right three panels: Typical field showing TRITC-dextran–filled vasculature (magenta; left) and accumulation plots showing all Ca2+ activity recorded in this plane under baseline conditions (middle) and all activity in the same field after the addition of 3 μM TTX (right). Bottom: Recordings converted to ST maps, total length of all active sites are side by side on the x axis and time on the y axis (left), and the effects of TTX (right). TTX decreases in the number of active sites, which reduces the length of the x axis, and decreases in event amplitudes and durations appear as smaller individual events in the y axis. (B) Summary data showing the effects of TTX on total Ca2+ activity in each field [n = 6 experiments, 6 mice; P = 0.0038 (t5 = 5.091), paired Student’s t test]. (C) Sensory stimulation engages arteriolar and capillary Ca2+ signals. Top: A single plane through the penetrating arteriole and the connected first- to third-order capillaries. Bottom: Electrical FPS–induced increases in Ca2+ in arteriolar ECs and cECs. (D) Traces from an individual experiment showing robust responses of capillaries and arterioles to FPS across two trials separated by ~1 min. (E) Summary showing Ca2+ signals evoked by neural activity in the penetrating arteriole [n = 19 paired experiments; P < 0.0001 (t18 = 7.685), paired Student’s t test] and capillaries [n = 15 paired experiments; P = 0.0003 (t14 = 4.699), paired Student’s t test].
Fig. 3
Fig. 3. GqPCR signaling through IP3Rs and TRPV4 drives cEC Ca2+ signaling.
(A) ST maps before/after FR900359. Scale bars apply to all maps. (B) FR900359 on cEC Ca2+ activity [n = 5 experiments, 5 mice; P = 0.0147 (t4 = 4.117), paired t test], (C) total events [n = 5 experiments, 5 mice; P = 0.0282 (t4 = 3.364), paired t test], and (D) events by class [n = 5 experiments, 5 mice; proto, P = 0.0064 (t8 = 4.445); unitary, P = 0.023 (t8 = 3.522); compound, P = 0.0008 (t8 = 6.223); two-way ANOVA and Sidak’s multiple comparisons test]. (E) Focal application of PGE2 on cEC Ca2+. Left: Pipette (P) position. Right: Peak cEC Ca2+ after PGE2. (F) No Ca2+ response of a capillary to aCSF, and an increase in Ca2+ following PGE2 (G). (H) Summary [n = 6 to 8 experiments, 3 to 5 mice; P = 0.0016 (t12 = 4.054), unpaired t test]. (I) CPA decreased Ca2+ activity [n = 7 experiments, 7 mice; P = 0.0178 (t6 = 3.233); paired t test]. (J and K) Reduction in Ca2+ activity by xestospongin C [n = 8 experiments, 8 mice; P = 0.0318 (t7 = 2.675); paired t test]. (L to N) Maps and summary for EGTA-mediated changes in Ca2+ activity [n = 11 experiments, 11 mice; P = 0.0090 (t10 = 3.230), paired t test] and spatial spread [n = 11 experiments, 11 mice; P = 0.0415 (t10 = 2.337), paired t test]. (O) ST map of TRPV4 activation with GSK1016790A. (P) TRPV4 activation on event classes [n = 5 experiments, 5 mice; proto, P = 0.0001 (t8 = 8.102); unitary, P = 0.0006 (t8 = 6.418); compound, P = 0.0341 (t8 = 3.262); two-way ANOVA and Sidak’s multiple comparisons test]. (Q) Inhibition of TRPV4 with GSK2193874 [n = 10 experiments, 10 mice; P = 0.0303 (t9 = 2.567), unpaired t test].
Fig. 4
Fig. 4. Capillary Kir2.1 channel–mediated electrical signaling shapes Ca2+ signaling.
(A) ST maps extracted from the same field before and after inhibition of Kir2.1 channels with topically applied Ba2+ (100 μM). (B) Summary data showing the in vivo effects of Ba2+ on total Ca2+ activity [n = 7 experiments, 7 mice; P = 0.0353 (t6 = 2.706), paired Student’s t test] and total number of events observed (C) [n = 7 experiments, 7 mice; P = 0.0401 (t6 = 2.610), paired Student’s t test].
Fig. 5
Fig. 5. Ca2+ signaling tunes capillary diameter and blood flow.
(A) Flux experiment setup. (B) Line scans showing RBCs (black) passing through a capillary in fluorescent plasma (x, time; y, space). (C) Hyperemia (blue) following a spontaneous Ca2+ signal (green). (D) l-NNA inhibition of Ca2+-associated increases in RBC flux. (E) Changes in flux after a Ca2+ event at 1° to 3° bifurcations of the capillary network with and without l-NNA and in deeper capillaries (≥5°) [n = 18 to 24 experiments, 7 to 9 mice; P = 0.0001 (q58 = 4.768) control versus l-NNA; P = 0.0001 (q58 = 5.965) control versus deep; one-way ANOVA and Dunnett’s multiple comparison test]. (F) Line scan showing capillary dilation to a Ca2+ event (y, time; upper bar, baseline; lower bar, peak). (G) Diameter (magenta) and Ca2+ (green) for the experiment in (F). (H) As in (G), an experiment following cortex perfusion with l-NNA. (I) Dilation following Ca2+ signaling [n = 6 experiments, 5 mice; P = 0.0029 (t5 = 5.438); paired t test]. (J) l-NNA inhibition of Ca2+-induced dilation [n = 6 to 11 paired experiments, 5 to 7 mice; P < 0.0001 (t15 = 6.589); unpaired t test]. (K) Directional control of blood flow by capillary Ca2+. Top: Experimental approach. Two branches, fed by a 1° to 3° capillary, were simultaneously line-scanned. Bottom: Summary showing differential blood flow when a Ca2+ signal occurred in one branch only (left) and uniform blood flow through the two segments when a signal occurred in both branches (right). [one-branch Ca2+ event: n = 7 paired experiments; P = 0.0395 (t6 = 2.621); paired t test; two-branch Ca2+ event: n = 5 paired experiments; P = 0.0837 (t4 = 2.292); paired t test]. (L) Pipette containing spermine NONOate next to a pericyte. Flux was measured by line-scanning the capillary during ejection. (M) RBCs passing through the line-scanned region against fluorescent plasma (x, time). (N) Time course of RBC flux to NO. (O) Peak RBC flux at baseline and after NO [n = 19 experiments, 8 mice; P < 0.0001 (t18 = 5.714); paired t test] or HPSS [n = 9 experiments, 5 mice; P = 0.4587 (t8 = 0.7784); paired t test].

References

    1. Palmer R., Ferrige A., Moncada S., Nitric oxide release accounts for the biological activity of endothelium-derived relaxing factor. Nature 327, 524–526 (1987). - PubMed
    1. Ledoux J., Taylor M. S., Bonev A. D., Hannah R. M., Solodushko V., Shui B., Tallini Y., Kotlikoff M. I., Nelson M. T., Functional architecture of inositol 1, 4, 5-trisphosphate signaling in restricted spaces of myoendothelial projections. Proc. Natl. Acad. Sci. U.S.A. 105, 9627–9632 (2008). - PMC - PubMed
    1. Sonkusare S. K., Bonev A. D., Ledoux J., Liedtke W., Kotlikoff M. I., Heppner T. J., Hill-Eubanks D. C., Nelson M. T., Elementary Ca2+ signals through endothelial TRPV4 channels regulate vascular function. Science 336, 597–601 (2012). - PMC - PubMed
    1. Shen Z., Lu Z., Chhatbar P. Y., O’Herron P., Kara P., An artery-specific fluorescent dye for studying neurovascular coupling. Nat. Methods 9, 273–276 (2012). - PMC - PubMed
    1. Gonzales A. L., Klug N. R., Moshkforoush A., Lee J. C., Lee F. K., Shui B., Tsoukias N. M., Kotlikoff M. I., Hill-Eubanks D., Nelson M. T., Contractile pericytes determine the direction of blood flow at capillary junctions. Proc. Natl. Acad. Sci. U.S.A. 117, 27022–27033 (2020). - PMC - PubMed