

Ignitions explain more than temperature or precipitation in driving Santa Ana wind fires
- PMID: 34290099
- PMCID: PMC8294765
- DOI: 10.1126/sciadv.abh2262
Ignitions explain more than temperature or precipitation in driving Santa Ana wind fires
Abstract
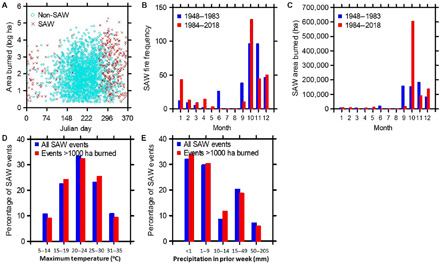
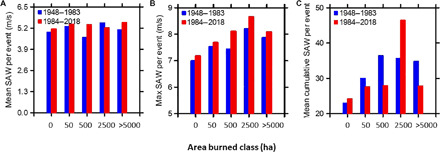
Autumn and winter Santa Ana wind (SAW)-driven wildfires play a substantial role in area burned and societal losses in southern California. Temperature during the event and antecedent precipitation in the week or month prior play a minor role in determining area burned. Burning is dependent on wind intensity and number of human-ignited fires. Over 75% of all SAW events generate no fires; rather, fires during a SAW event are dependent on a fire being ignited. Models explained 40 to 50% of area burned, with number of ignitions being the strongest variable. One hundred percent of SAW fires were human caused, and in the past decade, powerline failures have been the dominant cause. Future fire losses can be reduced by greater emphasis on maintenance of utility lines and attention to planning urban growth in ways that reduce the potential for powerline ignitions.
Copyright © 2021 The Authors, some rights reserved; exclusive licensee American Association for the Advancement of Science. No claim to original U.S. Government Works. Distributed under a Creative Commons Attribution NonCommercial License 4.0 (CC BY-NC).
Figures


References
-
- Jin Y., Goulden M. L., Faivre N., Veraverbeke S., Sun F., Hall A., Hand M. S., Hook S., Randerson J. T., Identification of two distinct fire regimes in southern California: Implications for economic impact and future change. Environ. Res. Lett. 10, 094005 (2015).
-
- Kolden C. A., Abatzoglou J. T., Spatial distribution of wildfires ignited under katabatic versus non-katabatic winds in Mediterranean southern California USA. Fire 1, 19 (2018).
-
- Jin Y., Randerson R. T., Faivre N., Capps S., Hall A., Goulden M. L., Contrasting controls on wildland fires in Southern California during periods with and without Santa Ana winds. J. Geophys. Res. Biogeo. 119, 432–450 (2014).
-
- Keeley J. E., Syphard S. D., Twenty-first century California, USA, wildfires: Fuel-dominated vs. wind-dominated fires. Fire Ecol. 15, 24 (2019).
LinkOut - more resources
Full Text Sources
Miscellaneous
