. 2021 Jul 27;118(30):e2103518118.
doi: 10.1073/pnas.2103518118.

Insertion of a synthetic switch into insulin provides metabolite-dependent regulation of hormone-receptor activation

Affiliations

Insertion of a synthetic switch into insulin provides metabolite-dependent regulation of hormone-receptor activation

Yen-Shan Chen et al. Proc Natl Acad Sci U S A. .

Abstract

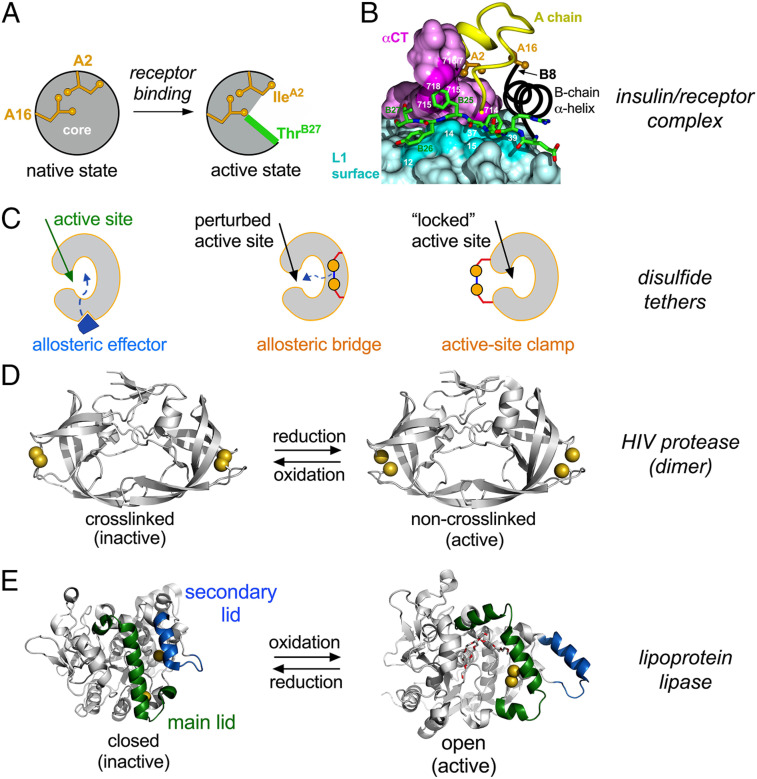
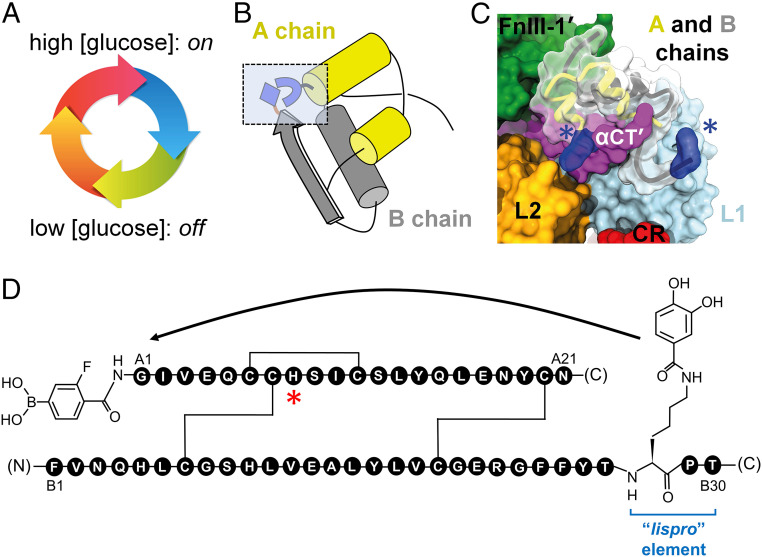
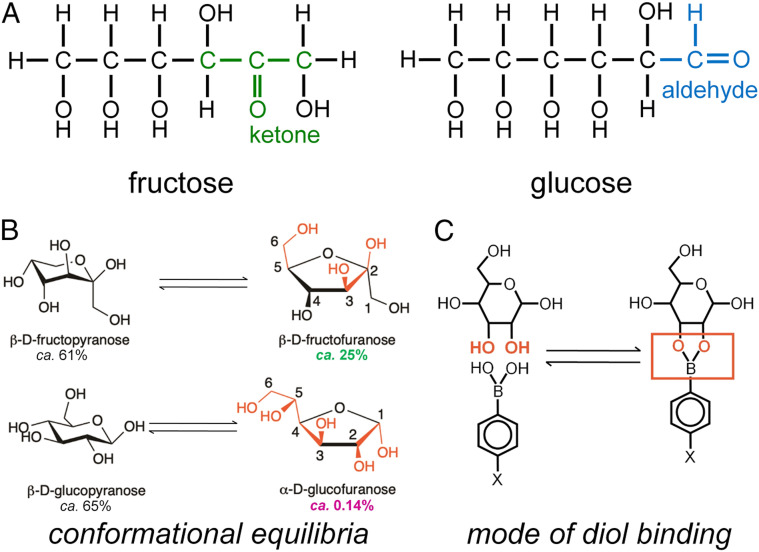
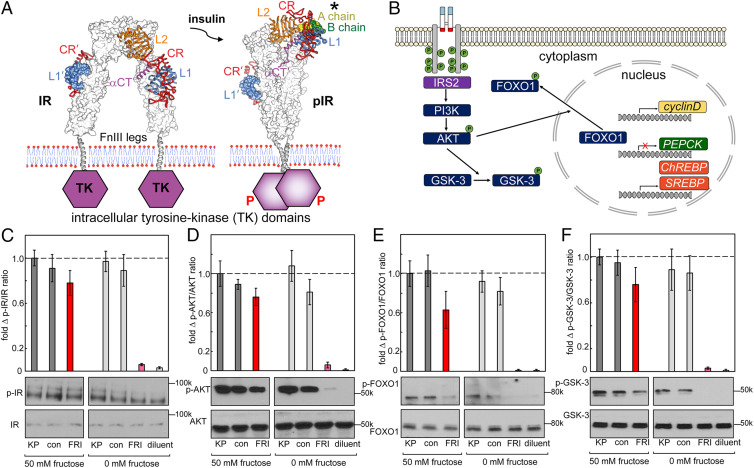
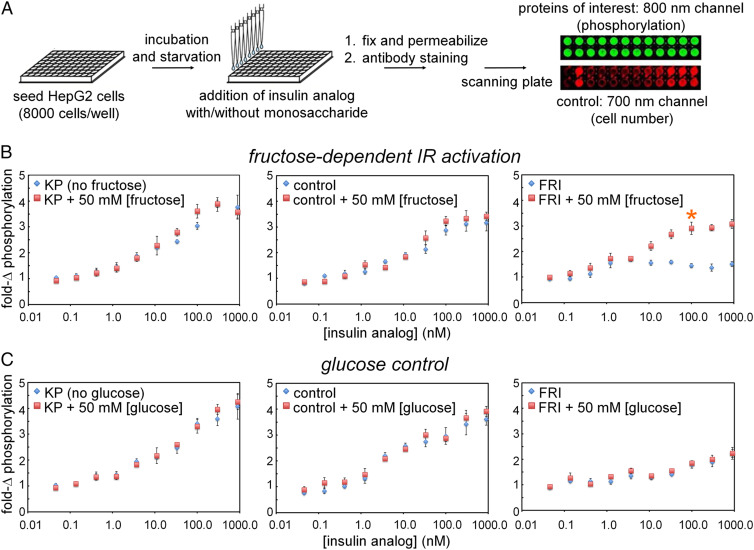
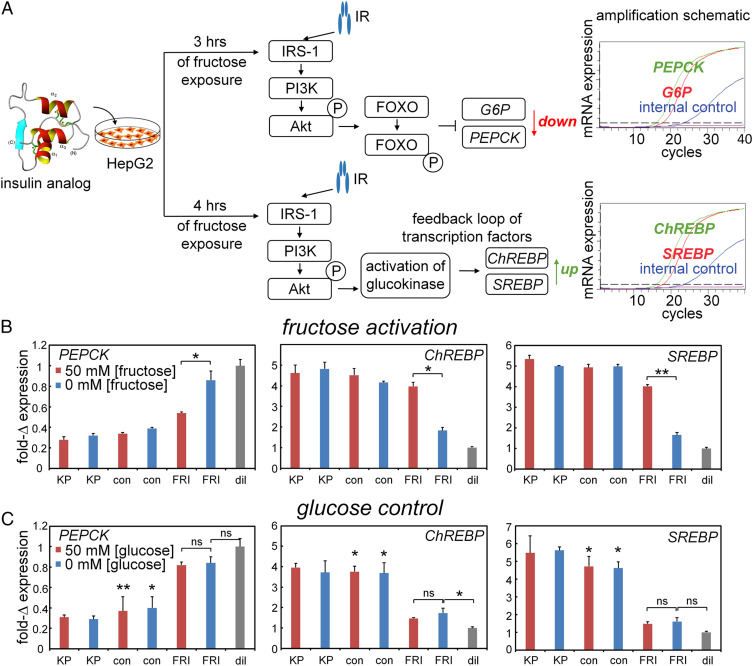
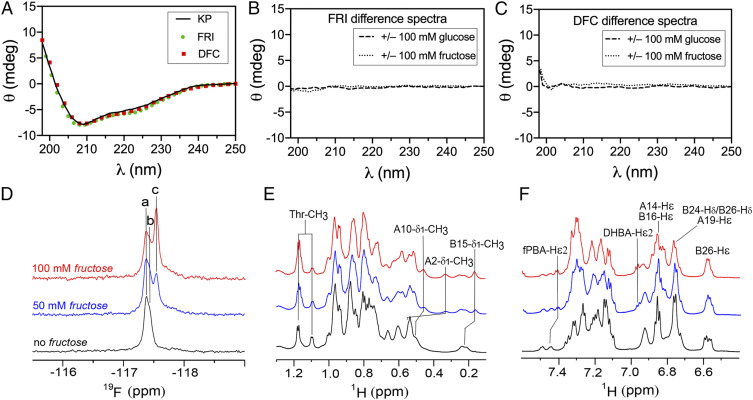
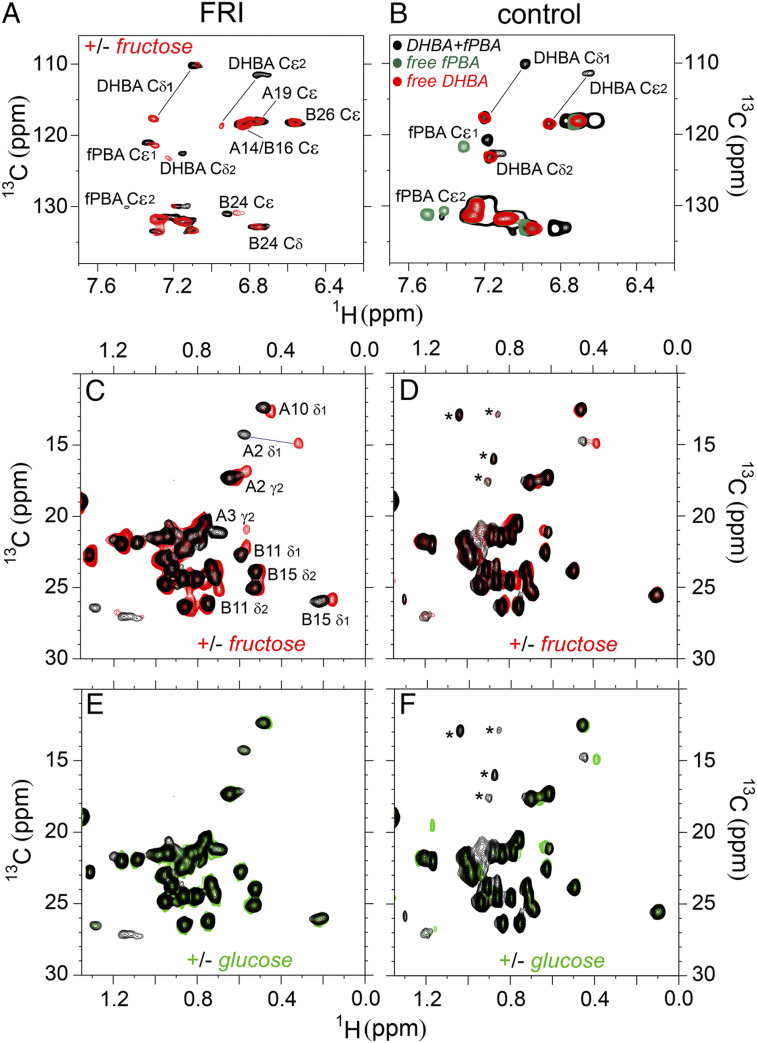
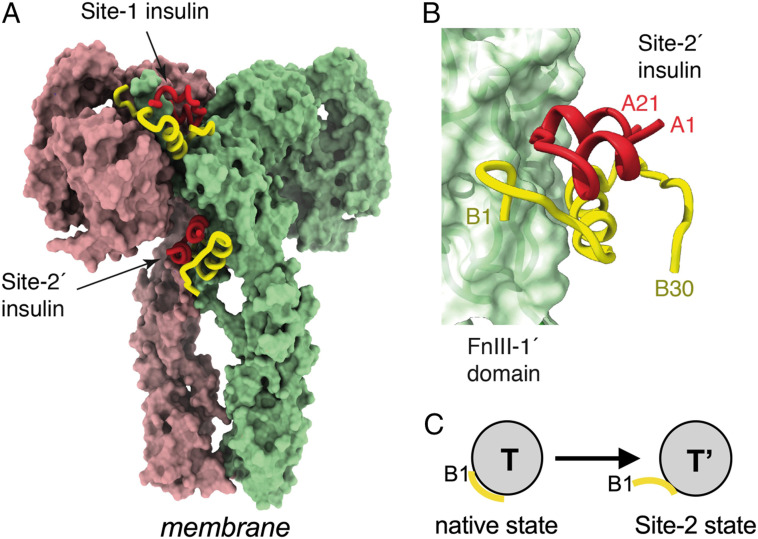
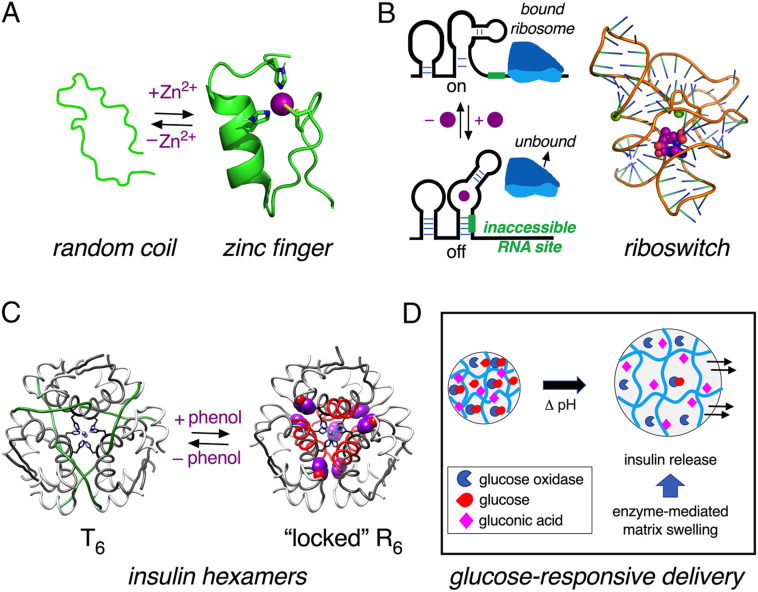
Insulin-signaling requires conformational change: whereas the free hormone and its receptor each adopt autoinhibited conformations, their binding leads to structural reorganization. To test the functional coupling between insulin's "hinge opening" and receptor activation, we inserted an artificial ligand-dependent switch into the insulin molecule. Ligand-binding disrupts an internal tether designed to stabilize the hormone's native closed and inactive conformation, thereby enabling productive receptor engagement. This scheme exploited a diol sensor (meta-fluoro-phenylboronic acid at GlyA1) and internal diol (3,4-dihydroxybenzoate at LysB28). The sensor recognizes monosaccharides (fructose > glucose). Studies of insulin-signaling in human hepatoma-derived cells (HepG2) demonstrated fructose-dependent receptor autophosphorylation leading to appropriate downstream signaling events, including a specific kinase cascade and metabolic gene regulation (gluconeogenesis and lipogenesis). Addition of glucose (an isomeric ligand with negligible sensor affinity) did not activate the hormone. Similarly, metabolite-regulated signaling was not observed in control studies of 1) an unmodified insulin analog or 2) an analog containing a diol sensor without internal tethering. Although secondary structure (as probed by circular dichroism) was unaffected by ligand-binding, heteronuclear NMR studies revealed subtle local and nonlocal monosaccharide-dependent changes in structure. Insertion of a synthetic switch into insulin has thus demonstrated coupling between hinge-opening and allosteric holoreceptor signaling. In addition to this foundational finding, our results provide proof of principle for design of a mechanism-based metabolite-responsive insulin. In particular, replacement of the present fructose sensor by an analogous glucose sensor may enable translational development of a "smart" insulin analog to mitigate hypoglycemic risk in diabetes therapy.

Keywords: diabetes mellitus; hormone–receptor recognition; insulin pharmacology; protein engineering; receptor tyrosine kinase.


Conflict of interest statement

Competing interest statement: M.A.W. has equity in Thermalin Inc. (Cleveland, OH) at which he serves as Chief Innovation Officer; he has also been a consultant to Merck Research Laboratories and DEKA Research and Development Corp. N.B.P. is a consultant to Thermalin Inc. M.C.L.'s laboratory has a Research Agreement with Eli Lilly and Company to conduct research not connected to this publication.

Figures

Fig. 1.
Fig. 1.
Molecular switches in proteins. (A and B) Insulin conformation “opens” on receptor binding. (A) Schematic depiction of closed state (free hormone at Left) and active, open state (receptor-bound conformation at Right). Sidechains IleA2 and LeuA16 are shown in gold. The green segment in open state represents detached segment B20 to B27. (B) Cocrystal structure of insulin bound to a fragment of the IR ectodomain [the μIR complex (16)] showing displaced position of the B20 to B27 segment (with green carbon atoms) in groove between IR domains αCT (purple) and L1 (powder blue). Residue-specific contacts in αCT and L1 are shown in darker purple and darker powder blue, respectively (16). Panels are adapted from ref. with permission. (C) Models depicting inhibition of an active site in varying degrees by (Left to Right) allosteric effector, allosteric bridge, or active-site clamp. (D) Tethering by engineered disulfide bridge inactivates HIV protease (28). The pairwise Cys-substituted noncrosslinked enzyme is active (Right) whereas the tethered protein exhibits impaired activity (Left). HIV protease dimer is shown as gray ribbon with sulfur atoms as gold spheres; coordinates were obtained from PDB entries 4DQG and 4DQC. (E) Disulfide tether activates lipoprotein lipase (29). Closed conformation (Left) was modeled using the crystal structure of wild-type Bacillus stearothermophilus lipase 1; PDB entry 1KU0) with pairwise substitutions F206C and A191C (PyMOL). Open conformation (Right) was modeled using crystal structure of bacterial Thermoalkalophilic lipase (PDB entry 2W22); Triton X-100 detergent molecules are shown by red and white sticks. In this structure, the two Cys substituents can bridge within an active conformation. In both conformations, the lipases are as cartoon gray ribbons whereas main and secondary “lids” are shown in green and blue, respectively. Sulfur atoms of interest shown as gold spheres.
Fig. 2.
Fig. 2.
Design of FRI. (A) Glucose-regulated conformational cycle in which a monosaccharide acts as a competitive ligand to regulate a conformational switch between closed state (inactive in absence of ligand; Bottom) and open state (active in presence of ligand; Top). (B) Ribbon model of insulin (T-state monomer). The box indicates sites of chemical modification showing “switch” elements in closed conformation due to intramolecular DHBA/m-fPBA ester bonding. (C) Structural model of FRI binding to insulin receptor. Blue volumes and asterisks highlight the protein adducts. A and B chains are shown as yellow and gray ribbons, respectively. IR domains are shown as surfaces by color code: L1 (powder blue), L2 (gold), CR (red), FnIII-1' (green), and dimer-related αCT' (purple). (D) GlyA1 α-amino group is modified by fPBA, whereas the ε-amino group of LysB28 (in lispro B chain with “KP switch”; ProB28→Lys and LysB29→Pro) is linked to an aromatic 1,2-diol (DHBA). Weakened IR-binding affinity due to the A1-adduct is compensated by favorable substitution ThrA8→His (asterisked; 51).
Fig. 3.
Fig. 3.
Monosaccharide structures and mode of binding to PBA. (A) Linear structures of fructose and glucose. (B) PBA binds most strongly to aligned 1,2-diol elements as in the β-D-furanose conformation of fructose (Top right; 25% occupancy) or α-D-furanose conformation of glucose (Bottom right; 0.14% occupancy). Respective conformational equilibria thus favor selective binding to fructose (47, 48). Key cis-hydroxyl groups are shown in red. Percent populations are as indicated. (C) Schematic binding mode of PBA to a 1,2-diol element in a monosaccharide (red). Panel B is adapted from ref. .
Fig. 4.
Fig. 4.
Fructose-dependent IR activation and downstream pathways. (A) IR ectodomain structures either unbound (Left) or as activated by insulin (Right), asterisk highlights the A chain (light green) and B chain (green) of insulin). On insulin binding, the ectodomain legs come together to enable TK transphosphorylation (red P’s). (B) Selected downstream IR signaling pathways as probed by WB. IR L1 and αCT domains are highlighted in blue and red; JM- and TK-domain phosphorylation sites are shown in schematic form by green circles. IR activation leads to AKT phosphorylation, which in turn phosphorylates and inhibits GSK-3; pAKT also phosphorylates FOXO in cytoplasm to enable transcriptional regulation of cell proliferation (cyclin D), gluconeogenesis (PEPCK), and fatty-acid synthesis (ChREBP and SREBP) in the nucleus. (C-F) WB assays probing the p-IR/IR (C), p-AKT/AKT (D), p-FOXO/FOXO (E), and p-GSK-3/GSK-3 (F) in the presence or absence of fructose (50 mM) in medium. Studies of FRI were conducted relative to lispro insulin (“KP”), a diol-free control analog (DFC; “con”) or buffer only (diluent; “dil”). The error bars in histograms indicate SEM. Representative gel images are displayed underneath corresponding columns in histograms; assays were performed in triplicate.
Fig. 5.
Fig. 5.
Dose–response studies of FRI activity. (A) Schematic outline of in-cell assays probing IR autophosphorylation on binding of insulin. Flowchart illustrates procedure to assess hormone-induced IR signaling via in-cell illumination assay. On binding of insulin analogs, autophosphorylation was evaluated via 800-nm emissions mediated by antibody-conjugated signals; 700-nm readout provided cell-number control. (B) Fructose dependence of pIR/IR ratio on hormone-binding. Whereas extent of IR autophosphorylation was independent of fructose on binding of insulin lispro (“KP”; Left) or a DFC analog (Middle), FRI (Right) was activated when incubated with 50 mM [fructose] or higher; baseline activity was low. Orange asterisk indicates significant effect on 100 nM [insulin analog] on FRI activity. The asterisk (*) indicates P < 0.05 with respect to the treatment difference (0 vs 50 mM fructose) at an FRI dose of 100 nM. (C) Control studies using glucose instead of fructose show that the FRI was not affected by presence or absence of glucose (Right). As expected, glucose did not modulate the high baseline activities of KP (Left) and the diol-free control (Middle).
Fig. 6.
Fig. 6.
Fructose-dependent transcriptional signaling. (A) Schematic outline of qPCR-based assays of insulin-regulated gene regulation: (Top) insulin-dependent repression of gluconeogenic gene PEPCK and (Bottom) insulin-dependent activation of lipid-biosynthetic genes ChREBP and SREBP. (B and C) Transcriptional responses specific to PEPCK (Left) versus ChREBP and SREBP (Middle and Right, respectively) on addition of 50 mM fructose (B) or 50 mM glucose (C). Decreased downstream accumulation of PEPCK mRNA and increased ChREBP and SREBP mRNA reflect the activation stimulated by testing analogs in cellular metabolism pathways. Insulin lispro (“KP”) and DFC (“con”) exhibited no monosaccharide-dependent changes in their high baseline activities. Asterisks (*) and (**) indicate P value < 0.05 and < 0.01. The “ns” indicates P value > 0.05 (SI Appendix, Tables S1 and S2). Control studies were undertaken in the absence of insulin analogs to exclude potential confounding effects of 0 to 100 mM monosaccharides on metabolic gene expression (SI Appendix, Fig. S7).
Fig. 7.
Fig. 7.
Spectroscopic studies of FRI structure. (A) Far-UV CD spectra of insulin lispro (KP; black lines), FRI (green circles) and DFC (red squares) in 50 mM KCl and 10 mM phosphate (pH 7.4) at 25 °C without added glucose or fructose. (B and C) Difference spectra of FRI (B) and the DFC (C) +/− 100 mM glucose (dashed line) or +/− 100 mM fructose (dotted line). (D) 19F-NMR titration of FRI in the absence of a monosaccharide (black) and on addition of 50 mM (blue) and 100 mM (red) fructose. Peaks a and b indicated fructose-free 19F signals of m-fPBA; peak c is specific to the fructose complex. (E) 1H-NMR titration of FRI in methyl region: line broadening and changes in chemical shifts were observed on fructose-binding. Well-resolved methyl resonance assignments are as labeled (Top). Color code is as in panel (D). (F) 1H-NMR titration of FRI in aromatic region; selected resonance assignments are provided (Top). Spectra were acquired at a 1H frequency of 700 MHz (19F frequency of 658 MHz) at pD 7.8 (direct meter reading) and 25 °C. The protein concentration was ca 0.4 mM.
Fig. 8.
Fig. 8.
1H-13C HSQC spectra reveal fructose-dependent closed-open conformational transition and protein structure change in FRI on fructose-binding. (A) Aromatic region of 1H-13C HSQC spectra of FRI in absence of fructose are shown in black and on addition of 100 mM fructose in red. (B) Model study of DHBA-fPBA interaction. Aromatic 1H-13C HSQC spectrum of free DHBA-modified octapeptide is shown in red, free m-fPBA–modified octapeptide in green and their complex in black. (C) Methyl region of 1H-13C HSQC correlation spectra of FRI and (D) its DFC in absence of a saccharide are shown in black and in the presence of 100 mM fructose in red. (E) Methyl-aliphatic region of 1H-13C HSQC spectra of FRI and (F) DFC acquired in absence of a saccharide in black and in the presence of 50 mM glucose in green. Data were acquired at a 1H frequency of 600 MHz for FRI or 700 MHz for DFC at pD 7.4 (direct meter reading) and 25 °C. Asterisks in panel (D) and (F) indicate contaminants (also see SI Appendix, Fig. S15).
Fig. 9.
Fig. 9.
Structure of the insulin-saturated IR ectodomain. (A) IR ectodomain showing the disposition of two of the four insulins bound under insulin-saturated conditions (the remaining two insulins are obscured from view but are pseudosymmetry related to those shown). Receptor monomers are shown in light green and pink, respectively, whereas insulin A and B chains are shown in red and yellow, respectively. (B) Interaction of insulin with receptor Site 2', located on the surface of domain FnIII-1'. Colors are as in panel (A). Coordinates were obtained from PDB entry 6SOF (58). (C) Schematic depiction on subtle conformational change in T state on Site-2 binding to ectodomain stalk. Yellow segment indicates residues B1 to B4.
Fig. 10.
Fig. 10.
Switches in proteins can modulate degree of organization. (A) Schematic representation of “zinc finger” motif of a human enhancer binding protein (PDB entry 3ZNF) (62). Upon binding to Zn2+ ions, the random coil structure becomes more ordered, as shown by zinc finger structure on the Right. Side-chains of His and Cys residues are shown as sticks. (B) Left, schematic representation of a riboswitch that permits translation in the absence of ligand (Top) but inhibits when bound to ligand (Bottom) (64). Right, representative example of a riboswitch is provided by the crystal structure of Thermoanearobacter tengcongensis (Tte) metF SAM-I aptamer. Magnesium ions are represented as green spheres; ligand S-adenosyl-L-methionine (SAM) is shown as a CPK model in purple (88). (C) Phenol-induced reorganization of the insulin hexamer. Insulin hexamer adopts classical T6 conformation in presence of Zn2+ ions (Left) wherein residues B1 to B8 are extended (17). In the presence of phenol as an allosteric ligand, residues B1 to B8 adopt an α-helical conformation in R6 zinc hexamer (65). A- and B-chain ribbons are shown in light- and dark gray, respectively. The residues B1 to B8 shown in green for T6 (Left) and in red for R6 (Right). The phenolic ligands are shown as CPK models (purple); axial zinc ions are shown in blue. Coordinates were respectively obtained from PDB entries 1MSO (T6) and 1ZNJ (R6) (89, 90). (D) Schematic depiction of a glucose-responsive material. When given glucose as substrate, matrix-bound enzyme glucose oxidase converts glucose to gluconic acid, which in turn lowers pH to cause swelling of hydrogel, releasing encapsulated insulin (68, 91).

Comment in

References

    1. De Meyts P., Whittaker J., Structural biology of insulin and IGF1 receptors: Implications for drug design. Nat. Rev. Drug Discov. 1, 769–783 (2002). - PubMed
    1. Menting J. G., et al., How insulin engages its primary binding site on the insulin receptor. Nature 493, 241–245 (2013). - PMC - PubMed
    1. Xu Y., et al., How ligand binds to the type 1 insulin-like growth factor receptor. Nat. Commun. 9, 821–833 (2018). - PMC - PubMed
    1. Smith B. J., et al., Structural resolution of a tandem hormone-binding element in the insulin receptor and its implications for design of peptide agonists. Proc. Natl. Acad. Sci. U.S.A. 107, 6771–6776 (2010). - PMC - PubMed
    1. Weis F., et al., The signalling conformation of the insulin receptor ectodomain. Nat. Commun. 9, 4420 (2018). - PMC - PubMed

Publication types