. 2021 Jul 21;12(1):4447.
doi: 10.1038/s41467-021-24785-3.

3-hydroxy-L-kynurenamine is an immunomodulatory biogenic amine

Affiliations

3-hydroxy-L-kynurenamine is an immunomodulatory biogenic amine

Cristina C Clement et al. Nat Commun. .

Abstract

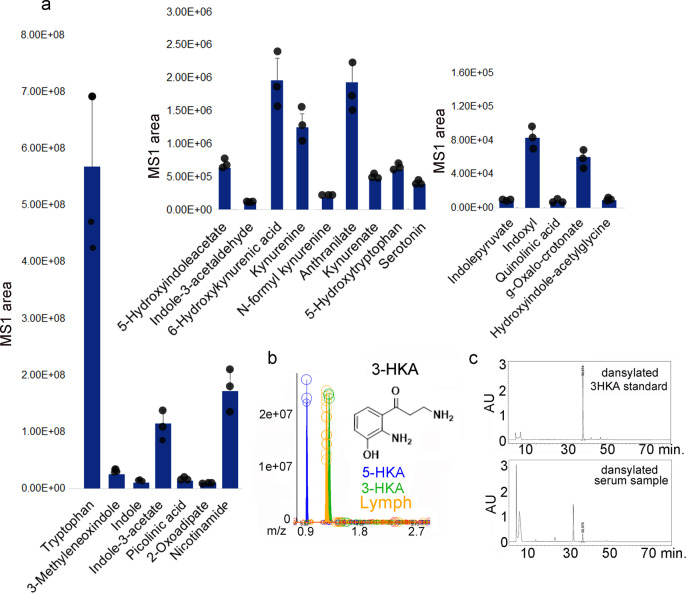
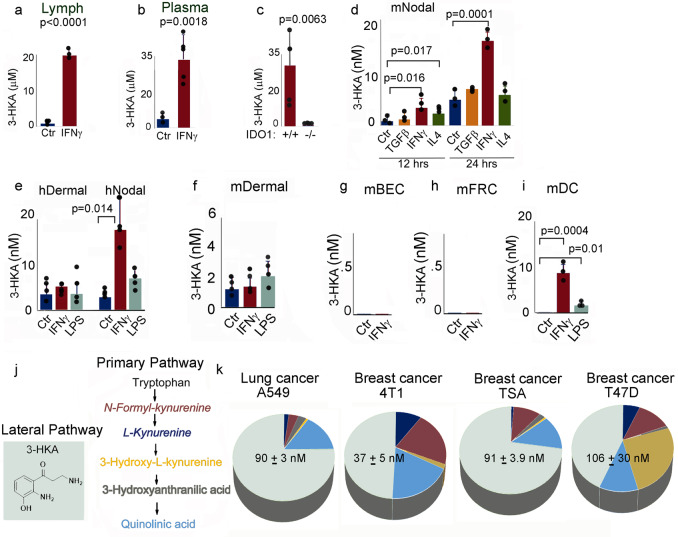
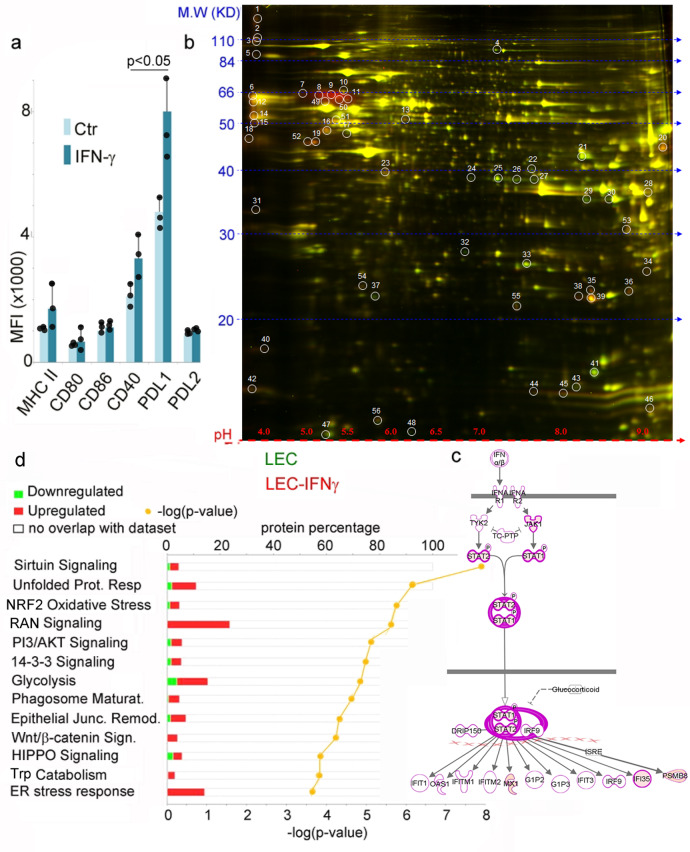
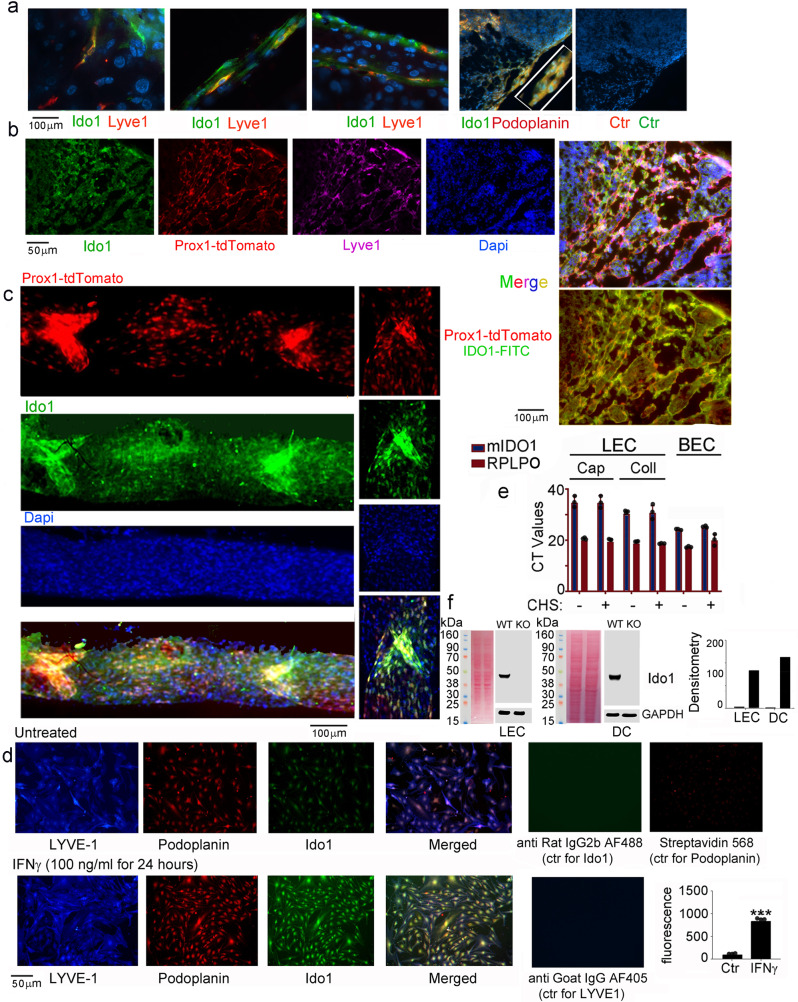
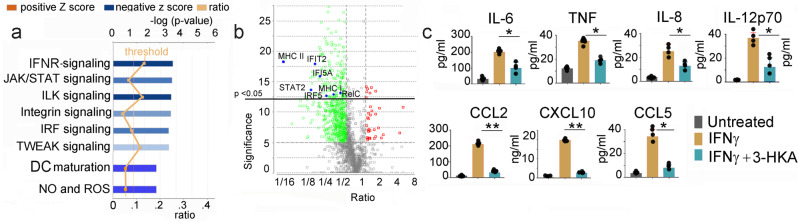
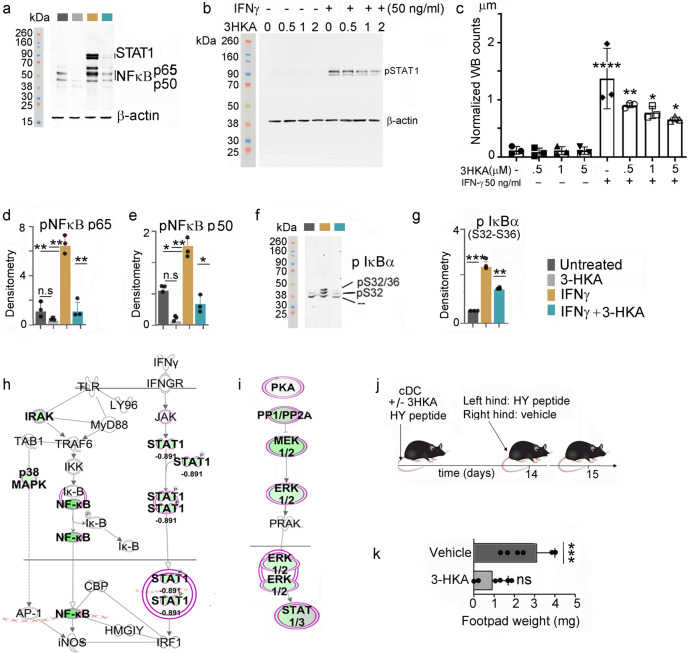
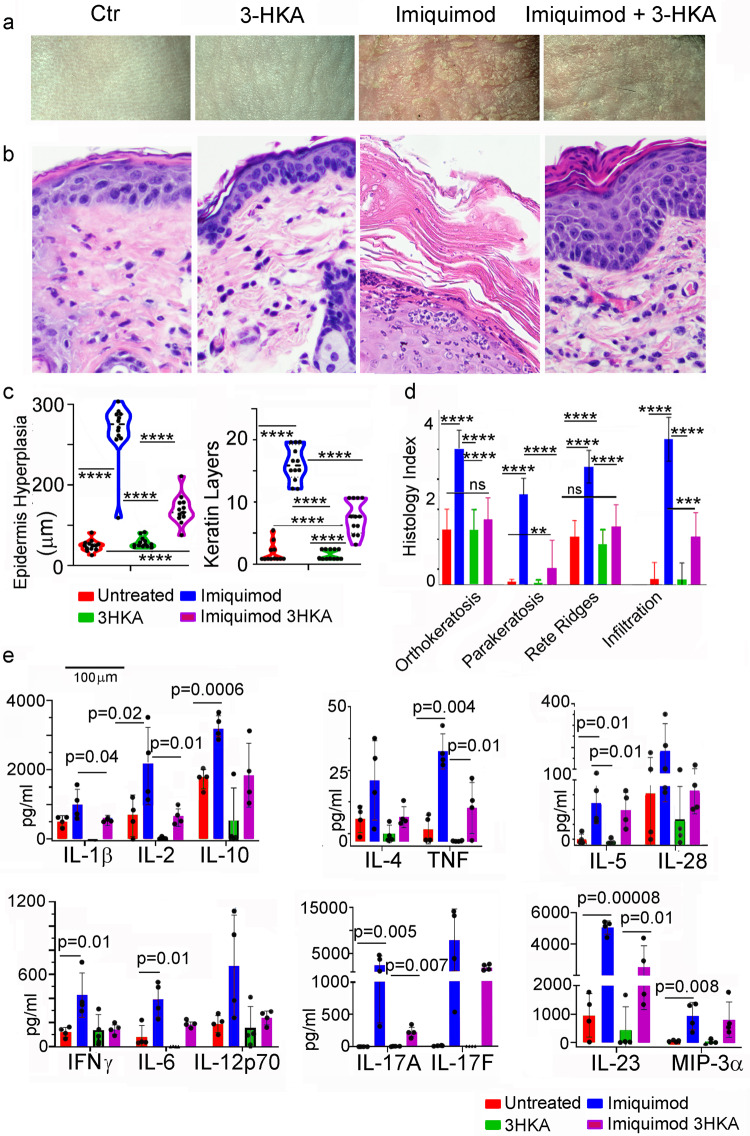
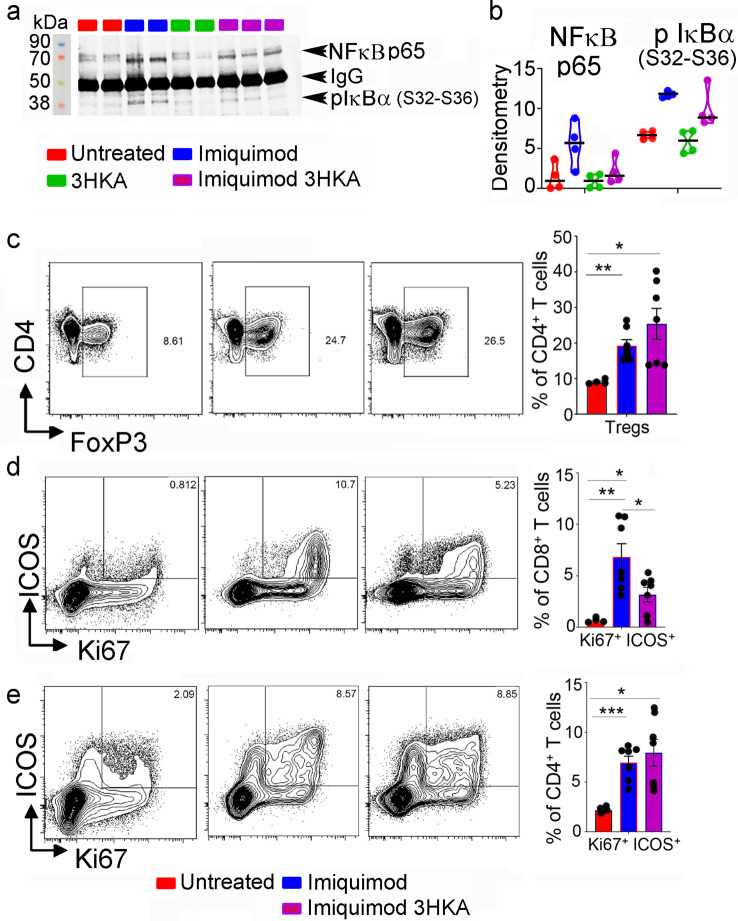
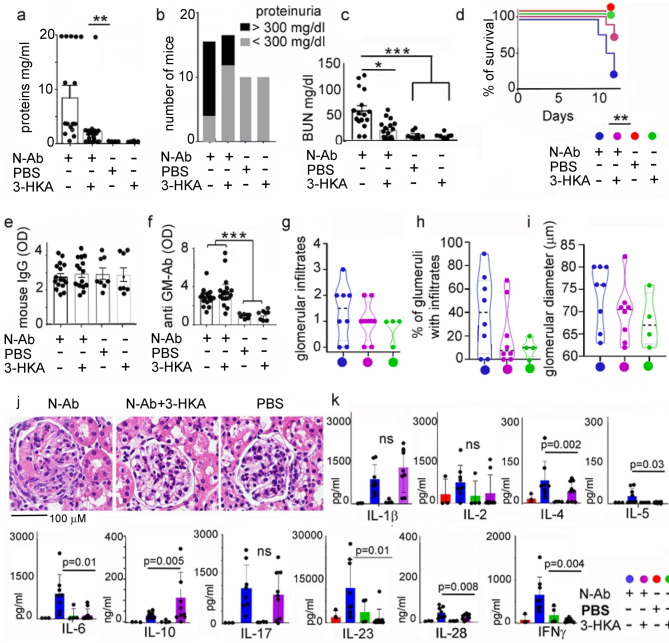
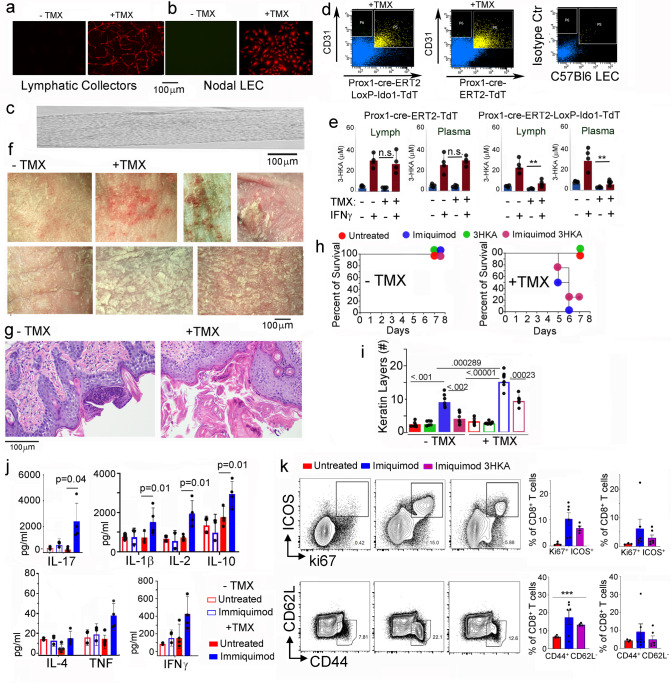
Tryptophan catabolism is a major metabolic pathway utilized by several professional and non-professional antigen presenting cells to maintain immunological tolerance. Here we report that 3-hydroxy-L-kynurenamine (3-HKA) is a biogenic amine produced via an alternative pathway of tryptophan metabolism. In vitro, 3-HKA has an anti-inflammatory profile by inhibiting the IFN-γ mediated STAT1/NF-κΒ pathway in both mouse and human dendritic cells (DCs) with a consequent decrease in the release of pro-inflammatory chemokines and cytokines, most notably TNF, IL-6, and IL12p70. 3-HKA has protective effects in an experimental mouse model of psoriasis by decreasing skin thickness, erythema, scaling and fissuring, reducing TNF, IL-1β, IFN-γ, and IL-17 production, and inhibiting generation of effector CD8+ T cells. Similarly, in a mouse model of nephrotoxic nephritis, besides reducing inflammatory cytokines, 3-HKA improves proteinuria and serum urea nitrogen, overall ameliorating immune-mediated glomerulonephritis and renal dysfunction. Overall, we propose that this biogenic amine is a crucial component of tryptophan-mediated immune tolerance.


Conflict of interest statement

L.S. declares that 3-HKA is covered by patent application # PCT/US2019/21731 to Albert Einstein College of Medicine. The other authors declare no competing interests.

Figures

Fig. 1
Fig. 1. Lymphatic fluid contains several tryptophan metabolites.
a Bar graphs reporting the MS1 area of tryptophan metabolites detected in the human lymph. Bar graphs represent MS1 average readings ± SD of n = 3 biological replicates. Source data are provided as a Source data file. b Standards used for identification/quantification of 3-hydroxykynurenamine (3-HKA) vs 5-hydroxy-l-kynurenamine by mass spectrometry. c 3-HKA was reacted with dansylchloride producing the di-dansylated 3-hydroxykynurenamine derivative (Supplementary Figs. 1 and 2). The stable derivatization product was quantitatively analyzed by HPLC-DAD.
Fig. 2
Fig. 2. 3-HKA is generated in vivo and in vitro following IFN-γ treatment.
a, b Quantification of 3-HKA in lymph and plasma before and after i.p. injection of IFN-γ (5 μg). Lymph (n = 3 biologically independent samples) and blood samples (n = 3 and n = 5 biologically independent samples) were statistically analyzed using a two-tailed paired or unpaired student’s t test. c Quantification of 3-HKA in the plasma of C57BL/6J mice and Ido1 ko mice. Average ± SD of n = 4 biologically independent samples, statistically analyzed using a two-tailed paired student’s t test. d Nodal mouse LECs were cultured in serum-free media for 12 or 24 h with the indicated cytokines. 3-HKA is reported as average concentration ± SD of n = 3 biologically independent samples, statistically analyzed using a two-tailed paired student’s t test. e Nodal and dermal human LECs and mouse dermal LEC were cultured in serum-free media for 24 h with or without IFN-γ (100 ng/ml) or LPS (1 μg/ml). 3-HKA concentration is reported as average concentration ± SD of n = 4 biologically independent replicates statistically analyzed using a two-tailed paired student’s t test. f Dermal mouse LECs were cultured in serum-free media for 24 h with or without IFN-γ (100 ng/ml) or LPS (1 μg/ml). Data are reported as average 3-HKA concentration ± SD of n = 4 biologically independent replicates, statistically analyzed using a two-tailed paired Student’s t test. g, h, i Mouse blood endothelial cells (BEC) and fibroblast reticular cells (FRC) were cultured in serum-free media for 24 h with or without IFN-γ (100 ng/ml) and supernatant analyzed as in (e). i Mouse splenic CD11c-purified dendritic cells (DCs) were cultured in serum-free media for 24 h with or without IFN-γ (50 ng/ml) or LPS (1 μg/ml) and supernatant analyzed as in (e). Data are reported as average 3-HKA concentration ± SD of n = 3 biologically independent replicates, analyzed using a two-tailed paired Student’s t test. j, k Mouse 4T1 and TSA breast carcinoma and human A549 lung and T47D breast carcinoma cells were analyzed for the presence of Trp metabolites (percentage of each metabolite in the supernatant is reported color-coded for each line). 3-HKA concentration ± SD of n = 3 biologically independent replicates. Source data for (ak) are provided as Source data file.
Fig. 3
Fig. 3. IFN-γ-stimulated LEC upregulate enzymes of tryptophan catabolism.
a Bar graph reporting the mean fluorescence index and standard deviation of n = 3 biologically independent replicates of FACS analysis for MHC class II and co-stimulatory molecules present at the cell surface of LEC untreated or treated with IFN-γ (100 ng/ml for 24 h). Averages were statistically analyzed using a two-tailed paired student’s t test. b 2DIGE of cell lysates (25 μg of protein) treated as in (a): lysates from untreated cells were labeled with Cy3 (green) and lysates from IFNγ cells were labeled with Cy5 (red). Proteins were resolved on a 4–20% SDS-PAGE gels and gel images were acquired on a Typhoon 9400 scanner and analyzed using DeCyder Software (V6.0, GE Healthcare). Spots with a LEC/LEC IFN-γ ratio 2.5< or >2.5 were collected for MS/MS analysis (Supplementary Data 1) (n = 1). c, d The 2DIGE analysis (in b) was complemented with label-free quantitation (LFQ) proteomic analysis of n = 3 biologically independent replicates (triplicates of untreated or IFNγ-treated LEC as in (b). Data are available at ProteomeXchange Consortium via the PRIDE partner repository with the dataset identifier PXD015865. Pathway analysis of LEC proteins up- or downregulated following IFN-γ treatment. Data were analyzed with IPA (QIAGEN Inc., https://www.qiagenbioinformatics.com/products/ingenuity-pathway-analysis). For network generation, datasets containing gene identifiers (gene symbols) were uploaded into the IPA application together with their rescaled log2 transformation of protein’s area ratios, extracted from label-free quantitative (LFQ) MS1 analysis provided by the PEAKS Q module implemented in PEAKS 8.0/8.5. The probability of having a relationship between each IPA indexed biological function and the experimentally determined genes was calculated by the right-tailed built-in Fisher’s exact test. The level of significance was set to a p-value of <0.05. c, d IPA-predicted upregulation (in red) of inflammatory pathways in IFNγ-treated LEC, including (c) STAT1-mediated intracellular signaling.
Fig. 4
Fig. 4. Nodal LECs express IDO1.
a, b Immunofluorescence of inguinal lymph nodes harvested from Ctr or Prox1-td-Tomato mice to detect LYVE-1+, Podoplanin+ LECs, which are also positive for IDO1 staining (n = 3 biologically independent replicates). c Immunofluorescence of the thoracic duct harvested from Prox1-td-Tomato mice stained for IDO1 (n = 3 biologically independent replicates). Twenty-four hours prior to the harvesting mice were injected (i.p.) with 5 μg of IFN-γ. The image depicts a lymphangion, which is the lymphatic vessel area between two valves (one of the valve areas is magnified (×40)). d Nodal LEC were grown on 0.1% gelatin-coated glass coverslip in a petri dish and left untreated or treated ON with 100 ng/ml IFNγ). Cells were then fixed with 4% PFA and permeabilized in 0.1% Triton X-100. After blocking with 2% BSA, cells were incubated with the following conjugated primary antibodies: AF488 anti-mouse Lyve 1; PE anti-mouse podoplanin; AF488-anti-mouse CD31 (n = 3 biologically independent replicates). Fluorescence averages were statistically analyzed using a two-tailed paired Student’s t test p < 0.001 (***). e qPCR analysis of the Ido1 mRNA transcript in LECs, collected from lymphatic capillaries (Cap) or lymphatic collectors (Coll) and blood endothelial cells (BECs). LECs and BECs were FACS-sorted from control mice or mice where contact hypersensitivity (CHS) was induced in the ear skin by topical application of 2% oxazolone (mean ± SD from biological replicates (n = 3), each calculated from 3 technical replicates). f IDO1 Western blot analysis of LEC and DC lysates harvested from wild-type and Ido1 ko mice cultured with IFN-γ (50 ng/ml) to maximize IDO1 expression. Bar graphs represent densitometry average readings ± SD of n = 2 biologically independent replicates. Source data for (af) are provided as Source data file.
Fig. 5
Fig. 5. 3-HKA confers immunosuppressive properties to DCs.
a Quantitative IPA analysis depicting biochemical pathways predicted to be up- (orange) or downregulated (blue) in mouse splenic DCs following treatment with 50 ng/ml IFNγ for 24 h in presence or absence of 1 μM 3-HKA, as analyzed by label-free quantitative (LFQ) proteomics. The proteomic data are available at ProteomeXchange Consortium via the PRIDE partner repository with the dataset identifier PXD015865. For network generation, datasets containing gene identifiers (gene symbols) were uploaded into the IPA application together with their rescaled log2 transformation of average protein’s area ratios which were extracted from label-free quantitative (LFQ) MS1 analysis provided by the PEAKS Q module implemented in PEAKS 8.0/8.5. The probability of having a relationship between each IPA indexed biological function and the experimentally determined genes was calculated by the right-tailed built-in Fisher’s exact test. The level of significance was set to a p-value of <0.05. b Volcano-plot of the mouse splenic DC proteome from cells treated with 50 ng/ml IFNγ for 24 h in presence or absence of 1 μM 3-HKA (Supplementary Fig. 4a). Proteins in green are downregulated while those in red are upregulated (full proteomic data analysis is presented in Supplementary Data 2). Statistical significance (by one-way ANOVA for group comparison built-in the PEAKS X software) of p < 0.05 is represented by the horizontal line. c Quantitative analysis of pro-inflammatory chemokines and cytokines secreted by monocytes-derived human DCs treated or untreated with 1 µM 3-HKA and with 50 ng/ml IFN-γ for 24 h. Data are reported as average ± SD of n = 4 biologically independent replicates (each calculated from 3 technical replicates). Significance levels are reported as p < 0.05 (*), p < 0.01 (**), and p < 0.001 (***) (two-way ANOVA followed by Tukey’s multiple comparison test). Source data are provided as Source data file.
Fig. 6
Fig. 6. 3-HKA inhibits IFN-γ-mediated STAT1/NFκB activation.
a Representative immunoblot analysis of STAT1 and the NF-κΒ pathway-associated proteins p65 and p50 from human monocyte-derived DCs treated or untreated with 1 µM 3-HKA with or without 50 ng/ml IFN-γ for 20 min. b Representative immunoblot analysis of pSTAT1 from human monocyte-derived DCs treated or untreated with titrated amounts of 3-HKA with or without 50 ng/ml IFN-γ at different time points. c, d, e Densitometric analysis of triplicate immunoblots as reported in (a) and (b). Data of n = 3 biologically independent replicates are plotted as mean relative expression ± SD. Significance levels are reported as p < 0.05 (*), p < 0.01 (**), and p < 0.0001 (****) (two-way ANOVA followed by Tukey’s multiple comparison test). f Representative immunoblot analysis of pIκΒα from human monocyte-derived DCs treated or untreated with 1 µM 3-HKA with or without 50 ng/ml IFN-γ for 20 min. g Densitometric analysis of triplicate Western blots as reported in (g). Data of n = 3 biologically independent replicates are plotted as mean relative expression ± SD. Significance levels are reported as p < 0.05 (*), p < 0.01 (**), and p < 0.001 (***) (two-way ANOVA followed by Tukey’s multiple comparison test). h, i IPA-predicted quantitative decrease of proteins associated with the IFN-γ-mediated signal transduction in mouse DCs treated with 3-HKA and IFN-γ as compared with IFN-γ treatment alone (generated from data reported in Supplementary Data 2). j Scheme of the delayed hypersensitivity skin test assay. k In vivo suppression activity of HY-pulsed CD8CD11c+ DCs (cDC) in combination with a minority fraction (5%) of the same DCs with no conditioning or conditioned in vitro with 1 µM 3-HKA for 24 h. Analysis of the delayed hypersensitivity skin reactivity of recipient mice to the eliciting peptide at 15 days is presented as change in footpad weight (experimental versus control footpads). Data are reported as average footpads weight ± SD of n = 6 biologically independent replicates. Data were analyzed by paired T test (Wilcoxon test), ***p < 0.001. Source data for (ag) and (k) are provided as Source data file.
Fig. 7
Fig. 7. 3-HKA treatment reduces psoriasis-associated skin inflammation.
ad Psoriasis was induced in C57BL/6 mice by shaving a “1 × 1” area on the mouse back and applying the TLR7 agonist imiquimod for 7 days (imiquimod). Some of the mice were also treated with 3-HKA alone (3-HKA) or in combination with imiquimod (imiquimod + 3-HKA) (3-HKA; 50 mg/kg i.p.; for 7 days). Controls are mice that were shaved but left untreated (Ctr). After 7 days, mice were sacrificed and skin harvested for histological analysis. Each skin sample was evaluated blindly by a board-certified veterinary pathologist for psoriasis-form features. Each sample was evaluated at three randomly chosen regions. n = 12 biologically independent replicates. bd Features that were assessed were adapted from Baker et al. and included those of the keratin layer (orthokeratosis, parakeratosis), epidermis (hyperplasia, formation of rete ridges, ulceration), and the dermis (lymphocytic infiltration, superficial congestion, hemorrhage, necrosis). The severity of each finding was scored semi-quantitatively as follows: 0 = no lesion; 1 = minimal; 2 = mild; 3 = moderate; 4 = severe. c, d Statistical analysis refers to pooled data from n = 12 biologically independent replicates. Data are reported as average ± SD for each histological parameter. Significance levels are reported as p < 0.05 (*), p < 0.01 (**), and p < 0.001 (***) (two-way ANOVA followed by Tukey’s multiple comparison test). e Quantitative analysis of pro-inflammatory chemokines and cytokines present in skin lysates from the same mice reported in (a) using the mouse Th1/Th2/Th17 Array Q1 (Raybiotech). Data from n = 4 biologically independent replicates are reported as average ± SD. Significance levels are reported as p < 0.05 (*), p < 0.01 (**), and p < 0.001 (***) (two-way ANOVA followed by Tukey’s multiple comparison test). Source data for (ae) are provided as Source data file.
Fig. 8
Fig. 8. 3-HKA treatment reduces inflammatory infiltration in psoriasis.
a Representative immunoblot analysis of the NF-κΒ pathway-associated proteins p65 and pIκΒα as detected in skin samples from the same mice reported in (Fig. 7a). b Densitometry of immunoblot blot bands was normalized to IgG levels present in skin lysates. Data from n = 4 biologically independent replicates are reported as average ± SD. Significance levels are reported as p < 0.05 (*), p < 0.01 (**), and p < 0.001 (***) (two-way ANOVA followed by Tukey’s multiple comparison test). c) Flow cytometry analysis of lymph node of untreated (n = 4), imiquimod (n = 7), or 3-HKA plus imiquimod-treated C57BL/6J mice (n = 7). Representative plot of CD4+/FoxP3+ cells. Bar graph report % of CD4+/FoxP3+ cells for each analyzed mouse. Data are reported as average ± SEM analyzed by unpaired Student’s t test, two-tailed (untreated vs. imiquimod—**p = 0.0017, untreated vs. imiquimod 3-HKA—*p = 0.022, imiquimod vs imiquimod 3-HKA—ns p = 0.219). d Representative plot of ICOS+/Ki67+ CD8+ T cells. Bar graph report % of ICOS+/Ki67+ CD8 T cells for each analyzed mouse. Untreated (n = 4), imiquimod (n = 7), or 3-HKA plus imiquimod-treated C57BL6/J mice (n = 7). Data are reported as average ± SEM analyzed by unpaired student’s t test, two-tailed (untreated vs imiquimod—**p = 0.0054, untreated vs. imiquimod plus 3-HKA—*p = 0.021, imiquimod vs imiquimod plus 3-HKA—*p = 0.028). e Representative plot of ICOS+/Ki67+CD4+ T cells. Bar graph report % of ICOS+/Ki67+CD4+ T cells for each analyzed mouse. Untreated (n = 4), imiquimod (n = 7), or 3-HKA plus imiquimod-treated C57BL6/J mice (n = 7). Data are reported as average ± SEM analyzed by unpaired Student’s t test, two-tailed (untreated vs. imiquimod—***p = 0.0004, untreated vs. imiquimod plus 3-HKA—*p = 0.0112, imiquimod vs imiquimod 3-HKA—ns p = 0.512) (Supplementary Fig. 5). Source data for (ac) are provided as Source data file.
Fig. 9
Fig. 9. 3-HKA treatment decreases nephrotoxic nephritis.
ad Nephrotoxic nephritis was induced at day 0 in 129/Sv mice as detailed in the methods. Starting at day +4, mice received daily i.p. injections of 3-HKA or vehicle (VC) control until sacrifice. N-Ab group n = 16; N-Ab+3-HKA group n = 18; PBS group n = 10; 3-HKA group n = 10. a Proteinuria levels at sacrifice are reported as average ± SD and statistically evaluated using two-way ANOVA followed by Tukey’s multiple comparison test. N-Ab group n = 16; N-Ab+3-HKA group n = 18; PBS group n = 10; 3-HKA group n = 10. p < 0.05 (*), p < 0.01 (**), and p < 0.001 (***). b The number of mice in each group at sacrifice that reached the predetermined cut-off value for severe proteinuria of >300 mg/dl. c Blood urea nitrogen (BUN) levels, measured at sacrifice, are reported as average ± SD and statistically evaluated using two-way ANOVA followed by Tukey’s multiple comparison test. N-Ab group n = 16; N-Ab+3-HKA group n = 18; PBS group n = 10; 3-HKA group n = 10. p < 0.05 (*), p < 0.01 (**), and p < 0.001 (***). d Survival curve among the different treatments. e, f All groups of mice developed similar titers of mouse anti-rabbit Ab and anti-GBM Ab. Data are reported as average ± SD and statistically evaluated using two-way ANOVA followed by Tukey’s multiple comparison test. N-Ab group n = 16; N-Ab+3-HKA group n = 18; PBS group n = 10; 3-HKA group n = 10. p < 0.05 (*), p < 0.01 (**), and p < 0.001 (***). gj Each kidney was evaluated blindly by a board-certified veterinary pathologist at three randomly chosen regions. Features that were assessed included glomerular infiltrates, % of glomeruli with immune infiltrates and glomerular diameter (μm). The severity of each finding was scored semi-quantitatively as follows: 0 = no infiltration; 1 = minimal; 2 = mild; 3 = moderate; 4 = severe. N-Ab group n = 16; N-Ab+3-HKA group n = 18; PBS group n = 10; 3-HKA group n = 10. k Quantitative cytokine analysis in kidney lysates from the same mice reported in (a). Data are reported as average ± SD and evaluated using two-way ANOVA followed by Tukey’s multiple comparison test N-Ab group n = 8; N-Ab+3-HKA group n = 9; PBS group n = 4; 3-HKA group n = 4. Source data for (gk) are provided as Source data file.
Fig. 10
Fig. 10. Deletion of IDO1 in lymphatic endothelial cells exacerbates psoriasis.
a Lymphatic collectors from Prox1-cre-ERT2-TdT-LoxP-IDO1 mice, visualized after tamoxifen treatment (+TMX), vs untreated (−TMX) (n = 24 biologically independent replicates). b Nodal LECs express tdTomato only after tamoxifen treatment (+TMX) (n = 24 biologically independent replicates). c Thoracic ducts and lymph nodes were harvested from tamoxifen-treated Prox1-Cre-ERT2-TdT-LoxP-Ido1 mice and tamoxifen-treated Prox1-Cre-ERT2-TdT controls (n = 24 biologically independent replicates). d LECs were sorted from the same mice as in (c) using CD31 and TdTomato as markers (n = 12 biologically independent replicates). e 3-HKA quantification in the lymphatic fluid and plasma (n = 4 biologically independent samples) of Prox1-Cre-ERT2-TdT-LoxP-Ido1 mice and Prox1-Cre-ERT2-TdT controls treated (+TMX) or untreated (−TMX) with tamoxifen. Data are presented as average ± SD of biological quadruplicates (n = 4) and analyzed by two-tailed paired student’s t test, p < 0.01 (**). fi Psoriasis was induced in the Prox1-cre-ERT2-TdT-LoxP-Ido1 as described in Fig. 7, a more severe psoriasis as indicated by (f, g, i) histological evaluation and (h) animal survival curve, of tamoxifen-treated mice (+TMX) as compared to the untreated animals (−TMX) (n = 12 biologically independent samples). i Histological quantification is presented as number of keratin layers, quantified in biological replicates ± SD (n = 7 biologically independent samples). Data are presented as average ± SEM analyzed by two-tailed paired student’s t test. j Quantitative analysis of pro-inflammatory chemokines and cytokines present in skin lysates from Prox1-cre-ERT2-TdT-LoxP-Ido1 mice (+TMX) and (−TMX) tamoxifen, 4 days after psoriasis induction. Data from independent biological replicates (n = 4) plotted as mean relative expression ± SD. Significance levels are reported as p < 0.05 (*), p < 0.01 (**), and p < 0.001 (***) (two-way ANOVA followed by Tukey’s multiple comparison test). k Flow cytometry analysis of lymph node from the same mice as in (g, h); representative plot of ICOS+/Ki67+ CD8+ T cells. Bar graph report % of ICOS+/Ki67+ CD8+ T cells for each analyzed mouse and representative plot of CD44+/CD62L CD8+ T cells. 3-HKA (n = 4), imiquimod (n = 6), or 3-HKA plus imiquimod-treated C57BL/6J mice (n = 4). Data are presented as average ± SEM analyzed by two-tailed unpaired student’s t test, p < 0.001 (***). Source data for (ac) and (jk) are provided as Source data file.

References

    1. Belladonna ML, et al. Kynurenine pathway enzymes in dendritic cells initiate tolerogenesis in the absence of functional IDO. J. Immunol. 2006;177:130–137. doi: 10.4049/jimmunol.177.1.130. - DOI - PubMed
    1. Puccetti P, Grohmann U. IDO and regulatory T cells: a role for reverse signalling and non-canonical NF-kappaB activation. Nat. Rev. Immunol. 2007;7:817–823. doi: 10.1038/nri2163. - DOI - PubMed
    1. Grohmann U, Fallarino F, Puccetti P. Tolerance, DCs and tryptophan: much ado about IDO. Trends Immunol. 2003;24:242–248. doi: 10.1016/S1471-4906(03)00072-3. - DOI - PubMed
    1. Amobi A, Qian F, Lugade AA, Odunsi K. Tryptophan catabolism and cancer immunotherapy targeting IDO mediated immune suppression. Adv. Exp. Med Biol. 2017;1036:129–144. doi: 10.1007/978-3-319-67577-0_9. - DOI - PubMed
    1. Katz JB, Muller AJ, Prendergast GC. Indoleamine 2,3-dioxygenase in T-cell tolerance and tumoral immune escape. Immunol. Rev. 2008;222:206–221. doi: 10.1111/j.1600-065X.2008.00610.x. - DOI - PubMed

Publication types

MeSH terms