. 2021 Jul 21;12(1):4445.
doi: 10.1038/s41467-021-24767-5.

A human CD137×PD-L1 bispecific antibody promotes anti-tumor immunity via context-dependent T cell costimulation and checkpoint blockade

Affiliations

A human CD137×PD-L1 bispecific antibody promotes anti-tumor immunity via context-dependent T cell costimulation and checkpoint blockade

Cecile Geuijen et al. Nat Commun. .

Abstract

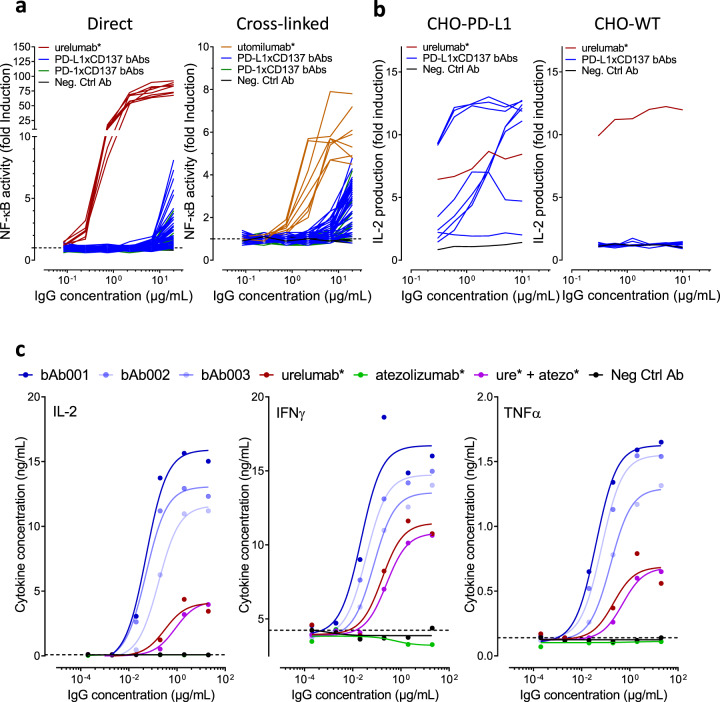
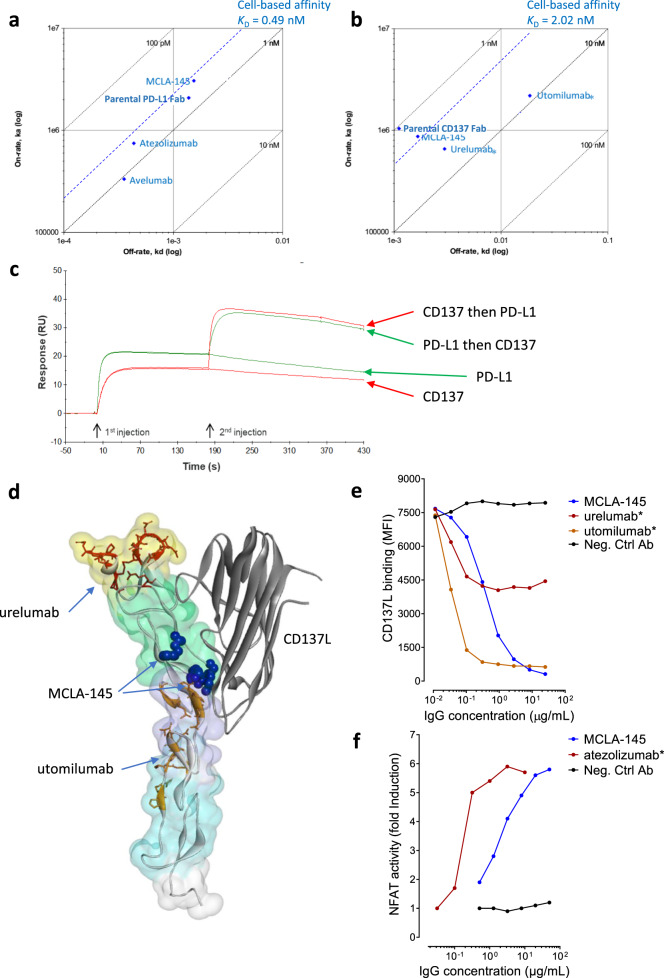
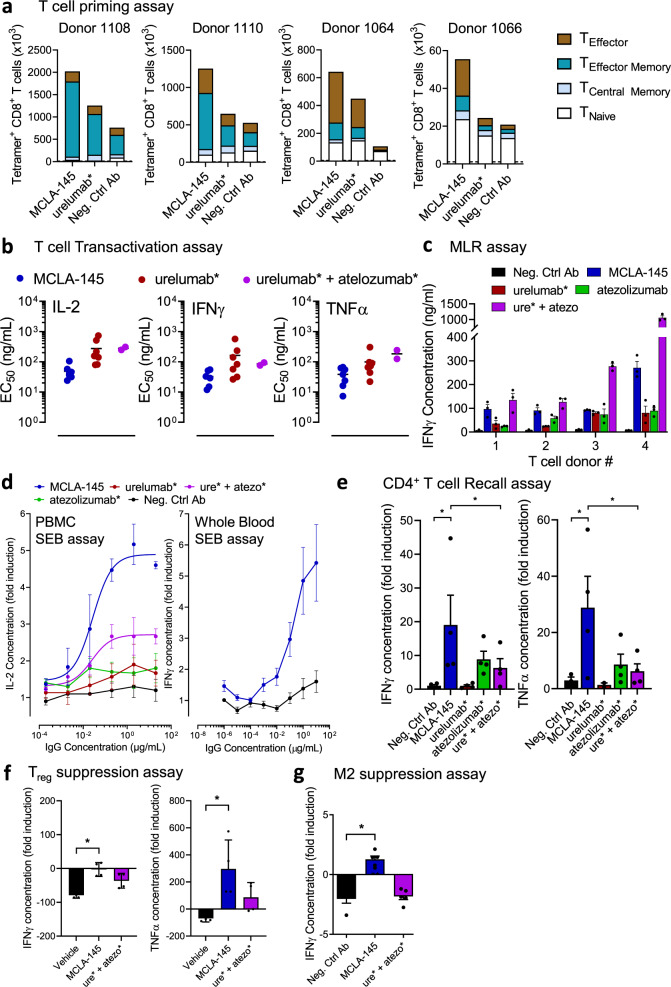
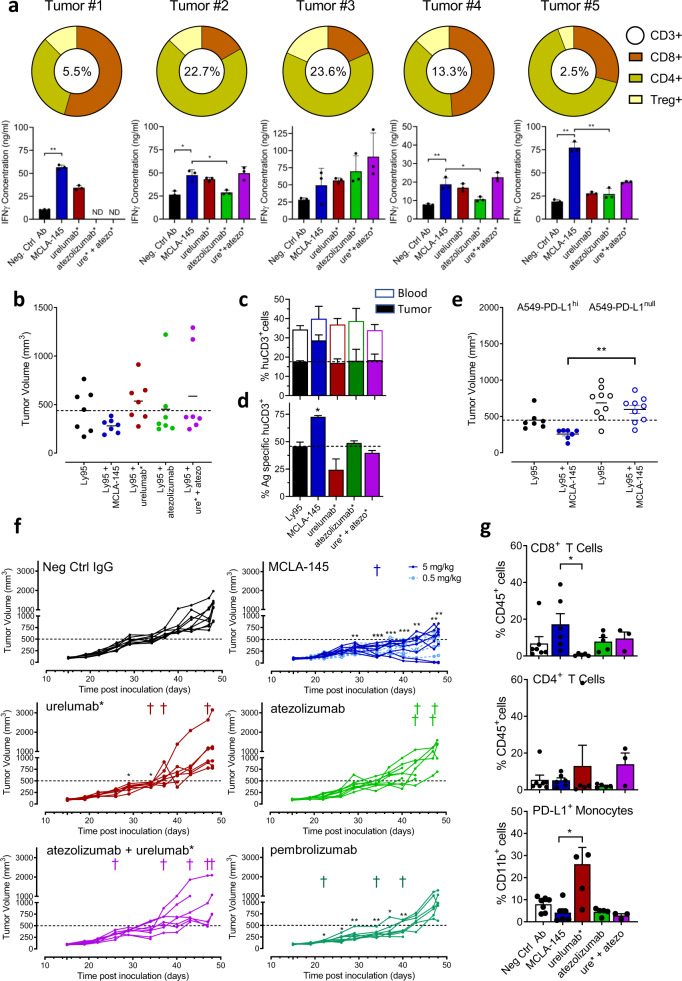
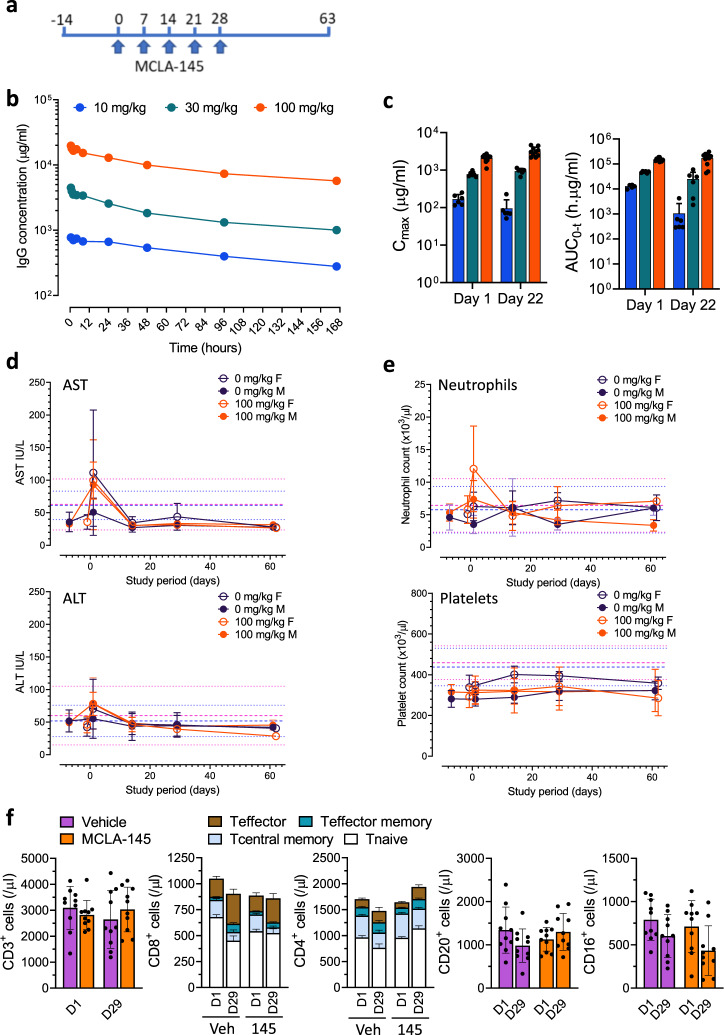
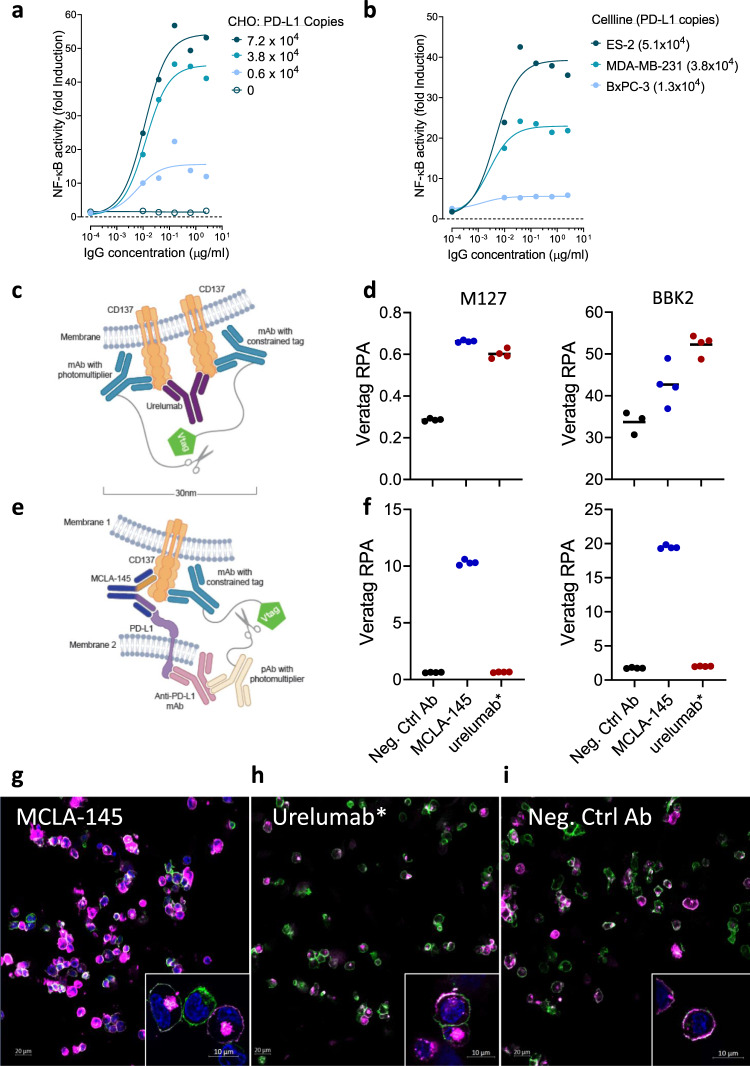
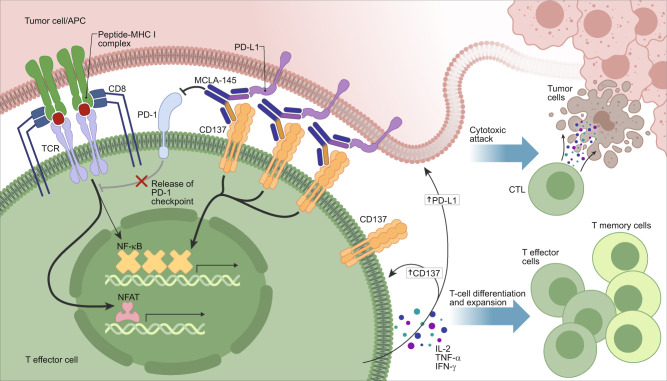
Immune checkpoint inhibitors demonstrate clinical activity in many tumor types, however, only a fraction of patients benefit. Combining CD137 agonists with these inhibitors increases anti-tumor activity preclinically, but attempts to translate these observations to the clinic have been hampered by systemic toxicity. Here we describe a human CD137xPD-L1 bispecific antibody, MCLA-145, identified through functional screening of agonist- and immune checkpoint inhibitor arm combinations. MCLA-145 potently activates T cells at sub-nanomolar concentrations, even under suppressive conditions, and enhances T cell priming, differentiation and memory recall responses. In vivo, MCLA-145 anti-tumor activity is superior to immune checkpoint inhibitor comparators and linked to recruitment and intra-tumor expansion of CD8 + T cells. No graft-versus-host-disease is observed in contrast to other antibodies inhibiting the PD-1 and PD-L1 pathway. Non-human primates treated with 100 mg/kg/week of MCLA-145 show no adverse effects. The conditional activation of CD137 signaling by MCLA-145, triggered by neighboring cells expressing >5000 copies of PD-L1, may provide both safety and potency advantages.


Conflict of interest statement

C.G., P.T., R.K., P.L., A.Kr, L.J.H., H.M., E.R., S.E., F.F., R.B., V.Z.vZ., A.B., W.B., W.M., A.B.H.B., T.L., J.K., and M.T. are employees of Merus N.V. L.C.W., J.Z., A.M., C.H., T.C., A.V., C.K., A.Ku, Y.L., L.H., S.H., S.S., H.N., P.S., G.H., R.H., and P.M. are employees of Incyte Inc. C.G., M.T., P.T., R.K., J.K., and T.L. are inventors on intellectual property related to this work. E.M. and S.A. received grant funding from Incyte. The remaining authors declare no competing interests.

Figures

Fig. 1
Fig. 1. Screening of CD137 x PD-1/PD-L1 bAb combinations identifies MCLA-145.
a Left panel activity of CD137xPD-L1 and CD137xPD-1 bispecifics in a CD137 NFκB-luc reporter assay (fold induction of luciferase signal) Right panel experiment repeated with the addition of an Fc binding antibody; b Left panel levels of IL-2 released by activated T cells after 3 days of incubation with eight candidate CD137xPD-L1 bAb combinations in a dose titration in the presence of CHO-PD-L1 cells, Right panel, experiment repeated in the presence wildtype CHO cells; c levels of IL-2, IFNγ and TNFα released by activated T cells after 3 days of incubation with the three best performing CD137xPD-L1 bAbs and control antibodies in a dose titration in the presence of CHO-PD-L1 cells (bAb001 = MCLA-145).
Fig. 2
Fig. 2. MCLA-145 binds with high affinity and to a unique epitope on CD137.
a Summary of SPR and cell-based affinity measurements for binding to PD-L1; b Summary of SPR and cell-based affinity measurements for binding to CD137; c SPR affinity analysis showing dual binding of human PD-L1 and CD137 to immobilized MCLA-145. Green curves: human PD-L1 injected first followed by injection of human CD137 or running buffer. Red curves: human CD137 injected followed by human PD-L1 or running buffer; d surface homology model of the CD137 ectodomain in complex with CD137L (PDB: 6MGP), the CRD domains 1–4 are shaded in yellow, green, purple and cyan respectively, CD137L is depicted as a gray ribbon, the backbone and residues of urelumab* (dark red) and utomilumab* (orange) epitopes are highlighted, critical binding residues for MCLA-145 as determined by alanine scanning are shown as solid blue spheres; e binding of labeled CD137L to CHO-CD137+ cells was measured by flow analysis in a titration series of MCLA-145 and control antibodies f NFAT activity of PD-1 reporter cells cocultured with CHO-PD-L1+ and incubated with a titration of MCLA-145 and control antibodies.
Fig. 3
Fig. 3. Effects of MCLA-145 activity on primary T cell function.
a Effect of MCLA-145 on naïve CD8+ T cell priming. Graphs show the absolute number of dextramer+ antigen-specific CD8+ T cells from four donors after 10 days of co-culture with colored segments indicating the number of T naïve/memory stem cells (CD45RA + CCR7+), central memory T cells (CD45RA-CCR7+), effector memory T cells (CD45RA-CCR7-) and terminally differentiated effector T cells (CD45RA + CCR7−) as determined by flow cytometry (Dotted line represents control co-cultures without peptide priming). b Transactivation assay. EC50 of human T cell cytokine production (IL-2, IFNγ, and TNFα) in the presence of CHO-PD-L1 cells (n = 7); c mixed lymphocyte reaction (MLR) measuring IFNγ production by human donor leukocytes (n = 3 independent donors) stimulated with allogeneic DCs (n = 1) in the presence of 10 µg/ml of test compounds, (error bars are SEM), IFNγ concentrations were significantly greater for MCLA-145 compared to urelumab*, atezolizumab* and Neg. Ctrl Ab (p < 0.001) and significantly less compared to ure* + atezo* (p < 0001) as determined by two-way ANOVA and Holm-Sidak’s multiple comparisons test; d SEB assays. Fold change in IL-2 or IFNγ production by PBMC (left panel, n = 3 independent donors, error bars are mean ± SD) or Whole blood (right panel, n = 7 independent donors, error bars are SEM) respectively after stimulation with SEB in the presence of increasing concentrations of antibodies; e Recall assay measuring fold induction of IFNγ and TNFα production by human CD4+ memory T cells re-stimulated with a viral peptide pool (CEFT) in the presence of 10 µg/ml antibodies, (n = 4 independent donors, error bars are SEM), *p < 0.0001 for IFNγ and p = 0.0012 for TNFα production (Neg. Ctrl Ab vs. MCLA-145) and p = 0.0026 for IFNγ and p = 0.0025 for TNFα production (MCLA-145 vs. ure* + atezo*) as determined by two-way ANOVA and Tukey’s test; f Treg assay measuring fold induction of TNFα and IFNγ production by activated leukocytes in the presence of autologous regulatory T cells (1:1 ratio) and in the presence of 10 µg/ml antibodies (n = 4 independent donors error bars are SD of the mean). *p = 0.0005 for IFNγ and p = 0.012 for TNFα production (Vehicle vs MCLA-145), as determined by one-way ANOVA and Tukey’s test; g PBMC:M2 suppression assay measuring IFNγ production by human leukocytes co-cultured with activated M2-polarized macrophages together with 10 µg/mL antibodies (n = 5 independent donors, error bars are SEM, *p < 0.0001 by one-way ANOVA and Tukey’s test).
Fig. 4
Fig. 4. Ex vivo and in vivo activity of MCLA-145.
a Top panel, donut chart of relative proportion of T cell subsets including percentage of CD3+ cells in single-cell suspensions derived from five human endometrial tumors; Bottom panel, IFNγ levels in supernatant of each tumor explant 6 days after antibody incubation. Error bars: mean ± SD of three replicates, ND = not done, **p < 0.0001 in Tumor #1 and Tumor #5, *p = 0.0018 (Neg. Ctrl Ab vs. MCLA-145) and p = 0.0042 (MCLA-145 vs. atezolizumab*); Tumor #2, **p = 0.0007 (Neg. Ctrl Ab vs. MCLA-145); Tumor #4 *p = 0.0074 (MCLA-145 vs. atezolizumab*), determined by one-way ANOVA and Tukey’s test; b Ly95 T cells expressing an NY-ESO-specific TCR were transferred to NSG mice bearing A549-PD-L1hi tumors and treated with indicated antibodies, end point data are shown, (n = 7 mice); c Stacked histogram, percentage of human CD3+ lymphocytes in total live cell population in blood after RBC lysis (open bar) and tumor (solid colored bar) in each of the treatment groups in (b); d Proportion of NY-ESO-1-specific T cells in tumors per treatment group (b), expressed as a percentage of CD3 + TILs, (n = 7, error bars are SEM), *p < 0.0216 (MCLA-145 vs. Ly95), determined by one-way-ANOVA and Tukey’s test; e Ly95 T cells expressing an NY-ESO-specific TCR were transferred to NSG mice bearing A549-PD-L1hi or A549-PD-L1null tumors and treated with indicated antibodies, end point data are shown. (n = 9 mice), **p < 0.0018 MCLA-145 treatment (A549-PD-L1hi vs A549-PD-L1null groups), determined by one-way-ANOVA and Tukey’s test. f Tumor volume in individual human CD34+ engrafted NSG mice following grafting with MDA-MB-231 cells and treatment with indicated concentrations MCLA-145 or reference antibody (n c= 9 mice per group). Tumor growth and moment of death are indicated for the individual mice per group, a representative experiment of two independent experiments is shown, *p < 0.05, **p < 0.005, ***p < 0.001 of treatment group vs negative control antibody, determined by a two-sided mixed-effects model and Dunnett’s test. g Proportion of CD8+ (upper panel) and CD4+ (middle panel) TILs in tumors from each treatment group, expressed as a percentage of the total population of tumor cells, bottom panel, proportion of PD-L1+ monocytes (bottom panel) in tumors per treatment group, expressed as a percentage of all monocytes (CD11b+ cells), (n = 7 mice per group, error bars are mean ± SD, *p = 0.0492 for CD8+ T cells and p = 0.0014 for PD-L1+ monocytes, determined by one-way ANOVA and Tukey’s test.
Fig. 5
Fig. 5. Safety of MCLA-145 in a repeat dose non-human primate study.
a Schematic showing the design for the repeat dose safety study; b mean serum concentrations of MCLA-145 measured over one cycle (n = 10 animals for vehicle and 100 mg/kg, n = 6 animals for other treatment groups); c mean maximum serum concentration (Cmax) and area under the curve (AUC) at 10 mg/kg (blue), 30 mg/kg (green) and 100 mg/kg (orange) of MCLA-145 measured 24 h after the first dose and 24 h after the fifth dose combined for males and females; n = 10 animals for vehicle and 100 mg/kg, n = 6 animals for other treatment groups, error bars are mean ± SD); d Mean serum concentrations of AST and ALT and e mean number of circulating neutrophils and platelets measured over the study period at the indicated doses (n = 10 animals for vehicle and 100 mg/kg, n = 6 animals for other treatment groups, error bars are SD). Reference mean (male and female bold blue and pink lines respectively) and mean +1 or −1 SD (male and female bold blue and pink lines respectively) as previously reported; f Number of circulating B (CD20+), NK (CD16+) and T cells (CD3+) with CD4+ and CD8+ T cell numbers and proportion of different subpopulations shown for the 100 mg/kg/week dose group or vehicle, mean ± SD of male and female groups combined (n = 10 animals).
Fig. 6
Fig. 6. Colocalization of CD137 and PD-L1 mediates CD137 clustering.
Fold induction of CD3-stimulated Jurkat NFκB-luc-CD137 reporter activity after 24 hours of co-incubation with either a CHO-PD-L1 cells or b human tumor cells endogenously expressing PD-L1 at increasing concentrations of MCLA-145; numbers in brackets indicate PD-L1 binding sites per cell as determined by QIFIKIT analysis; c Schematic illustrating the VeraTag assay to measure CD137 clustering; d CD137-expressing activated Jurkat T cells and PD-L1-expressing CHO cells cocultured with 10 µg/mL test antibody, fixed and measured for CD137 proximity using two different CD137 detection antibodies; e Schematic illustrating the VeraTag assay to measure CD137 and PD-L1 proximity; f Cells cultured and prepared as in (d) to measure PD-L1 and CD137 in proximity, RPA relative peak area; confocal images of CD137 receptor internalization in cocultures of activated CD8+ T cells and CHO-PD-L1+ incubated with (g) MCLA-145, (h) urelumab* or (i) negative control antibody for 15 min, nuclear (DAPI) staining (blue), CD8 (green), CD137 (magenta). Single plane view, magnification ×20 (insets ×63). Data are representative of two repeat experiments for Fig. 6g–i.
Fig. 7
Fig. 7. Schematic of the MCLA-145 mechanism of action.
MCLA-145 is shown binding to PD-L1 expressed on a tumor cell or APC (depicted in pink) and CD137 expressed on a T effector cell (depicted in green). Engagement of MCLA-145 results in clustering of CD137 molecules on the surface of the effector T cell and downstream activation of the NF-kB signaling pathway. In addition, engagement of PD-L1 by MCLA-145 blocks interaction with its receptor PD-1 reversing PD-1 dependent suppression of downstream signaling from the T cell receptor complex. The net effect of MCLA-145 binding in trans to tumor cell/APC and T effector cells is shown: upregulation of CD137 (on T cells) and PD-L1 (on tumor cells and APCs), the release of pro-inflammatory cytokines from effector T cells resulting in T cell differentiation and expansion and activation of effector T cells to promote cytotoxic attack of tumor cells.

References

    1. Couzin-Frankel, J. Cancer immunotherapy. Science 342, 1432–1433 (2013). - PubMed
    1. Akondy, R. S. et al. Origin and differentiation of human memory CD8 T cells after vaccination. Nature 552, 362–367 (2017). - PMC - PubMed
    1. Dunn, G. P., Bruce, A. T., Ikeda, H., Old, L. J. & Schreiber, R. D. Cancer immunoediting: from immunosurveillance to tumor escape. Nat. Immunol. 3, 991–998 (2002). - PubMed
    1. Gajewski TF, Schreiber H, Fu Y-X. Innate and adaptive immune cells in the tumor microenvironment. Nat. Immunol. 2013;14:1014–1022. doi: 10.1038/ni.2703. - DOI - PMC - PubMed
    1. Masopust D, Schenkel JM. The integration of T cell migration, differentiation and function. Nat. Rev. Immunol. 2013;13:309–320. doi: 10.1038/nri3442. - DOI - PubMed

MeSH terms