

Aerosol emission in professional singing of classical music
- PMID: 34290265
- PMCID: PMC8295351
- DOI: 10.1038/s41598-021-93281-x
Aerosol emission in professional singing of classical music
Abstract
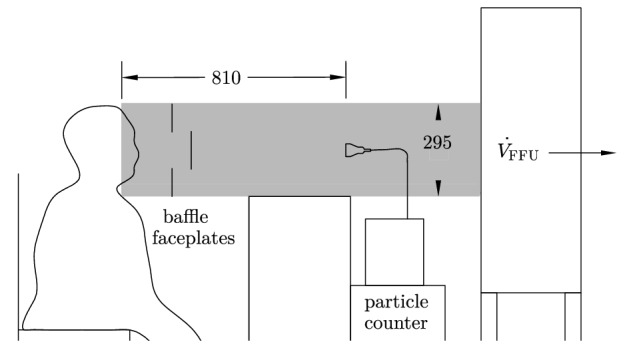
In this study, emission rates of aerosols emitted by professional singers were measured with a laser particle counter under cleanroom conditions. The emission rates during singing varied between 753 and 6093 particles/sec with a median of 1537 particles/sec. Emission rates for singing were compared with data for breathing and speaking. Significantly higher emission rates were found for singing. The emission enhancements between singing and speaking were between 4.0 and 99.5 with a median of 17.4, largely due to higher sound pressure levels when singing. Further, significant effects of vocal loudness were found, whereas there were no significant differences between the investigated voice classifications. The present study supports the efforts to improve the risk management in cases of possible aerogenic virus transmission, especially for choir singing.
© 2021. The Author(s).
Conflict of interest statement
The authors declare no competing interests.
Figures
Similar articles
-
Pre-adolescent children exhibit lower aerosol particle volume emissions than adults for breathing, speaking, singing and shouting.J R Soc Interface. 2022 Feb;19(187):20210833. doi: 10.1098/rsif.2021.0833. Epub 2022 Feb 23. J R Soc Interface. 2022. PMID: 35193389 Free PMC article.
-
Aerosol emission of adolescents voices during speaking, singing and shouting.PLoS One. 2021 Feb 10;16(2):e0246819. doi: 10.1371/journal.pone.0246819. eCollection 2021. PLoS One. 2021. PMID: 33566852 Free PMC article.
-
Associations of Education and Training with Perceived Singing Voice Function Among Professional Singers.J Voice. 2021 May;35(3):500.e17-500.e24. doi: 10.1016/j.jvoice.2019.10.003. Epub 2019 Oct 31. J Voice. 2021. PMID: 31679926
-
Working 9-5: Causal Relationships Between Singers' "Day Jobs" and Their Performance Work, With Implications for Vocal Health.J Voice. 2017 Mar;31(2):243.e27-243.e34. doi: 10.1016/j.jvoice.2016.04.003. Epub 2016 Jun 25. J Voice. 2017. PMID: 27354167 Review.
-
Laryngopharyngeal reflux disease in singers: Pathophysiology, clinical findings and perspectives of a new patient-reported outcome instrument.Eur Ann Otorhinolaryngol Head Neck Dis. 2019 Jun;136(3S):S39-S43. doi: 10.1016/j.anorl.2018.08.008. Epub 2018 Aug 27. Eur Ann Otorhinolaryngol Head Neck Dis. 2019. PMID: 30166226 Review.
Cited by
-
Combining Phi6 as a surrogate virus and computational large-eddy simulations to study airborne transmission of SARS-CoV-2 in a restaurant.Indoor Air. 2022 Nov;32(11):e13165. doi: 10.1111/ina.13165. Indoor Air. 2022. PMID: 36437671 Free PMC article.
-
Airborne virus transmission via respiratory droplets: Effects of droplet evaporation and sedimentation.Curr Opin Colloid Interface Sci. 2021 Oct;55:101471. doi: 10.1016/j.cocis.2021.101471. Epub 2021 May 29. Curr Opin Colloid Interface Sci. 2021. PMID: 34093064 Free PMC article. Review.
-
Superspreading of SARS-CoV-2 at a choir rehearsal in Finland-A computational fluid dynamics view on aerosol transmission and patient interviews.PLoS One. 2024 Sep 12;19(9):e0302250. doi: 10.1371/journal.pone.0302250. eCollection 2024. PLoS One. 2024. PMID: 39264883 Free PMC article.
-
SARS-CoV-2 Aerosol Transmission Indoors: A Closer Look at Viral Load, Infectivity, the Effectiveness of Preventive Measures and a Simple Approach for Practical Recommendations.Int J Environ Res Public Health. 2021 Dec 25;19(1):220. doi: 10.3390/ijerph19010220. Int J Environ Res Public Health. 2021. PMID: 35010484 Free PMC article.
-
Pre-adolescent children exhibit lower aerosol particle volume emissions than adults for breathing, speaking, singing and shouting.J R Soc Interface. 2022 Feb;19(187):20210833. doi: 10.1098/rsif.2021.0833. Epub 2022 Feb 23. J R Soc Interface. 2022. PMID: 35193389 Free PMC article.
References
Publication types
LinkOut - more resources
Full Text Sources
