Comparative Study
. 2021 Jul 21;11(1):14923.
doi: 10.1038/s41598-021-93980-5.

CT-derived 3D-diaphragm motion in emphysema and IPF compared to normal subjects

Affiliations
Comparative Study

CT-derived 3D-diaphragm motion in emphysema and IPF compared to normal subjects

Ji Hee Kang et al. Sci Rep. .

Abstract

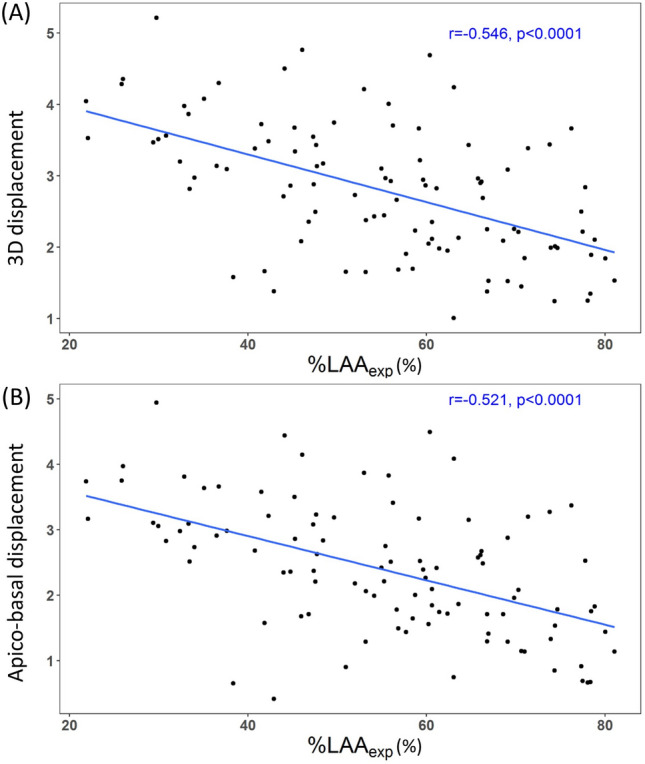
Image registration-based local displacement analysis enables evaluation of respiratory motion between two computed tomography-captured lung volumes. The objective of this study was to compare diaphragm movement among emphysema, idiopathic pulmonary fibrosis (IPF) and normal subjects. 29 normal, 50 emphysema, and 51 IPF subjects were included. A mass preserving image registration technique was used to compute displacement vectors of local lung regions at an acinar scale. Movement of the diaphragm was assumed to be equivalent to movement of the basal lung within 5 mm from the diaphragm. Magnitudes and directions of displacement vectors were compared between the groups. Three-dimensional (3D) and apico-basal displacements were smaller in emphysema than normal subjects (P = 0.003, P = 0.002). Low lung attenuation area on expiration scan showed significant correlations with decreased 3D and apico-basal displacements (r = - 0.546, P < 0.0001; r = - 0.521, P < 0.0001) in emphysema patients. Dorsal-ventral displacement was smaller in IPF than normal subjects (P < 0.0001). The standard deviation of the displacement angle was greater in both emphysema and IPF patients than normal subjects (P < 0.0001). In conclusion, apico-basal movement of the diaphragm is reduced in emphysema while dorsal-ventral movement is reduced in IPF. Image registration technique to multi-volume CT scans provides insight into the pathophysiology of limited diaphragmatic motion in emphysema and IPF.


Conflict of interest statement

The authors declare no competing interests.

Figures

Figure 1
Figure 1
Demonstrative images of the three subject groups from anteroposterior and lateral views. Arrows are displacement vectors of the diaphragm which are color-coded by their magnitude (‘dsStar’ written on the right represents the magnitude of 3D displacement vector). Black spheres represent LAAinsp (area of the lungs in which attenuation is less than -950 Hounsfield units [HU] on inspiration scan). (A,D) Normal. (B,E) Emphysema. The magnitude of 3D and apico-basal displacements is smaller than that of the normal subject. Note the diaphragm flattening on the lateral view. (C,F) IPF. Dorsal–ventral displacement is decreased.
Figure 2
Figure 2
Demonstrative images of the three subject groups viewed from the below. Arrows are displacement vectors of the diaphragm which are color-coded by the displacement angle (‘angl’ written on the right represents the angle of dorsoventral-transverse displacement vector). (A) Normal. (B) Emphysema. The posteromedial portion of the diaphragm shows smaller displacement angle than normal controls. (C) IPF. The anteromedial portion of the diaphragm shows smaller displacement angle than normal controls. Note that heterogeneous displacement angles are demonstrated especially in the posterior portion of the left diaphragm in this patient.
Figure 3
Figure 3
Correlation between %LAAexp and magnitude of displacement vectors in emphysema patients. %LAAexp (%) represents percentage of lung volume on expiration scan with attenuation less than -856 Hounsfield units (HU). (A) Correlation between %LAAexp (%) and 3D displacement of the diaphragm. %LAAexp (%) is negatively correlated with 3D displacement of the diaphragm (r = − 0.546, P < 0.0001). (B) Correlation between %LAAexp (%) and apico-basal displacement of the diaphragm. %LAAexp (%) is negatively correlated with apico-basal displacement of the diaphragm (r = − 0.521, P < 0.0001).
Figure 4
Figure 4
Correlation between pulmonary function test variables and magnitude of displacement vectors in emphysema patients. (A,B) Correlation between forced expiratory volume in 1 s (FEV1 [% of predicted]) and displacement of the diaphragm. (A) FEV1 (% of predicted) is positively correlated with 3D displacement of the diaphragm (r = 0.398, P = 0.005). (B) FEV1 (% of predicted) is positively correlated with apico-basal displacement of the diaphragm (r = 0.44, P = 0.002). (C,D) Correlation between FEV1 / forced vital capacity (FVC) (%) and displacement of the diaphragm. (C) FEV1/FVC (%) is positively correlated with 3D displacement of the diaphragm (r = 0.462, P = 0.001). (D) FEV1/FVC (%) is positively correlated with apico-basal displacement of the diaphragm (r = 0.499, P = 0.0003).
Figure 5
Figure 5
Correlation between pulmonary function test variables and magnitude of displacement vectors in IPF patients. (A,B) Correlation between forced expiratory volume in 1 s (FEV1 [% of predicted]) and displacement of the diaphragm. (A) FEV1 (% of predicted) is positively correlated with 3D displacement of the diaphragm (r = 0.298, P = 0.036). (B) FEV1 (% of predicted) is positively correlated with apico-basal displacement of the diaphragm (r = 0.284, P = 0.046). (C,D) Correlation between forced vital capacity after the administration of bronchodilator (Post-bronchodilator FVC) and displacement of the diaphragm. (C) Post-bronchodilator FVC (% of predicted) is positively correlated with 3D displacement of the diaphragm (r = 0.347, P = 0.028). (D) Post-bronchodilator FVC (% of predicted) is positively correlated with apico-basal displacement of the diaphragm (r = 0.337, P = 0.033).
Figure 6
Figure 6
Definition of dorsoventral-transverse displacement angle. Displacement angle was defined by the angle (θ) between dorsoventral-transverse displacement vectors (xy-plane) and dorsal–ventral axis (y-axis), neglecting apico-basal changes. We defined ventral-dorsal direction as zero degrees and the angle is increasing from the inside to the outside. The figure shows the diaphragm viewed from below. Multiple arrows are displacement vectors. The color of the arrows represents displacement angles (θ, Displayed in the color-bar on the right side of the figure).
Figure 7
Figure 7
Quadrants of the modeled conducting airways. Quadrants are color-coded by the four divisions of the diaphragms. We defined the center points of the diaphragm on xy-plane by the center points between the maximum and minimum x coordinates and maximum and minimum y coordinates.
Figure 8
Figure 8
Diaphragm thickness measurement. A line was drawn through the anterior border of the spinal canal at T11 to L1 vertebral body level on the axial image (upper). Software automatically displayed intersection points of the line and diaphragm on the coronal image (lower). Diaphragm thickness was measured at the corresponding points two times on each side of the diaphragm and the mean value was obtained.

References

    1. Kocjan J, Adamek M, Gzik-Zroska B, Czyzewski D, Rydel M. Network of breathing. Multifunctional role of the diaphragm: A review. Adv. Respir. Med. 2017;85:224–232. doi: 10.5603/ARM.2017.0037. - DOI - PubMed
    1. Santana PV, Prina E, Albuquerque ALP, Carvalho CRR, Caruso P. Identifying decreased diaphragmatic mobility and diaphragm thickening in interstitial lung disease: The utility of ultrasound imaging. J. Bras. Pneumol. 2016;42:88–94. doi: 10.1590/S1806-37562015000000266. - DOI - PMC - PubMed
    1. Iwasawa T, et al. Magnetic resonance analysis of abnormal diaphragmatic motion in patients with emphysema. Eur. Respir. J. 2002;19:225–231. doi: 10.1183/09031936.02.00044602. - DOI - PubMed
    1. Davachi B, et al. The relationship between diaphragmatic movements in sonographic assessment and disease severity in patients with stable chronic obstructive pulmonary disease (COPD) J. Cardio-Thoracic Med. 2014;2:187–192.
    1. Ünal Ö, Arslan H, Uzun K, Özbay B, Sakarya ME. Evaluation of diaphragmatic movement with MR fluoroscopy in chronic obstructive pulmonary disease. Clin. imaging. 2000;24:347–350. doi: 10.1016/S0899-7071(00)00245-X. - DOI - PubMed

Publication types