. 2021 Jul 21;4(1):896.
doi: 10.1038/s42003-021-02408-3.

Structure-function analysis of purified proanthocyanidins reveals a role for polymer size in suppressing inflammatory responses

Affiliations

Structure-function analysis of purified proanthocyanidins reveals a role for polymer size in suppressing inflammatory responses

Audrey Inge Schytz Andersen-Civil et al. Commun Biol. .

Abstract

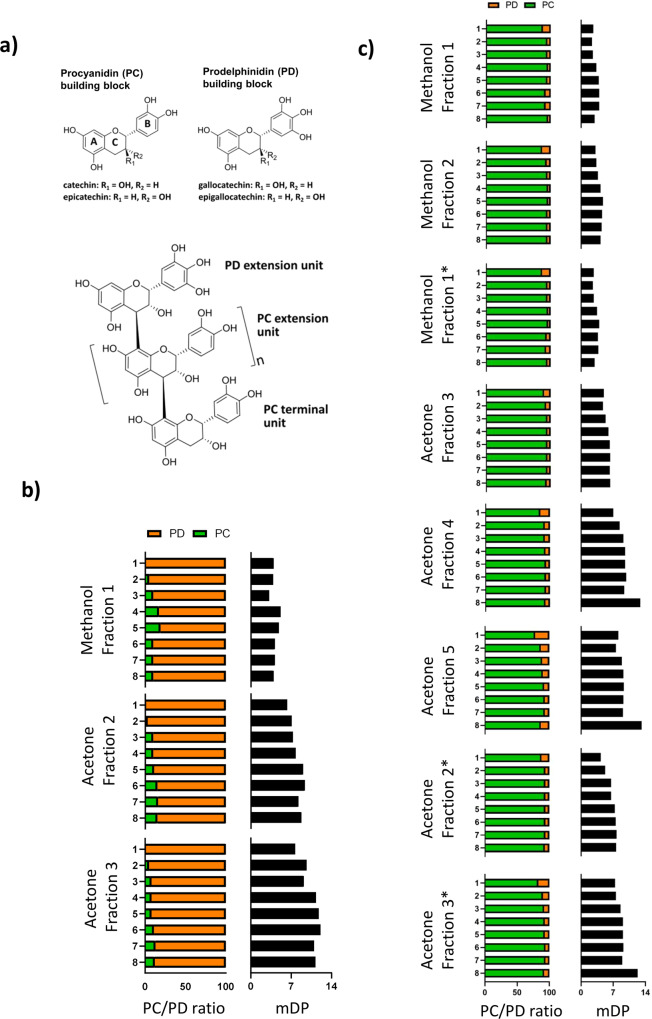
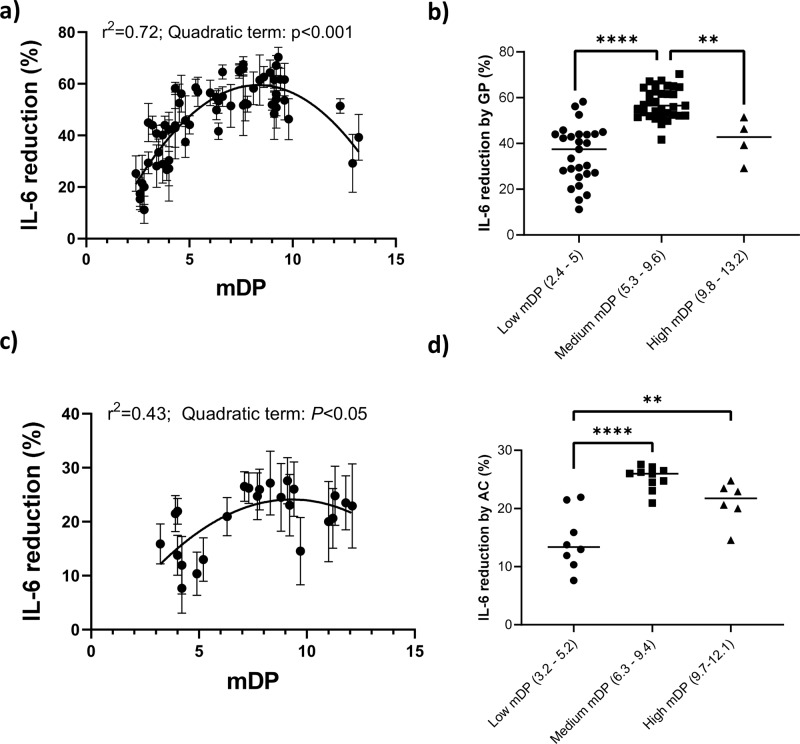
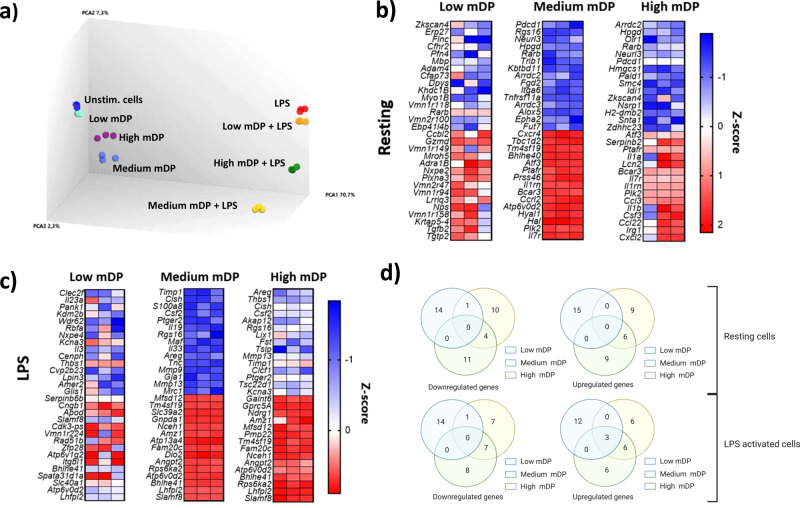
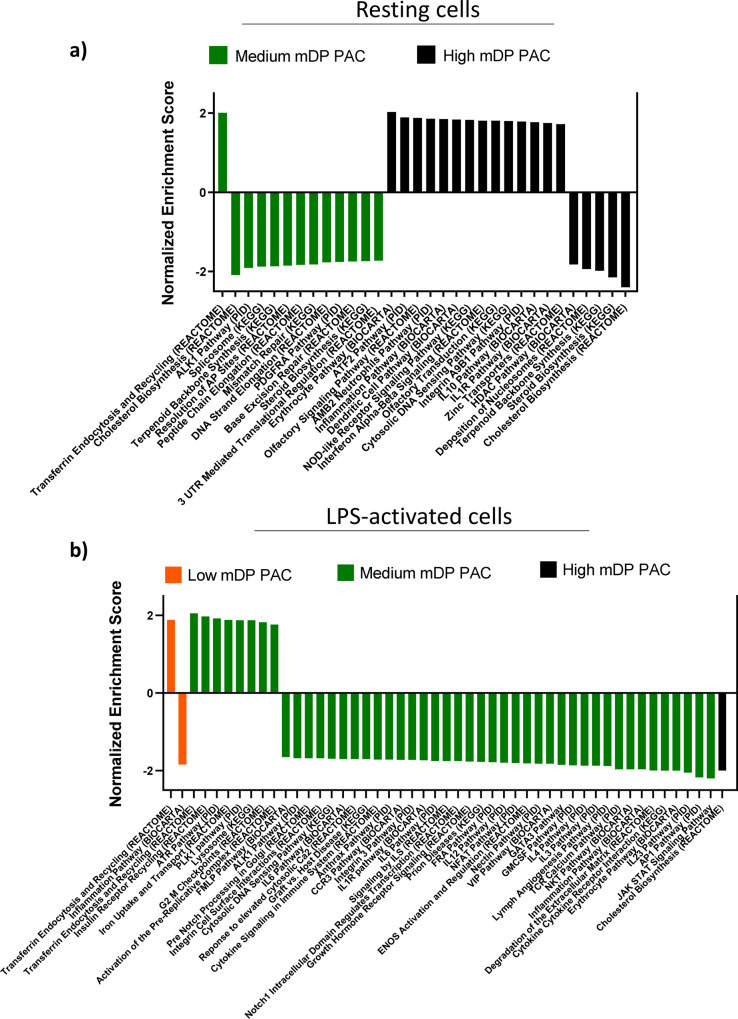
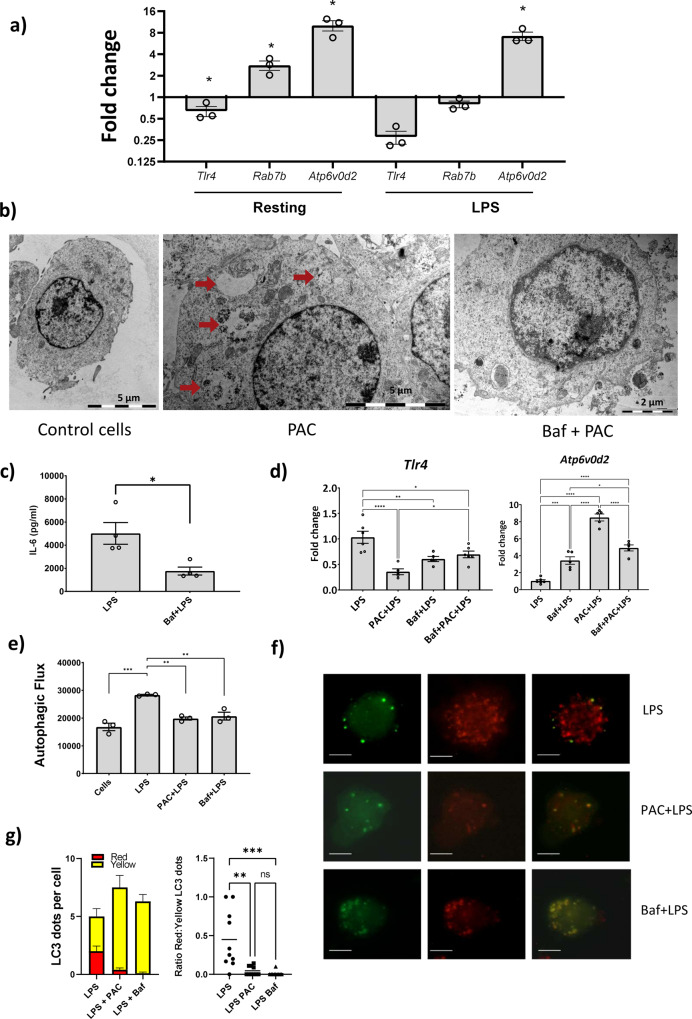
Proanthocyanidins (PAC) are dietary compounds that have been extensively studied for beneficial health effects due to their anti-inflammatory properties. However, the structure-function relationships of PAC and their mode-of-action remain obscure. Here, we isolated a wide range of diverse PAC polymer mixtures of high purity from plant material. Polymer size was a key factor in determining the ability of PAC to regulate inflammatory cytokine responses in murine macrophages. PAC polymers with a medium (9.1) mean degree of polymerization (mDP) induced substantial transcriptomic changes, whereas PAC with either low (2.6) or high (12.3) mDP were significantly less active. Short-term oral treatment of mice with PAC modulated gene pathways connected to nutrient metabolism and inflammation in ileal tissue in a polymerization-dependent manner. Mechanistically, the bioactive PAC polymers modulated autophagic flux and inhibited lipopolysaccharide-induced autophagy in macrophages. Collectively, our results highlight the importance of defined structural features in the health-promoting effects of PAC-rich foods.


Conflict of interest statement

The authors declare no competing interests.

Figures

Fig. 1
Fig. 1. Molecular characteristics of proanthocyanidins.
a The structures of (epi)catechin and (epi)gallocatechin, which give basis to the most common proanthocyanidin (PAC) structural units, procyanidin (PC) and prodelphinidin (PD) units are displayed as single building blocks. The figure also depicts a model structure of an oligomeric PAC consisting of PD and PC extension units and a PC terminal unit (n = number of PC or PD extension units). PAC samples used in this study showed varying chemical characteristics, with samples extracted from b alpine currant (Ribes alpinum) being rich in prodelphinidins (PD), whereas samples extracted from c grape (Vitis vinifera) pomace were rich in procyanidins (PD). Samples were purified and extracted by Sephadex LH-20 fractionation with methanol followed by acetone. Further purification was conducted by semi-preparative liquid chromatography, resulting in eight highly purified samples for each of the Sephadex fractions. Each sample was analyzed by UPLC-MS/MS samples produced from grape pomace were prepared in two batches, thus fractions labeled with “*” represent the second batch of samples. mDP mean degree of polymerization.
Fig. 2
Fig. 2. Suppression of IL-6 secretion in lipopolysaccharide-activated macrophages by proanthocyanidins is influenced by polymerization.
a Proanthocyanidins (PAC) derived from grape pomace (GP) reduced IL-6 secretion in lipopolysaccharide (LPS)-activated macrophages, with the relationship between mDP and IL-6 reduction best described by a quadratic function (quadratic regression with curve-fitting analysis). Each data point represents mean and SEM of at least three independent experiments. b IL-6 reduction in GP PAC samples stratified into low, medium, and high mDP. c PAC derived from alpine currant (AC) reduced IL-6 secretion in lipopolysaccharide (LPS)-activated macrophages, with the relationship between mDP and IL-6 reduction best described by a quadratic function (quadratic regression with curve-fitting analysis). Each data point represents mean and SEM of at least three independent experiments. d IL-6 reduction in AC PAC samples stratified into low, medium, and high mDP. *p < 0.05, **p < 0.01, ***p < 0.001 by one-way ANOVA. All samples were tested at 15 µg/mL.
Fig. 3
Fig. 3. Proanthocyanidins regulate macrophage gene expression in a polymerization-dependent manner.
a Principal component analysis plot showing a clear effect of lipopolysaccharide (LPS) and proanthocyanidins (PAC). Medium mDP PAC was the most differentiated treatment from respective controls with and without LPS. The most prominent transcriptional changes were observed in cells exposed to PAC with an mDP of 9.1, whereas PAC with a higher or lower mDP were generally less effective at modulating the cellular responses. b Top 15 up- and down-regulated genes by PAC in resting cells (no LPS treatment). c Top 15 up- and down-regulated genes by PAC in LPS-activated cells. d The top 15 genes regulated by each PAC samples in resting or LPS-activated RAW 264.7 macrophages were investigated. Out of a total of 69 regulated genes, 25% were regulated by at least two of the PAC samples with differing mDPs in LPS-activated RAW 264.7 macrophages. Experiments were conducted with triplicate samples.
Fig. 4
Fig. 4. Regulation of gene pathways in RAW 264.7 macrophages stimulated with proanthocyanidins with differing degrees of polymerization.
a Gene pathways regulated by medium mDP (9.1) and high mDP (12.3) grape pomace proanthocyanidins (PAC) in resting RAW 264.7 macrophages. b Gene pathways regulated by low mDP (2.6), medium mDP (9.1), and high mDP (12.3) grape pomace PAC in lipopolysaccharide-activated RAW 264.7 macrophages. Experiments were conducted with triplicate samples. Shown are significantly regulated pathways (p value <0.001; q value <0.15) identified by gene-set enrichment analysis.
Fig. 5
Fig. 5. Regulation of gene expression in mouse ileum tissue by proanthocyanidins.
a Significantly regulated genes (fold change >2; q value >0.8 by NOIseq analysis) obtained from RNA sequencing of mouse ileum tissue in mice dosed with low mDP proanthocyanidins (PAC) or medium mDP PAC. Fold changes are relative to mice dosed with only water. n = 5 mice per treatment group. b Principal component analysis showed an effect of PAC mDP demarcated in two distinct clusters. n = 5 mice per treatment group. c Gene pathways identified in the KEGG database that were downregulated (p value <0.005; q value <0.1) by treatment with medium mDP PAC, identified by gene-set enrichment analysis.
Fig. 6
Fig. 6. Proanthocyanidins regulate gene expression, autophagosome formation, and autophagy in RAW264.7 cells.
a Expression of Tlr4, Rab7b, and Atp6v0d2 in RAW264.7 macrophages exposed to proanthocyanidins (PAC) in either resting conditions or following lipopolysaccharide (LPS) stimulation. Fold changes are relative to cells exposed to medium only (resting cells) or LPS only (LPS-activated cells). Mean and SEM of three independent experiments (*p < 0.05 by paired t-test). b Transmission electron microscopy (TEM) images of macrophages showing formation of autophagosome-like structures in control cells or in cells incubated with PAC (15 µg/mL), or PAC combined with Bafilomycin A1 (Baf; 10 nM). c LPS-activated cells showed a significant decrease in IL-6 secretion when pre-stimulated with Baf (10 nM). Mean and SEM from at least three independent experiments (*p < 0.05 by Mann–Whitney test). d Expression of Tlr4 and Atp6v0d2 in RAW264.7 cells stimulated with LPS with PAC (15 µg/mL) and/or Baf (10 nM). Mean and SEM from at least three independent experiments (*p < 0.05, **p < 0.01, ***p < 0.001, ****p < 0.0001 by one-way ANOVA and Tukey’s tests). e Autophagic flux in RAW 264.7 macrophages treated with LPS alone, or LPS combined with either PAC (15 µg/mL) or Baf (10 nM). Mean and SEM of three independent experiments (*p < 0.05, **p < 0.01, ***p < 0.001 by one-way ANOVA and Tukey’s tests). f PAC and Baf both reduce the formation of autophagolysosomes in LPS-activated mLC3 cells. LPS-activated cells had marked abundance of red punctate spots, indicating increased autophagolysosome formation. In contrast, punctate spots and co-localization of green and red fluorescence was observed in LPS-activated cells co-stimulated with either PAC or Baf indicating an accumulation of autophagosomes and inhibition of the full autophagy pathway. Scale bar = 5 µm. g The abundance of red dots, i.e. autophagolysosomes, and yellow dots, i.e. autophagosomes, and the ratio between them, were enumerated in ten individual mLC3 cells (*p < 0.05, **p < 0.01, ***p < 0.001 by Kruskal–Wallis and Dunn’s tests). Shown is mean and SEM for abundance and median for ratio.

References

    1. Milani RV, Lavie CJ. Health care 2020: reengineering health care delivery to combat chronic disease. Am. J. Med. 2015;128:337–343. doi: 10.1016/j.amjmed.2014.10.047. - DOI - PubMed
    1. Anderson E, Durstine JL. Physical activity, exercise, and chronic diseases: a brief review. Sports Med. Health Sci. 2019;1:3–10. doi: 10.1016/j.smhs.2019.08.006. - DOI - PMC - PubMed
    1. Mathers, J. & Wolever, T. M. Introduction to Human Nutrition (Wiley-Blackwell, 2009).
    1. Pandey KB, Rizvi SI. Plant polyphenols as dietary antioxidants in human health and disease. Oxid. Med. Cell. Longev. 2009;2:270–278. doi: 10.4161/oxim.2.5.9498. - DOI - PMC - PubMed
    1. Zhang H, Tsao R. Dietary polyphenols, oxidative stress and antioxidant and anti-inflammatory effects. Curr. Opin. Food Sci. 2016;8:33–42. doi: 10.1016/j.cofs.2016.02.002. - DOI

Publication types