. 2021 Aug;596(7870):119-125.
doi: 10.1038/s41586-021-03704-y. Epub 2021 Jul 21.

Phenotype, specificity and avidity of antitumour CD8+ T cells in melanoma

Affiliations

Phenotype, specificity and avidity of antitumour CD8+ T cells in melanoma

Giacomo Oliveira et al. Nature. 2021 Aug.

Abstract

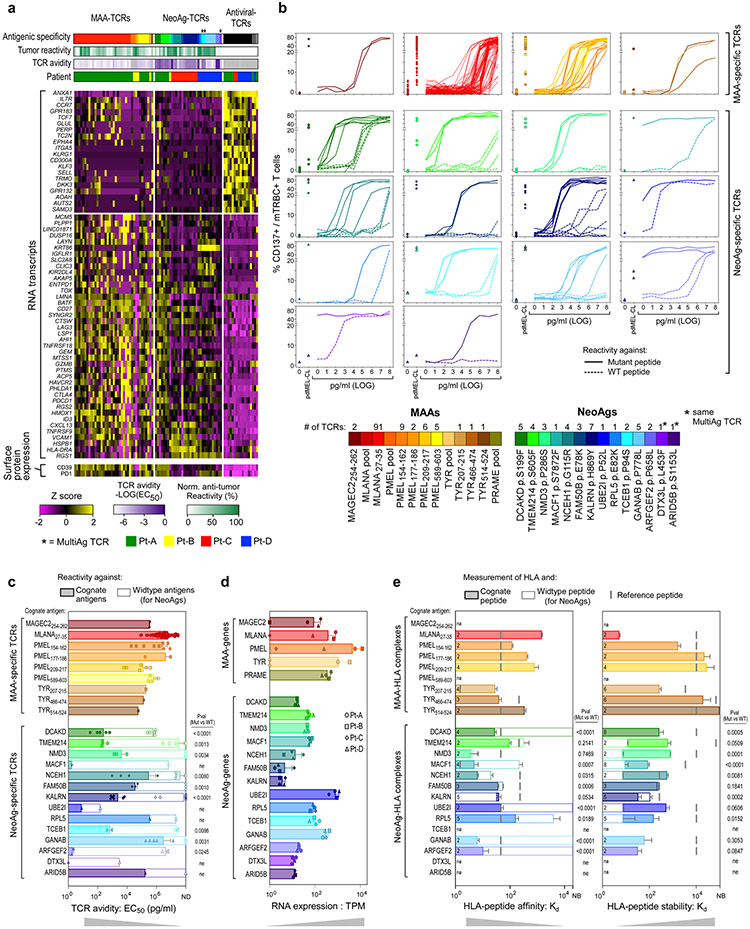
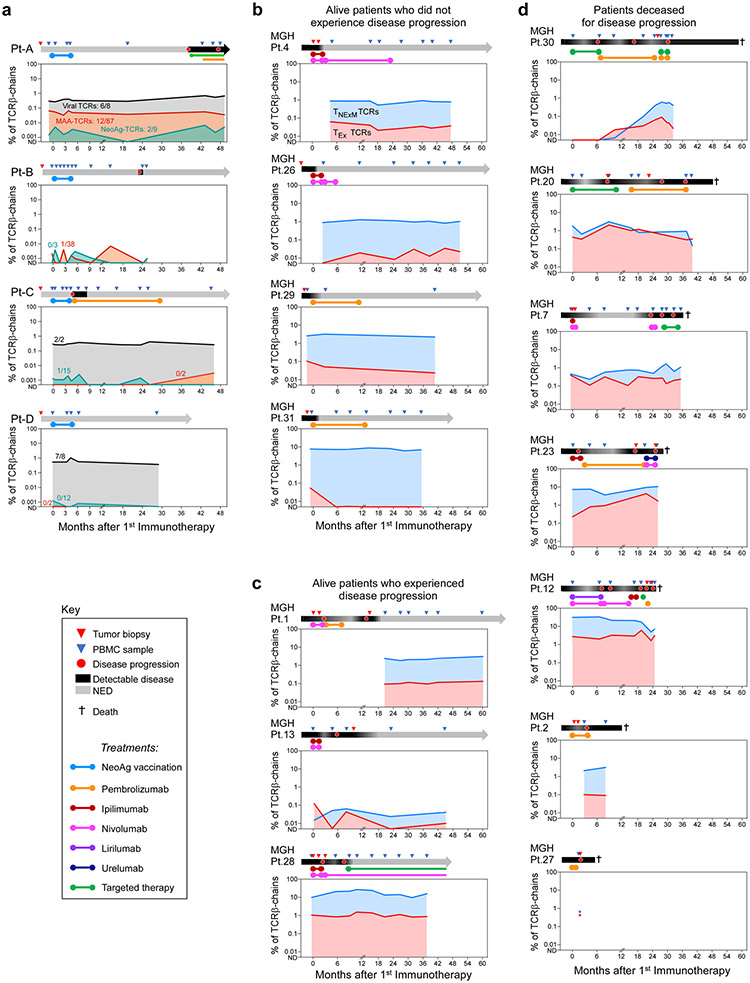
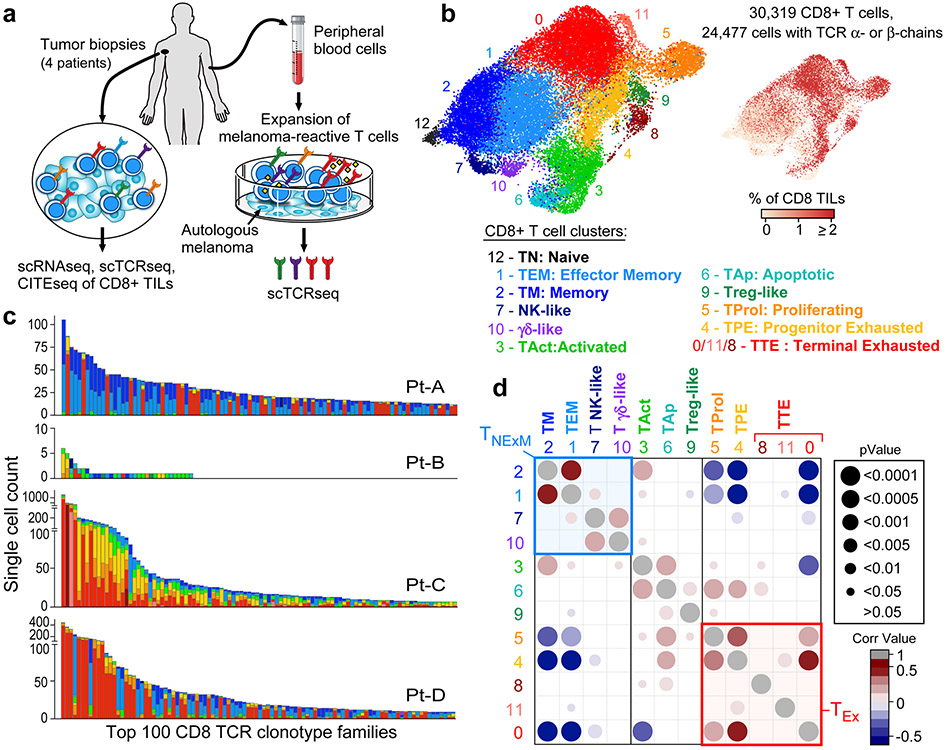
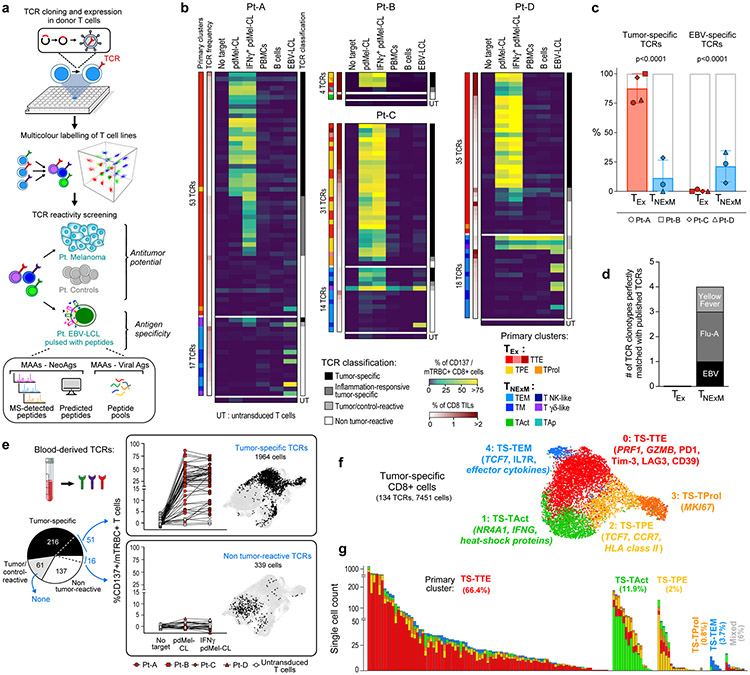
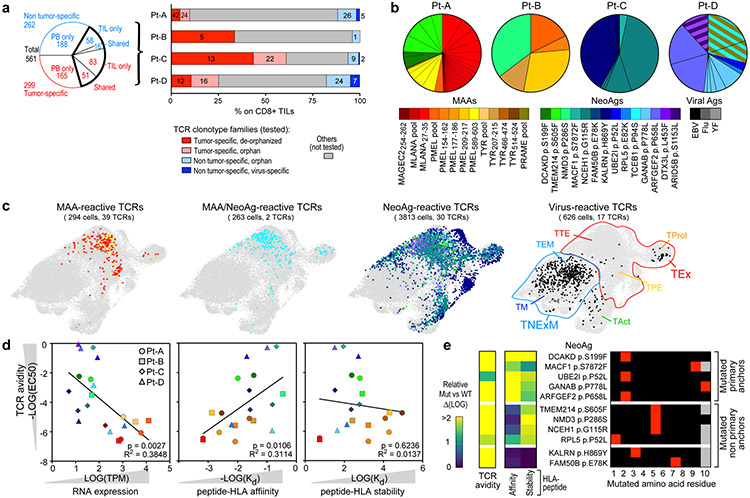
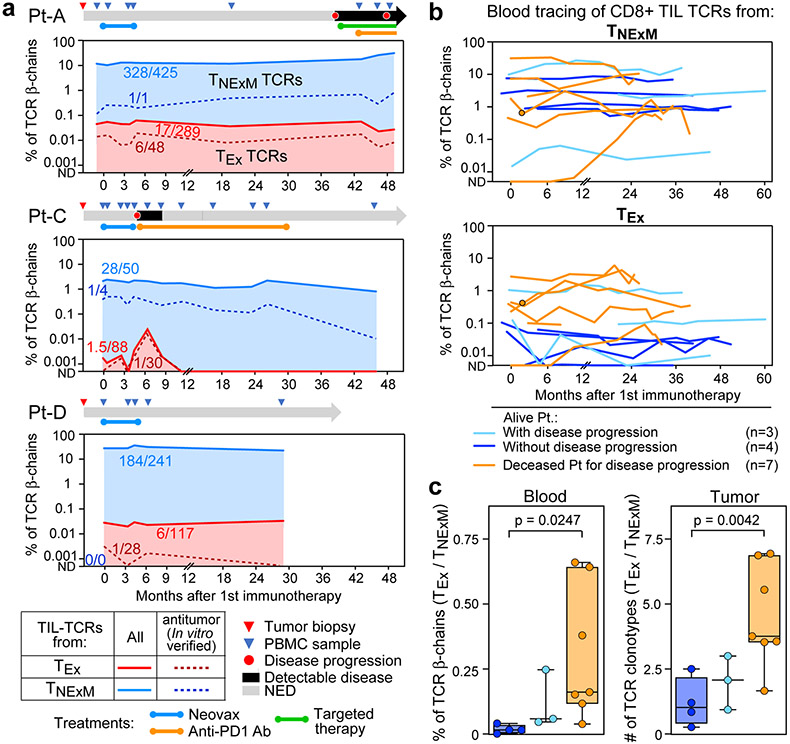
Interactions between T cell receptors (TCRs) and their cognate tumour antigens are central to antitumour immune responses1-3; however, the relationship between phenotypic characteristics and TCR properties is not well elucidated. Here we show, by linking the antigenic specificity of TCRs and the cellular phenotype of melanoma-infiltrating lymphocytes at single-cell resolution, that tumour specificity shapes the expression state of intratumoural CD8+ T cells. Non-tumour-reactive T cells were enriched for viral specificities and exhibited a non-exhausted memory phenotype, whereas melanoma-reactive lymphocytes predominantly displayed an exhausted state that encompassed diverse levels of differentiation but rarely acquired memory properties. These exhausted phenotypes were observed both among clonotypes specific for public overexpressed melanoma antigens (shared across different tumours) or personal neoantigens (specific for each tumour). The recognition of such tumour antigens was provided by TCRs with avidities inversely related to the abundance of cognate targets in melanoma cells and proportional to the binding affinity of peptide-human leukocyte antigen (HLA) complexes. The persistence of TCR clonotypes in peripheral blood was negatively affected by the level of intratumoural exhaustion, and increased in patients with a poor response to immune checkpoint blockade, consistent with chronic stimulation mediated by residual tumour antigens. By revealing how the quality and quantity of tumour antigens drive the features of T cell responses within the tumour microenvironment, we gain insights into the properties of the anti-melanoma TCR repertoire.


Figures

Extended Data Figure 1.
Extended Data Figure 1.. Clinical course of melanoma patients analyzed for single-cell sequencing and TCR specificity
Schematic representation of the clinical histories of the 4 melanoma patients profiled in this study. Triangles - time of collection of tumor biopsies (red) analyzed with single-cell sequencing or of peripheral blood samples (blue) used for isolation of tumor-reactive T cells at serial timepoints (TP). NED, no evidence of disease.
Extended Data Figure 2.
Extended Data Figure 2.. Single-cell profiling of CD8 + tumor infiltrating lymphocytes
a. Flow-cytometry plots quantifying the proportion of T lymphocytes (defined as CD45+ CD3+) infiltrating 5 tumor biopsies subjected to single-cell sequencing. Tissue origin for each tumor sample is indicated. b. Density plots identifying CD8+ TILs through CITEseq antibody signals for CD4+ (orange) and CD8+ (blue). Data are reported as CD4 and CD8 CITEseq signals relative to isotype controls for all sequenced cells that were identified as T cells after flow sorting and computational filtering. c. Size and patient distribution of the 13 clusters identified from CD8+ TIL scRNAseq. Left: per cluster, sample origin is denoted by color. The analyzed CD8+ dataset is predominantly composed by cells from 3 patients (Pt-A (green), Pt-C (red) and Pt-D (blue)). Two clusters were found to be patient-specific (clusters 8 and 11). Right: UMAPs depicting cluster distribution of patient-specific CD8+ TILs. d. Heatmaps depicting the mean cluster expression of a panel of T-cell related genes, measured by scRNAseq (left panel) and the mean surface expression of the corresponding proteins measured through CITEseq (right panel). Clusters (columns) are labelled using the annotation provided in Fig. 1b; markers (rows) are grouped based on their biological function. Grey - unevaluable markers (CD45 isoforms for scRNASeq) or which were not assessed (for CITESeq). CITESeq CD3 surface expression was poorly detected because of the presence of competing CD3 sorting antibody. e. Violin plots quantifying relative transcriptional expression of genes (columns) with high differential expression among CD8+ TIL clusters (rows). f. UMAPs depicting the single-cell expression of representative T cell markers among CD8+ TILs either through detection of surface protein expression with CITEseq (Ab), or through scRNAseq (RNA). g. Characterization of the CD8+ TIL clusters using independent reference gene-signatures-. Heatmaps show cross-labelling of T cell clusters defined in the present study (columns, reported as in Fig. 1b) versus reference gene-signatures (rows) derived from the analyses in Sade-Feldman et al., Yost et al. and Oh et al., with intensities indicating normalized frequency.
Extended Data Figure 3.
Extended Data Figure 3.. Clonality of CD8+ TILs and cell states of TCR clonotypes
a. Histograms depicting the number (bottom panel) and overall frequency (top panel) of patients’ TCR clonotype families divided in categories based on their size (x axis). b. Histograms showing the intra-cluster TCR clonality, calculated for CD8+ T cells in each cluster (x axis) using normalized Shannon index. Symbols - individual TCR clonality for the 3 patients with high numbers of TILs (Pt-A, Pt-C, Pt-D). Bars - the overall TCR clonality measured within each cluster. c. UMAPs of the cluster distribution of representative dominant TCR clonotype families among CD8+ TILs from TIL-rich patients (n=3). For each patient, numbers denote the ranking of each TCR clonotype (see Fig. 1c), while colors identify their primary cluster (see Fig. 1b).
Extended Data Figure 4.
Extended Data Figure 4.. Characterization of patient-derived melanoma cell lines
a. Purity of tumor cultures, originating from patient biopsies, was assessed by flow-cytometry by staining cells with isotype controls (top panels) or surface markers (bottom panels) identifying melanoma (using melanoma chondroitin sulfate proteoglycan [MCSP], y axis) or fibroblast lineages (fibroblast antigen, x axis). Consistent with previous reports, MCSP was expressed in 3 of 4 tumor cultures, with each lacking substantive fibroblast contamination. b. Flow-cytometric assessment of HLA class I surface expression on the established melanoma cell lines. Surface expression was measured with a pan-HLA class I antibody (top panels) or with an HLA-A:02-specific antibody (bottom panels) at basal culture conditions (magenta) or upon exposure to IFNγ for 72 hours (purple), compared to isotype control (grey). c. Comparison of the mutation burden of patient-derived melanoma cell lines vs. corresponding parental tumors. For all patients, mutation calling from WES of tumor biopsies and cell lines was performed through comparison with autologous PBMCs serving as germline controls. Venn diagrams - the numbers and frequencies of mutations unique to parental tumors (red) or melanoma cell lines (blue) or shared between the two (black). Corresponding dot plots, using the same color code, show the variant allele frequencies (VAF) of mutations detected in the parental tumors (x axis) and derived cell lines (y axis). For both, tumor purity inferred from single-cell data (parental tumors) or detected by flow-cytometry (cell lines) is indicated. The high concordance between the genomic mutations detected in paired specimens demonstrates that the melanoma cell lines are reflective of the corresponding parental tumors. d. Gene expression profiles of HLA class I genes and MAA genes in patient-derived cell lines (columns, black) or in matched parental tumors (columns, white), compared to control tumor-derived fibroblast cell lines (n=3) originating from unrelated melanoma biopsies (right columns). Tumor purity is reported in red. Gene expression was measured by RNA-seq and normalized as logarithmic transcripts per million base pairs (TPM). e. HLA class I immunopeptidome of patient-derived melanoma cell lines cultured with or without IFNγ. Bars - numbers of unique peptides detected by mass spectrometry (MS) after immunoprecipitation of peptide-HLA class I complexes (bottom panel), and of unique genes from which the detected peptides were derived (top panel), and grouped based on their origin from MAAs or NeoAgs and colored by patient. The number of MS acquisitions for each condition is indicated.
Extended Data Figure 5.
Extended Data Figure 5.. Antitumor reactivity of in vitro reconstructed TCRs
a. Schema for classification of TCR reactivities based on CD137 upregulation of TCR transduced T cell lines upon challenge with patient-derived melanoma cells (Mel, with or without IFNγ pre-treatment [red]) or controls (PBMCs, B cells and EBV-LCLs [blue]). A TCR was defined as tumor-specific if it recognized only the autologous melanoma cell line, but did not upregulate CD137 when challenged with autologous controls. b. Representative flow-cytometry plots depicting CD137 upregulation measured on CD8+ T cells transduced with TCRs isolated from Pt-A and cultured with melanoma or control targets. Background reactivity was estimated by measuring CD137 upregulation on CD8+ T cells transduced with an irrelevant TCR. c. Cytotoxic potential provided by TCRs with exhausted (left) or non-exhausted (right) primary clusters isolated from all 4 studied patients. Degranulation (CD107a/b+) and concomitant production of cytokines (IFNγ, TNFα and IL-2) were assessed through intracellular staining, gating on TCR-transduced (mTRBC+) CD8+ T cells cultured alone or in the presence of autologous melanoma. Each dot represents the result for a single TCR isolated from CD8+ TILs, color-coded based to its primary phenotypic cluster (as defined in Fig. 1b). For each analyzed TCR, background cytotoxicity from CD8+ T cells transduced with an irrelevant TCR was subtracted. White dots - basal level of activation of untransduced cells. Overall, these data indicate that antitumor cytotoxicity mainly resides among TCR clonotypes with exhausted primary clusters.
Extended Data Figure 6.
Extended Data Figure 6.. Isolation, single-cell sequencing and screening of tumor-reactive TCRs from peripheral blood samples.
a-b. PBMCs harvested at serial timepoints (TP1, TP1, TP3; see Extended Data Fig. 1) were cultured with autologous melanoma cell lines to enrich for antitumor TCRs. After two rounds of stimulation, the reactivity of effector CD8+ T cells was assessed by measuring: (a) degranulation and cytokine production; or (b) CD137 upregulation upon re-challenge with melanoma (blue line). The specificity of the response was supported by the low recognition of HLA-mismatched unrelated melanoma (dashed grey line). Negative controls (cultured in the absence of target cells) and positive controls (polyclonal stimulators, PHA or PMA-ionomycin) are displayed as solid grey and black lines, respectively. c. FACS sorting strategy for the isolation of tumor-reactive T cells. CD8+ effectors with active degranulation and concomitant cytokine production were identified using cytokine secretion assays (see Supplementary Methods) upon stimulation without any target (top panel) or in the presence of autologous melanoma (bottom panels). CD107a/b+ cells secreting at least one of the measured cytokines (IFNγ, TNFα and IL-2) were single-cell sorted and sequenced. Gates depict the detection and quantification of reactive (black) or sorted cells (magenta) from a representative sample (TP3 PBMCs from Pt-A). d. TCR clonotypes identified upon single-cell sorting and scTCRseq of melanoma-reactive CD8+ T cells from the 4 studied patients. Bars - cell counts of clonotype families, defined as CD8+ cells bearing identical TCRα and TCRβ chains, divided based on their detection at specific timepoints (TP1, TP2, TP3) or across multiple timepoints (shared). Presence of multiple TCRα or TCRβ chains is indicated with black or orange borders, respectively. e-h. TCRs isolated and sequenced from anti-melanoma cultures were reconstructed, expressed in CD8+ T cells and screened against melanoma (Mel, with or without IFNγ pre-treatment in red) or controls (PBMCs, B cells and EBV-LCLs in blue). TCRs were classified as reported in Extended Data Fig. 5a, to identify: (e) tumor-specific TCRs, (f) non-tumor reactive TCRs, and (g) tumor/control reactive TCRs. Reactivity was calculated by subtracting from CD137 expression of CD8+ cells transduced with the reconstructed TCR the background of lymphocytes transduced with an irrelevant TCR. Floating boxes show min to max measurements, with mean values depicted as horizontal lines; white dots denote the basal level of activation measured on untransduced cells. Pie charts in h summarize the classification of TCR reactivity for all reconstructed TCRs. i. Cytotoxicity mediated by TCRs classified as tumor-specific (left panel), non-tumor reactive (middle panel) or tumor/control reactive (right panel). Degranulation (CD107a/b+) and concomitant production of cytokines (IFNγ, TNFα and IL-2) were measured through intracellular flow-cytometry on TCR transduced (mTRBC+) CD8+ T cells cultured alone or in the presence of autologous melanoma. Each dot represents the results of a single TCR isolated from CD8+ TILs (upon subtraction of background activation measured on CD8+ lymphocytes transduced with an irrelevant TCR). White dots denote the basal level of cytotoxicity of untransduced cells. j. Bar plots showing intratumoral cluster distribution of cells bearing tumor-specific (left) or non-tumor reactive (right) TCRs isolated from blood and traced within the tumor microenvironment (see Fig. 2e). For each patient, numbers denote the ranking of each TCR among top 100 clonotype families (see Fig. 1c), while colors identify their primary cluster (see Fig. 1b).
Extended Data Figure 7.
Extended Data Figure 7.. Cell states of tumor-specific CD8+ TILs
a-c. Antigen specificity screening of 94 TCRs sequenced from clonally expanded CD8+ T cells isolated from tumor biopsies of 7 patients with metastatic melanoma from Sade-Feldman et al. a. After TCR reconstruction and expression in T cells, reactivity was measured as CD137 upregulation on TCR-transduced (mTRBC+) CD8+ cells upon culture with autologous EBV-LCLs pulsed with peptide pools covering immunogenic viral epitopes (CEF). Unstimulated cells were analyzed as negative control. Results are reported after subtraction of background CD137 expression on T cells transduced with an irrelevant TCR. Five TCRs (black dots) recognized unpulsed EBV-LCLs, thereby documenting specificity for EBV epitopes. b. TCR antitumor reactivity, evaluated upon culture with autologous EBV-LCLs pulsed with peptide pools derived from 12 known MAAs. Background detected upon culture with DMSO-pulsed EBV-LCLs was subtracted. Additional positive and negative controls were an irrelevant peptide (Ova) and polyclonal stimulators (PHA or PMA/ionomycin), respectively. Colored dots denote MAA-reactive TCRs. c. Table summarizing patient distribution of TCR specificities either discovered from reconstruction and screening of 94 TCRs or present within a database of human TCRs with known specificities (TCRdb). d-e-f. Single-cell phenotype of TILs with antiviral or anti-MAA TCRs identified in the validation cohort from Sade-Feldman et al. d. t-SNE plot of CD8+ TILs highlighting the spatial distribution of cells harboring TCRs with identified antigen specificity. Each color denotes a distinct specificity, with crosses representing two cells with identical spatial coordinates. e. Pie charts summarizing the assignment of single cells harboring antiviral (top) or anti-MAA (bottom) TCRs to one of the previously reported 6 clusters. f. RNA transcripts differentially expressed between antiviral and anti-MAA cells (log2FC>1.5, adj. p value<0.05). The heatmap reports Z scores, calculated from average gene expression of each TCR clonotype family (columns). Antigen specificity is reported on top with the same color-code as in d. g-h. Analysis of deregulated genes in exhausted clusters (TEx), enriched in tumor-reactive T cells, from the discovery cohort. g. Average gene expression, reported as Z scores, for each TCR clonotype family (columns) validated in vitro as tumor-specific (orange, 134 TCRs) or defined as virus-specific (black, 17 TCRs). The heatmap reports 98 RNA transcripts (adjPval<0.0001, log2FC>1) and 6 surface proteins (bottom rows, adjPval<0.0001, log2FC>0.4) detected trough scRNAseq and CITEseq respectively. h. Plots depicting expression of representative RNA-transcripts (top) or surface proteins (bottom) in each TCR clonotype family with antiviral (black) or antitumor (orange) specificity. Dots depict the average gene-expression in each TCR clonotype, with size proportional to the frequency of the TCR clonotype within patient-specific CD8+ TILs. i. Heatmap depicting the top 20 overexpressed genes in each TS-cluster of tumor-specific (TS) CD8+ cells (columns). Z scores of gene expression among 5 subpopulations are shown. Genes important for the classification of each subset are highlighted in blue. j. Heatmaps depicting expression of a panel of T cell related transcripts detected through scRNAseq (left) or surface proteins detected through CITEseq (right). Z scores document the trends in expression among subpopulations of TS CD8+ cells (columns). k. Enrichment in expression of gene-signatures among identified clusters of TS CD8+ cells (columns). Single cells with tumor-specific TCRs were divided in clusters as reported in Fig. 2f, and scored for the expression of gene-signatures defined from analysis of CD8 TILs of the discovery cohort (left), reported in external datasets of sequenced human CD8+ TILs (middle), or defined from published murine studies (right) (see Methods and Supplementary Table 8). Average enrichment score was calculated for each cluster and reported as Z score.
Extended Data Figure 8.
Extended Data Figure 8.. Antigen specificity of tumor-reactive TCRs.
a. Antitumor TCRs isolated from HLA-A*02:01+ patients (Pt-A, Pt-B and Pt-D) were tested for the ability to cross-recognize allogeneic HLA-A*02:01+ melanomas. Melanoma reactivity was measured as CD137 upregulation on TCR-transduced (mTRBC+) CD8+ cells upon culture with autologous or allogeneic HLA-A*02:01-matched melanomas. Tumor specificity was ruled out through parallel detection of CD137 upregulation upon challenge with matched non-tumor controls (PBMCs). Floating boxes show min to max measurements, with mean values denoted by horizontal lines. All results are shown after subtraction of background CD137 expression on T cells transduced with an irrelevant TCR; white dots denote the basal level of activation of untransduced CD8+ T cells. Pt-A and Pt-B displayed high melanoma-specific (i.e. lack of recognition of autologous PBMCs) cross-reactivity indicating that a substantial proportion of antitumor TCRs recognize public HLA-A*02:01-restricted melanoma antigens. b-c. Antigen specificity screening of 299 antitumor TCRs. Upregulation of CD137 was assessed by flow-cytometry on CD8+ T cells transduced with previously identified tumor-specific TCRs upon culture with autologous EBV-LCLs. Background, assessed using DMSO-pulsed target cells, was subtracted from each condition. b. Antigen recognition tested with pools of peptides corresponding to predicted immunogenic NeoAgs (see Supplementary Table 9), known MAAs (see Supplementary Table 10) or immunogenic viral epitopes. Reactivity was also assessed against an irrelevant peptide (Ova) or in the presence of polyclonal stimulators (PHA or PMA/ionomycin) as negative and positive controls, respectively. Black dots - activation levels of a control Flu-specific HLA-A*02:01-restricted TCR. Colored dots – confirmed antigen-reactive TCRs, colored based on highest reactivity against a particular antigens, as per the legend, compared to the other tested antigens; white dots –TCRs reactive against an antigen which was not the highest of the panel of antigens tested, and hence considered a cross-reactive response; grey dots - negative responses. Deconvolution of antigen specificity of TCRs reactive to NeoAg-peptide pools is reported in Supplementary Information – Flow-cytometry data. c. Antigen specificity tested using NeoAg or MAA-peptides detected by HLA-class I mass spectrometry (MS) immunopeptidome of melanoma cell lines (see Supplementary Table 9-10) with the addition of the MLANA protein (not retrieved by MS but known as highly immunogenic). Colored dots -confirmed antigen-reactive TCRs, colored based on highest reactivity against a particular antigens (color legend reported in d), compared to the other tested antigens; white dots –TCRs reactive against an antigen which was not the highest of the panel of antigens tested, and hence considered a cross-reactive response; d. Distribution of antigen specificities of antitumor TCRs per patient successfully deorphanized after screening. Colors denote the distinct peptides recognized by individual antitumor TCRs. Note that TCRs classified as specific for antigenic pools (n=11) represent CD8-restricted specificities showing reactivity against peptide pools (b), but not towards single peptides (c), likely due to the absence of the specific cognate antigen within the tested panels of epitopes in c.
Extended Data Figure 9.
Extended Data Figure 9.. Phenotype of MAA/NeoAg-TCRs and parameters affecting their avidity.
a. Heatmap showing genes differentially expressed between CD8+ TILs with identified MAA, NeoAg or virus-specific TCRs. Comparisons were performed independently for each patient, and only significantly deregulated genes (adj-pval<0.05, log2FC>1 for scRNAseq data; log2FC>0.4 for CITEseq data) in at least 2 out of 4 patients were selected. No deregulated gene was found upon comparison of single-cells with MAA or NeoAg-TCRs; 60 RNA transcripts and 2 surface proteins resulted from comparison of MAA and/or NeoAg cells vs viral cells. Heatmap colors depict Z scores of average gene expression within a TCR clonotype (columns). Top tracks: annotations of antigen specificity (color legend reported in panel b), normalized antitumor TCR reactivity, TCR avidity and patient of origin. b. To define the avidity of antitumor TCRs, TCR-dependent CD137 upregulation was measured on TCR-transduced (mTRBC+) CD8+ cells upon culture with patient-derived EBV-LCLs pulsed with increasing concentrations of the cognate antigen (MAAs in the top panel, NeoAgs in bottom panels). Reactivity to DMSO-pulsed targets (0) and autologous melanoma (pdMel-CL) are reported on the right; for NeoAg-specific TCRs, the dashed lines report reactivity against wildtype peptides. A color legend depicts the different cognate antigens targeted by the deorphanized TCRs and specifies the number of TCRs specific for each antigenic specificity. c. EC50 calculated from titration curves: note that high EC50 values correspond to low TCR avidities. Means with SD are reported, with TCR numbers corresponding to that reported in the legend of b. Most of the NeoAg-specific TCRs display higher avidities than MAA-specific TCRs. d. Expression levels of MAA or NeoAg transcripts (from bulk RNA-seq data) from which the analyzed epitopes are generated, as a measure of cognate peptide abundance in tumor cells, as analyzed from 4 patient-derived cell lines (symbols). Columns show means values with SD. e. Assessment of the affinity (left) and stability (right) of peptide:HLA complexes. The interactions between reported MAA or NeoAg peptides and their HLA restriction (assessed in vitro as shown in Supplementary Information – Flow-cytometry data) were measured as previously described. Note that high values correspond to low affinity (left), or to stable interactions (right). Columns report mean affinity/stability with standard deviations from repeated measurements; numbers of replicates is indicated at columns’ bases. Horizontal grey lines - affinity levels of reference peptides reported to be strong binders for the analyzed HLA alleles that were tested in parallel. In all NeoAg panels, comparisons of mutant (Mut, colored bars) vs. wildtype (WT, white bars) peptides were performed using two-tailed ratio-paired parametric t-tests, and p values are reported. ND: not detectable; NB: non-binding; na: not assessed; ne: not evaluable.
Extended Data Figure 10.
Extended Data Figure 10.. Peripheral blood dynamics of intratumoral T cell specificities.
a. Peripheral blood dynamics of T cells harboring TCRs with in vitro defined antigen specificity (Black: virus-specific TCRs; red: MAA-specific TCRs; green: NeoAg-specific TCRs). TCRs were quantified through bulk sequencing of TCRβ-chains of sorted CD3+ T cells from serial peripheral blood sampling of the 4 melanoma patients within the discovery cohort. Numbers report the median number of TCRs detected longitudinally out of the total number of TCRs within each category. b-d. CD8+ TCR clonotypes identified in CD8+ TILs were traced within serial peripheral blood samples harvested from an independent cohort of melanoma patients (n=14) treated with immune checkpoint blockade therapies and with available scRNASeq data generated from TILs. TCRs were classified as exhausted (red) or non-exhausted (blue) based on their phenotypic primary cluster assessed by scRNAseq. Quantification of circulating TCR clonotypes was performed through bulk sequencing of TCRβ chains on circulating CD3+ cells and reported as percentage of total TCR sequences detected. Patient clinical outcomes were grouped as: survivors who did not experienced post-therapy disease recurrence (panel b, n=4); survivors who experienced disease progression after immunotherapy (panel c, n=3); and deceased patients (panel d, n=7). Per patient, a schematic representation of clinical timeline and sample collection is depicted atop each panel. “ND”: not detected; “NED”: no evidence of disease.
Fig. 1 ∣
Fig. 1 ∣. Distinct cell states among CD8+ TCR clonotype families in melanoma.
a, Schema of sample collection, processing and single-cell sequencing analysis of melanoma and peripheral blood samples. b, UMAP of scRNA-seq data from CD8+ melanoma TILs. Clusters are denoted by colours and labelled with inferred cell states. The same UMAP (right) shows TILs marked on the basis of intrapatient TCR clone frequency defined through scTCR-seq. c, Cluster distribution of the top 100 CD8+ TCR clonotype families from melanoma A–D. The colours denote cell states, as delineated in b. d, Two-sided Spearman correlation of normalized cluster distribution of dominant TCR clonotype families comprising five or more cells. The colours and the area of the circles indicate the strength and significance of the correlation, respectively.
Fig. 2 ∣
Fig. 2 ∣. Target specificity and phenotype of tumour-specific CD8+ TCRs.
a, Schematic of the workflow for in vitro TCR reconstruction and specificity screening. Multiple TCRs are cloned and expressed in healthy donor T cells (top). Pools of colour-labelled effectors expressing individual TCRs are tested for reactivity against autologous melanoma, controls or EBV-LCLs (middle and bottom) that could be pulsed with peptides from NeoAgs, MAAs or viral antigens selected from mass spectrometry (MS) detection of HLA class I tumour immunopeptidomes, from computational prediction or from commercially available peptide pools. b, Reactivity of dominant TCRs sequenced among TEx (top) or TNExM (bottom) clusters in melanoma A–D. CD137 upregulation was measured on TCR-transduced (mTRBC+) CD8+ T cells cultured alone (no target) or in the presence of autologous melanoma cells (pdMel-CLs; with or without interferon-γ (IFNγ) pre-treatment) or controls (peripheral blood mononuclear cells (PBMCs), B cells and EBV-LCLs). Background detected on CD8+ T cells transduced with an irrelevant TCR was subtracted. Left track, TCR phenotype (primary cluster) and frequency among CD8+ TILs from patients; right track, classification of TCR reactivities (Extended Data Fig. 5a). UT, untransduced cells. c, Proportion of TCRs classified as tumour-specific (left) or EBV-specific (right) among TEx-TCRs (red; n = 123) or TNExM-TCRs (blue; n = 49) in melanoma A–D. Mean ± s.d. are shown. P values were calculated using two-tailed Fisher’s exact test on the total distribution of tested TCRs. d, Number of TCRs from TEx or TNExM clusters perfectly sequence matched with viral TCRs from TCRdb. Flu-A, influenza-A specific TCR. e, Spectrum of reactivities and phenotypes of TCRs isolated from blood, traced within the tumour microenvironment. Left, classification of TCRs isolated from the blood of patients with melanoma A–D and screened in vitro. Per boxed panels, antitumour reactivity of TCRs traced within TILs (filled symbols), measured as CD137 upregulation, compared with nonspecific activation of untransduced cells (open symbols) (left). UMAP distribution of cells bearing TCRs of interest (right). f, Cell states of tumour-specific (TS) CD8+ TILs, bearing any of the 134 TCRs with in vitro-verified antitumour specificity. g, Cluster distribution of tumour-specific TCRs, grouped on the basis of their primary cluster, and coloured on the basis of the tumour-specific clusters represented in f.
Fig. 3 ∣
Fig. 3 ∣. Antigenic specificity and avidity of tumour-specific TCRs.
a, Summary of evaluated TCRs, classified on the basis of tumour specificity and compartment of detection (blood or tumour). The bar plot shows intrapatient distribution of tested TCR clonotypes among CD8+ TILs. Tested TCRs are colour-coded based on tumour specificity and whether reactivity to cognate antigen was detected. The numbers of TCRs corresponding to each category are reported. PB, peripheral blood. b, Summary of the deorphanized antigen specificity of tumour-specific TIL-TCRs, showing the frequency (slice size) and cognate antigen (colours) for each TCR clonotype. The colour legend also applies to c and d. c, UMAPs of the phenotypic distribution of T cells bearing antitumour TCRs specific for MAAs and/or NeoAgs or TCRs specific for viral peptides. d, Parameters affecting the avidity (y axis) of antitumour TCRs, including RNA expression of TCR-targeted genes detected in the autologous pdMel-CLs (left), the affinity of peptide–HLA complexes (middle) and the stability of peptide–HLA complexes (right). The values for the avidity of TCRs, and the affinity and stability of peptide–HLA complexes represent averages of data presented in Extended Data Fig. 9. The significance of each linear regression is reported within each panel. The symbols refer to patients from whom TCRs were identified. Measurements for peptide–HLA affinity and stability are for 7 of 9 MAAs and 11 of 14 NeoAgs. EC50, half-maximal effective concentration; Kd, dissociation constant; TPM, transcripts per million mapped reads. e, The effect of the position of the mutated residue within NeoAg peptides on the avidities of TCRs and the affinities and stabilities of peptide–HLA complexes. Parameters are reported as the fold change of the mutant (Mut) relative to the corresponding wild-type (WT) peptides.
Fig. 4 ∣
Fig. 4 ∣. Peripheral blood dynamics of CD8+ TIL-TCRs.
a, Systemic dynamics of T cells bearing intratumoural CD8+ with exhausted (light red) or non-exhausted memory (light blue) clusters. The levels of circulating TCRs with in vitro- verified antitumour reactivity are shown with dark dashed lines. TCRs were quantified through bulk TCRβ chain sequencing of CD3+ T cells isolated from serial peripheral blood sampling of the three patients with high numbers of TIL-TCRs. The numbers within the graphs are the median number of TCRs detected longitudinally out of the total number of TCRs within each category. Per patient, a schematic of clinical history and sample collection is depicted. Anti-PD1 Ab, anti-programmed cell death protein 1 antibody; ND, not detectable; NED, no evidence of disease. b, Circulating counts of T cells with TCRs detected among CD8+ TILs classified as non-exhausted (top) or exhausted (bottom). Samples were collected from 14 patients with melanoma who experienced long-term remission (blue; n = 7) or poor clinical outcome (orange; n = 7) after immunotherapy treatment. Patients with good clinical outcome were further divided into those who did (n = 4) or did not experience (n = 3) disease progression following treatment. Single dots show values for patients with a single time point available. c, Ratio of exhausted versus non-exhausted TCR families for the validation cohort reported in b. The box plots depict the median ratio of blood frequencies measured through bulk TCR-seq (left) or of clonotype counts detected within TILs in published single-cell sequencing data (right) of TCRs with an TEx versus TNExM intratumoural phenotype. The whiskers show the minimum to maximum values, the horizontal bars are the medians and the boxes depict the 25–75th percentiles. For the P values, significant comparisons were calculated with two-tailed Welch’s t-test.

Comment in

References

    1. van der Leun AM, Thommen DS & Schumacher TN CD8+ T cell states in human cancer: insights from single-cell analysis. Nat Rev Cancer 20, 218–232 (2020). - PMC - PubMed
    1. Scheper W et al. Low and variable tumor reactivity of the intratumoral TCR repertoire in human cancers. Nat. Med 25, 89–94 (2019). - PubMed
    1. Simoni Y et al. Bystander CD8+ T cells are abundant and phenotypically distinct in human tumour infiltrates. Nature 557, 575–579 (2018). - PubMed
    1. Ott PA et al. An immunogenic personal neoantigen vaccine for patients with melanoma. Nature 547, 217–221 (2017). - PMC - PubMed
    1. Sarkizova S et al. A large peptidome dataset improves HLA class I epitope prediction across most of the human population. Nat. Biotechnol 38, 199–209 (2020). - PMC - PubMed

Methods references

    1. Stuart T et al. Comprehensive Integration of Single-Cell Data. Cell 177, 1888–1902.e21 (2019). - PMC - PubMed
    1. Korsunsky I et al. Fast, sensitive and accurate integration of single-cell data with Harmony. Nat Methods 16, 1289–1296 (2019). - PMC - PubMed
    1. Cohen CJ, Zhao Y, Zheng Z, Rosenberg SA & Morgan RA Enhanced antitumor activity of murine-human hybrid T-cell receptor (TCR) in human lymphocytes is associated with improved pairing and TCR/CD3 stability. Cancer Res. 66, 8878–8886 (2006). - PMC - PubMed
    1. Haga-Friedman A, Horovitz-Fried M & Cohen CJ Incorporation of transmembrane hydrophobic mutations in the TCR enhance its surface expression and T cell functional avidity. J Immunol 188, 5538–5546 (2012). - PubMed
    1. Bialer G, Horovitz-Fried M, Ya’acobi S, Morgan RA & Cohen CJ Selected murine residues endow human TCR with enhanced tumor recognition. J Immunol 184, 6232–6241 (2010). - PubMed

Publication types

Substances