. 2021 Aug;596(7873):570-575.
doi: 10.1038/s41586-021-03762-2. Epub 2021 Jul 21.

Tonic prime-boost of STING signalling mediates Niemann-Pick disease type C

Affiliations

Tonic prime-boost of STING signalling mediates Niemann-Pick disease type C

Ting-Ting Chu et al. Nature. 2021 Aug.

Abstract

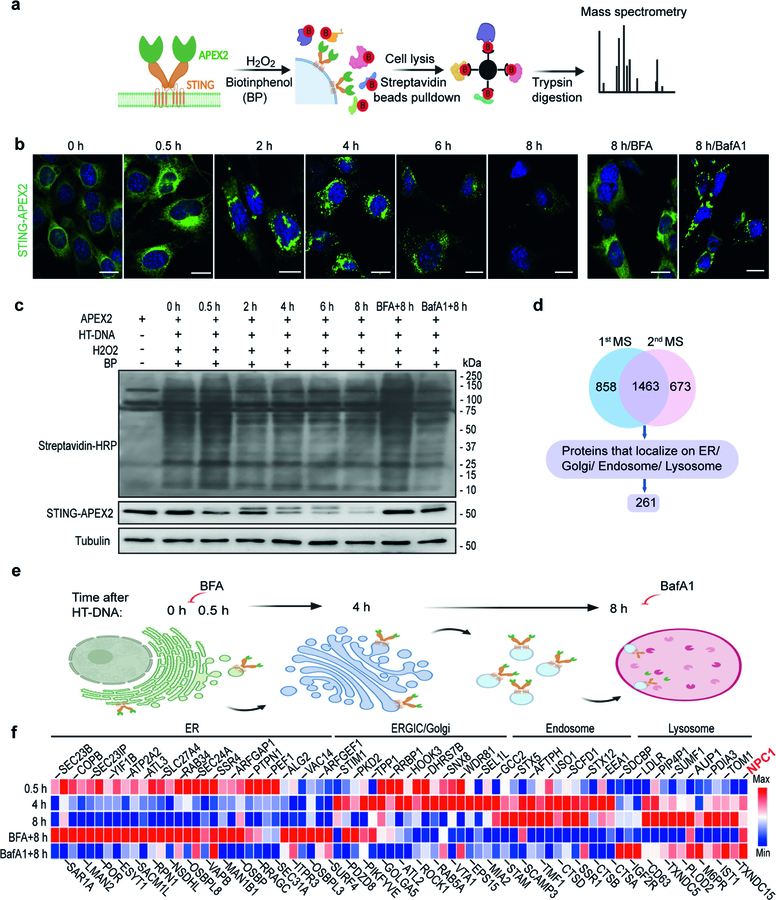
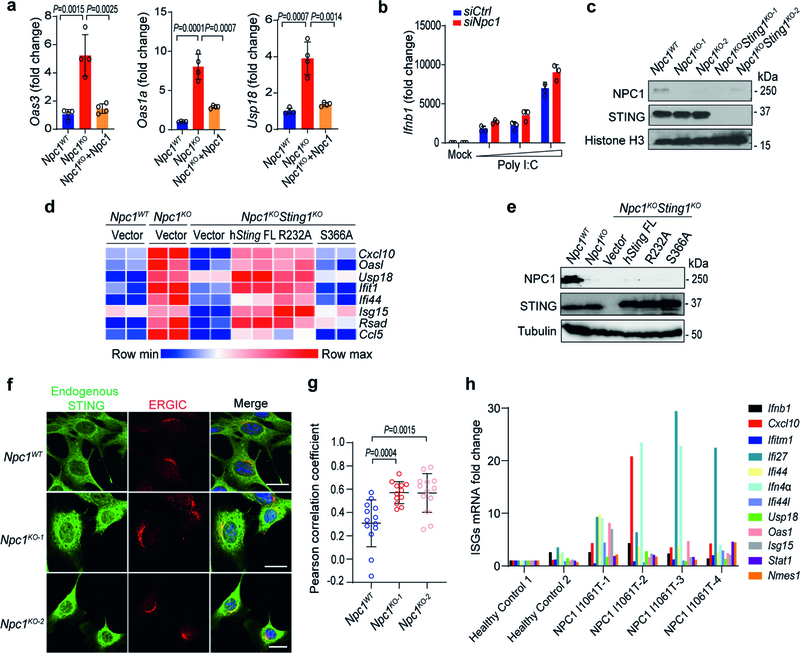
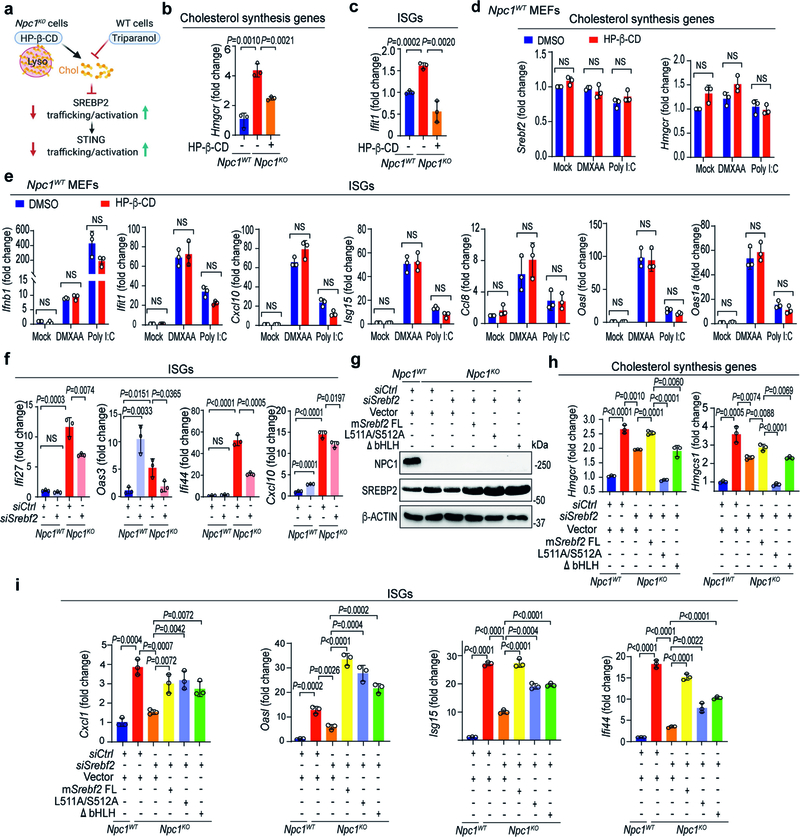
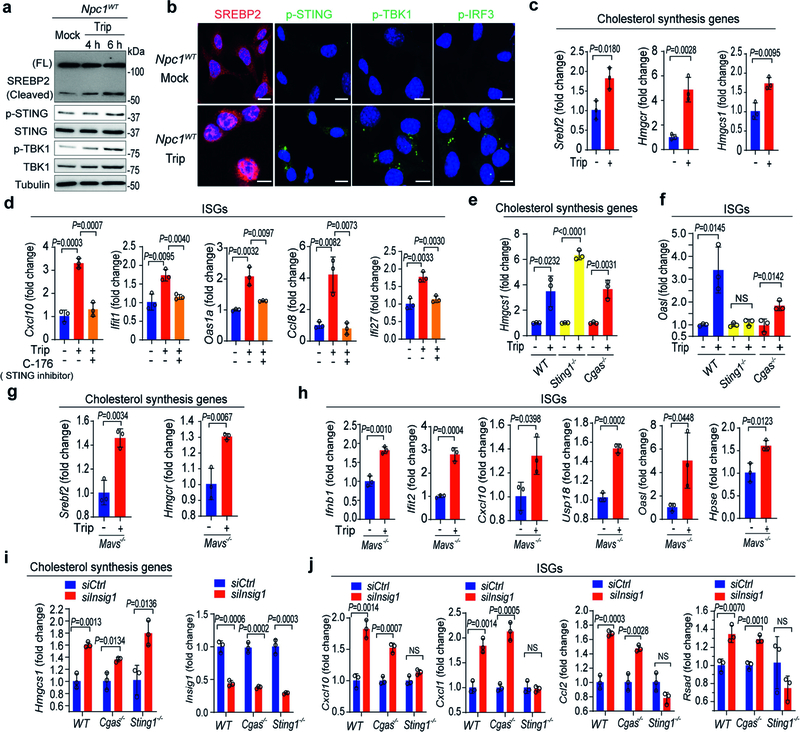
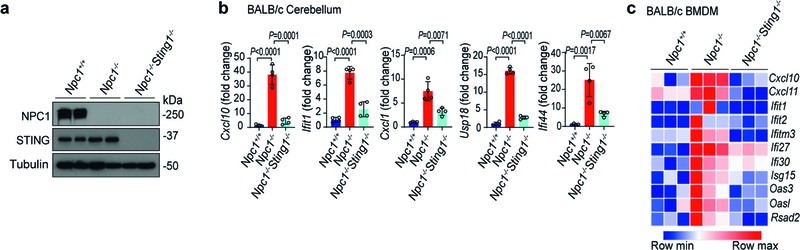
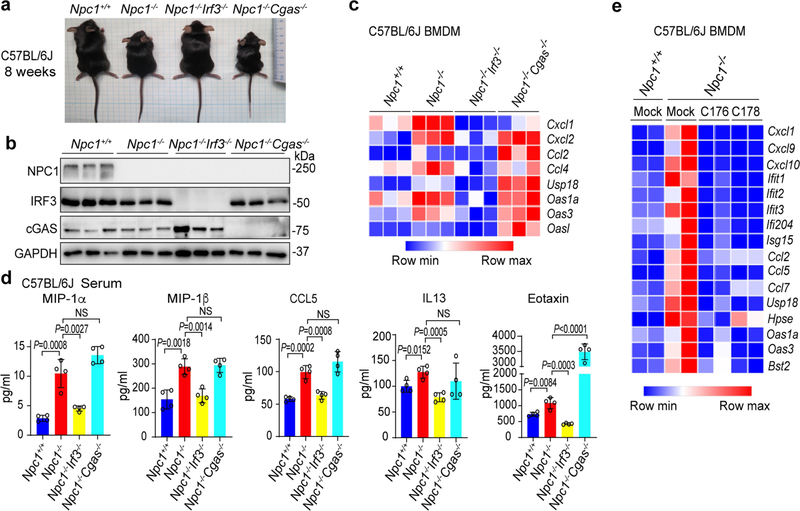
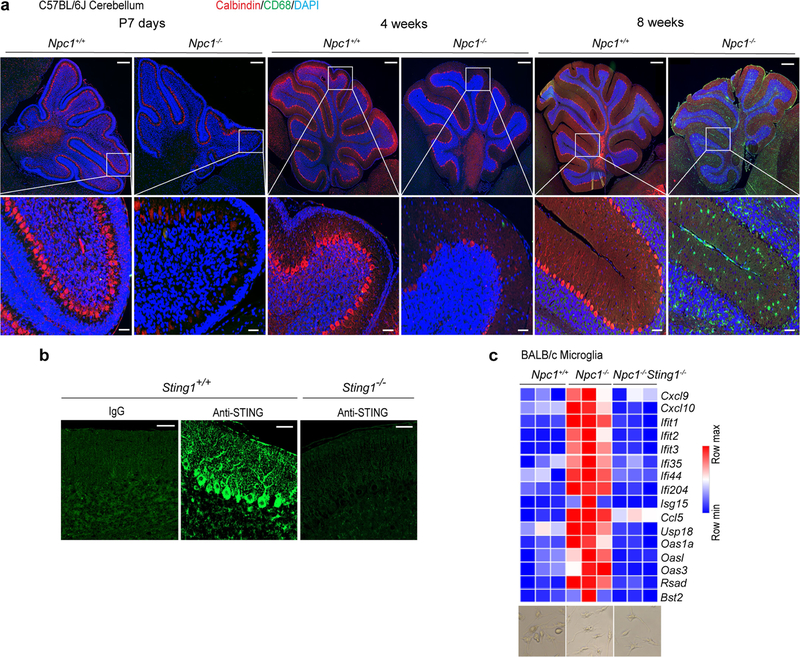
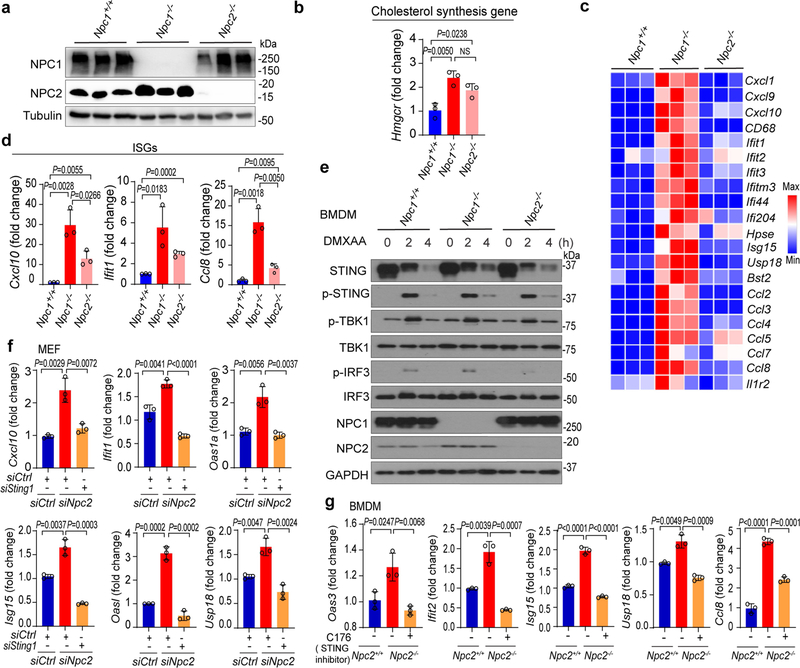
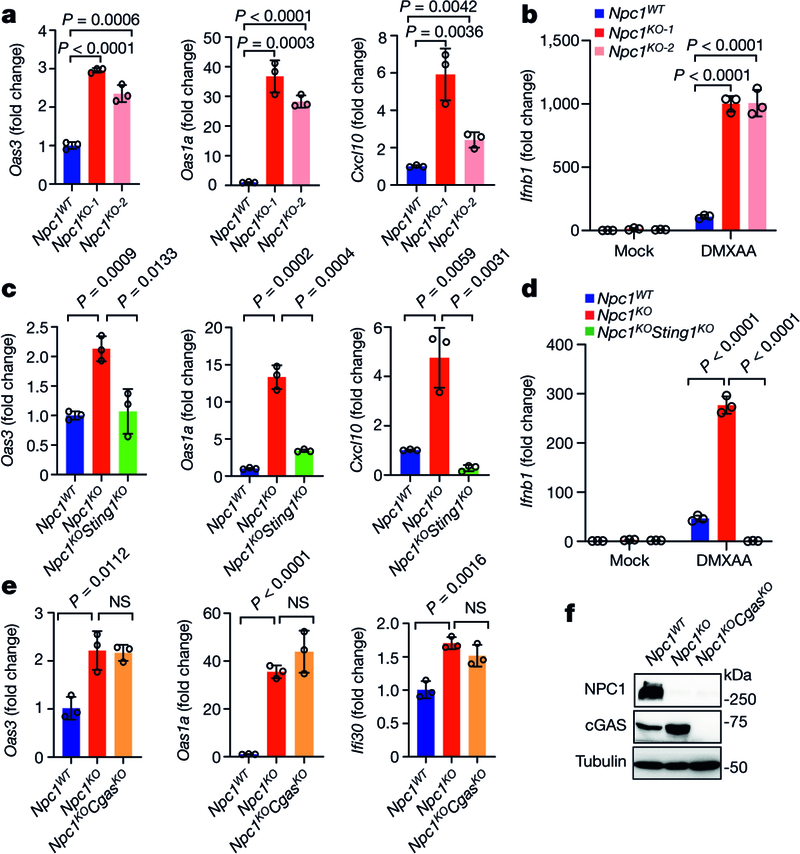
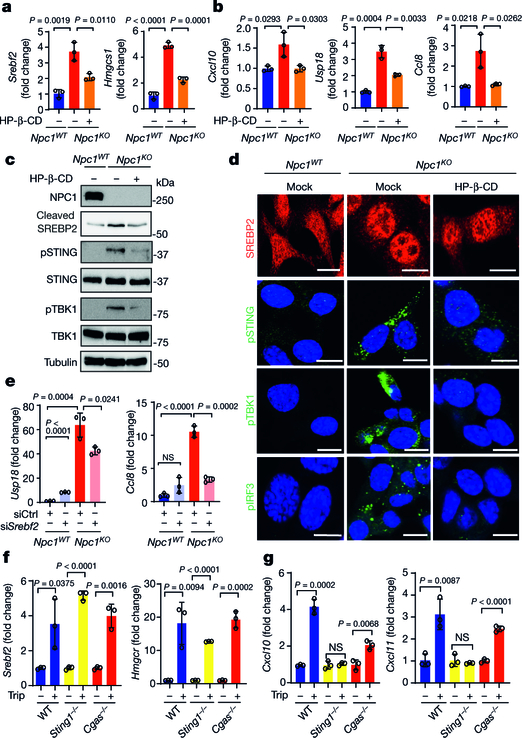
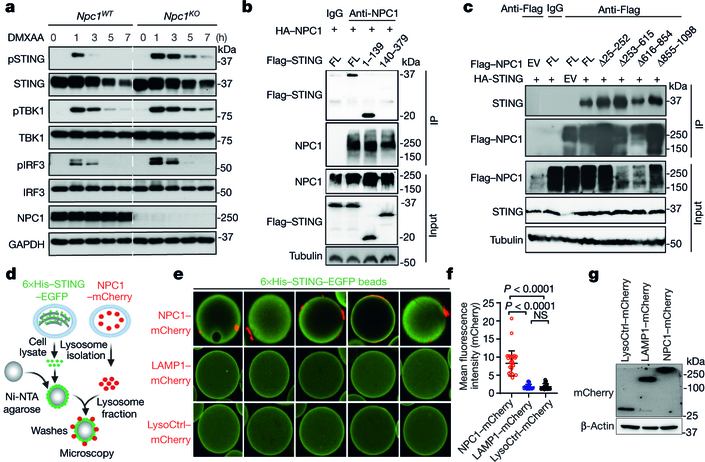
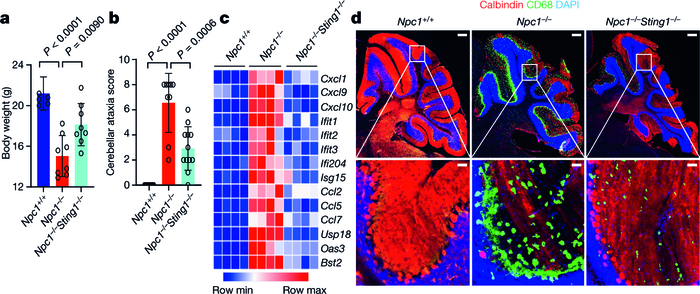
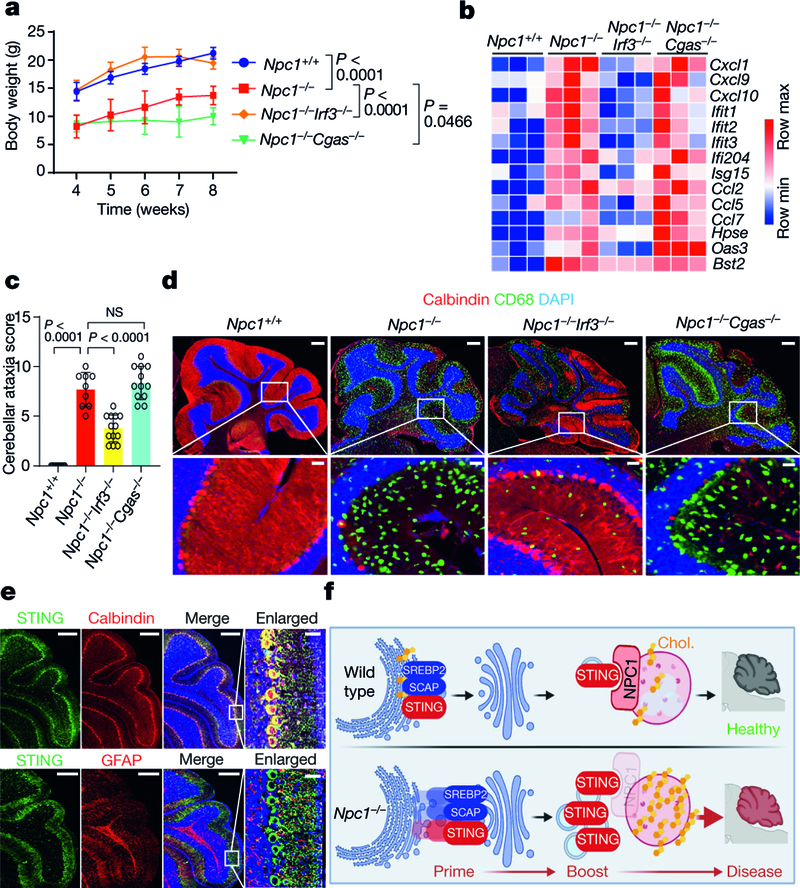
The classic mode of STING activation is through binding the cyclic dinucleotide 2'3'-cyclic GMP-AMP (cGAMP), produced by the DNA sensor cyclic GMP-AMP synthase (cGAS), which is important for the innate immune response to microbial infection and autoimmune disease. Modes of STING activation that are independent of cGAS are much less well understood. Here, through a spatiotemporally resolved proximity labelling screen followed by quantitative proteomics, we identify the lysosomal membrane protein Niemann-Pick type C1 (NPC1) as a cofactor in the trafficking of STING. NPC1 interacts with STING and recruits it to the lysosome for degradation in both human and mouse cells. Notably, we find that knockout of Npc1 'primes' STING signalling by physically linking or 'tethering' STING to SREBP2 trafficking. Loss of NPC1 protein also 'boosts' STING signalling by blocking lysosomal degradation. Both priming and boosting of STING signalling are required for severe neurological disease in the Npc1-/- mouse. Genetic deletion of Sting1 (the gene that encodes STING) or Irf3, but not that of Cgas, significantly reduced the activation of microglia and relieved the loss of Purkinje neurons in the cerebellum of Npc1-/- mice, leading to improved motor function. Our study identifies a cGAS- and cGAMP-independent mode of STING activation that affects neuropathology and provides a therapeutic target for the treatment of Niemann-Pick disease type C.


Conflict of interest statement

Competing interests The authors declare no competing interests.

Figures

Extended Data Fig. 1 |
Extended Data Fig. 1 |. Screen of STING trafficking cofactors using spatiotemporally resolved proximity labelling and quantitative proteomics.
a, Diagram for proximity labelling and proteomic discovery of trafficking cofactors using Sting1−/− MEFs stably expressing STING–APEX2. b, Representative microscopy images of STING–APEX2 trafficking at various time points after stimulation (HT-DNA, 1 μg ml−1). BFA blocks the exit of STING from the ER; BafA1 blocks the degradation of STING by lysosomes. Scale bars, 10 μm. c, Immunoblot analysis of cell lysates. STING–APEX2 MEFs were mock-treated or stimulated with HT-DNA (1 μg ml−1) for the indicated times with or without treatment with BFA or BafA1 (top). Then, proximity labelling was performed and biotinylated proteins were detected by streptavidin–HRP. Immunoblot is representative of at least three independent experiments. d, TMT-MS quantitative proteomics data filtering from two independent experiments and candidate discovery. e, Diagram of the STING trafficking route after stimulation, including time points (top) and organelles. f, Heat map showing selected STING trafficking cofactor candidates at each organelle (top). MS value was normalized to the 0-h time point. Data are representative of three independent experiments.
Extended Data Fig. 2 |
Extended Data Fig. 2 |. NPC1 deficiency primes STING trafficking and activation independently of cGAMP.
a, qRT–PCR analysis of the baseline expression of ISGs (Oas3, Oas1a and Usp18) in Npc1WT, Npc1KO and Npc1KO MEFs stably expressing wild-type Npc1 (n = 4). b, qRT–PCR analysis of Ifnb1 mRNA expression in wild-type and Npc1-knockdown MEFs after stimulation with an increasing amount of Poly I:C (0, 1, 2, 4 μg ml−1) for 3 h (n = 3). c, Immunoblot analysis of the indicated proteins (left) in Npc1WT, Npc1KO and Npc1KOSting1KO MEFs. d, Heat map showing the baseline expression of ISGs in Npc1WT, Npc1KO and Npc1KOSting1KO MEFs reconstituted with vector, STING wild type (FL), R232A or S366A mutants (n = 2). The mRNA expression of each ISG was measured by qRT–PCR. e, Immunoblot analysis of the indicated proteins (left) in different reconstituted MEFs (shown on top) as in d. f, Fluorescent microscopy analysis of endogenous STING localization at the resting state in Npc1WT and two independent clones of Npc1KO MEFs. Endogenous STING is shown in green, an ERGIC marker (ERGIC53) is shown in red and DAPI is shown in blue. Scale bars, 10 μm. g, Quantification of STING co-localization with the ERGIC in f (Npc1WT, n = 13; Npc1KO-1, n = 12; Npc1KO-2, n = 13). h, qRT–PCR analysis of the baseline expression of ISGs in fibroblasts from healthy control individuals (n = 2) and unrelated patients with Niemann–Pick disease type C (NPC1I1061T) (n = 4). a, b, g, Data are mean ± s.d. a, g, Unpaired two-tailed Student’s t-test. Data are representative of at least two independent experiments.
Extended Data Fig. 3 |
Extended Data Fig. 3 |. SREBP2 trafficking primes STING signalling in Npc1KO cells independently of its transcriptional activity.
a, Diagram showing mechanisms of action for HP-β-CD and triparanol on cholesterol synthesis and SREBP2 activation. HP-β-CD promotes the egress of lysosomal cholesterol to the ER, thus limiting SREBP2 trafficking and activation in Npc1KO cells. Triparanol inhibits the biochemical conversion of desmosterol into cholesterol, thus promoting SREBP2 trafficking and activation in wild-type cells. b, c, qRT–PCR analysis of cholesterol-synthesis genes (b) and ISGs (c) in Npc1WT and Npc1KO MEFs mock-treated or treated with HP-β-CD (0.3 mM) overnight (n = 3). d, e, qRT–PCR analysis of mock-, DMXAA- (50 μg ml−1, 2 h) or poly(I:C)- (1 μg ml−1, 2 h) induced expression of cholesterol-synthesis genes (d) and ISGs (e) with mock- or HP-β-CD treatment (0.3 mM, 8 h) in Npc1WT MEFs (n = 3). f, qRT–PCR analysis of the baseline expression of ISGs in Npc1WT and Npc1KO MEFs transfected with siCtrl or siSrebf2 for 48 h (n = 3). g, Immunoblot analysis of the indicated proteins (left) in Npc1WT, Npc1KO, Npc1KOSrebf2KD and Npc1KOSrebf2KD MEFs reconstituted with SREBP2 wild type (FL) or transcription-inactive mutants (L511A/S512A, ΔbHLH). h, i, qRT–PCR analysis of the expression of cholesterol-synthesis genes (h) and ISGs (i) in Npc1WT, Npc1KO, Npc1KOSrebf2KD and Npc1KOSrebf2KD MEFs reconstituted with SREBP2 wild type (FL) or transcription-inactive mutants (L511A/S512A, ΔbHLH) (n = 3). bf, h, i, Data are mean ± s.d. Unpaired two-tailed Student’s t-test. NS, not significant. Data are representative of at least two independent experiments.
Extended Data Fig. 4 |
Extended Data Fig. 4 |. SREBP2 primes STING signalling independently of cGAS or MAVS.
a, Immunoblot analysis of the SREBP2 and STING activation in Npc1WT MEFs that were treated with mock or triparanol (14 μM) for the indicated times (shown on the top). SREBP2 cleavage indicates activation. STING activation induces pSTING and pTBK1. b, Fluorescent microscopy analysis of SREBP2 and STING activation. Cleaved SREBP2 translocates to the nucleus (red). The STING activation markers pSTING, pTBK1 and pIRF3 are shown in green. The nucleus dye DAPI is shown in blue. Scale bars, 10 μm. c, qRT–PCR analysis of cholesterol-synthesis genes in BMDMs that were either mock-treated or treated with triparanol (14 μM) for 12 h (n = 3). d, qRT–PCR analysis of the baseline expression of ISGs in BMDMs that were either mock-treated or treated with triparanol (14 μM) alone or in combination with the STING inhibitor C-176 (0.5 μM) for 12 h (n = 3). e, f, qRT–PCR analysis of cholesterol-synthesis genes (e) and ISGs (f) in wild-type, Sting1−/− and Cgas−/− BMDMs that were either mock-treated or treated with triparanol (14 μM) for 12 h (n = 3). g, h, qRT–PCR analysis of the expression of cholesterol-synthesis genes (g) and ISGs (h) in Mavs−/− MEFs that were either mock-treated or treated with triparanol (14 μM) for 12 h (n = 3). i, j, qRT–PCR analysis of the cholesterol-synthesis gene Hmgcs1, knockdown efficiency of Insig1 (i) and the expression of ISGs (j) in wild-type, Cgas−/− and Sting1−/− MEFs (n = 3). cj, Data are mean ± s.d. Unpaired two-tailed Student’s t-test. Data are representative of at least two independent experiments.
Extended Data Fig. 5 |
Extended Data Fig. 5 |. NPC1 interacts with STING and mediates the lysosomal degradation of STING.
a, Quantification of immunoblots in Fig. 3a. b, Immunoblot analysis of STING degradation in Npc1WT, Npc1KO or Npc1KO MEFs stably expressing wild-type NPC1. Cells were mock-treated or stimulated with HT-DNA (1 μg ml−1) for 8 h. c, d, Live-cell microscopy images of STING–EGFP and lysosomes. Npc1WT and Npc1KO MEFs stably expressing STING–EGFP were mock-treated (left) or stimulated with HT-DNA (right, 4 μg ml–1). STING–EGFP is shown in green and LysoTracker-Red is shown in red. Scale bar, 10 μm. Representative images in c and quantifications in d. Npc1WT 0 h (n = 13), Npc1KO 0 h (n = 17), Npc1WT 15 h (n = 15), and Npc1KO 15 h (n = 16) for quantification. Data are mean ± s.d. Unpaired two-tailed Student’s t-test. e, Immunoblot analysis of NPC1 and STING co-immunoprecipitation in HEK293T cells. HEK293T cells were transfected with the indicated plasmids (top), and 24 h later, anti-IgG (mouse) or anti-Flag was used for the pull-down. HA–STING co-immunoprecipitation was analysed by anti-STING immunoblot. Whole-cell lysates were blotted by anti-Flag (NPC1), anti-STING and anti-tubulin as input. f, Immunoblot analysis of endogenous STING and NPC1 co-immunoprecipitation in wild-type MEFs. Anti-IgG (rabbit) or anti-NPC1 (rabbit) was used for the pull-down. Both immunoprecipitation and lysate were blotted for endogenous STING (rabbit), NPC1 (mouse) and tubulin. g, Immunoblot analysis of endogenous STING and NPC1 co-immunoprecipitation in wild-type MEFs with mock-treated, DMXAA (30 μg ml−1, 8 h)-treated or DMXAA combined with BafA1-treated (to prevent STING degradation). Anti-IgG (rabbit) or Anti-NPC1 (rabbit) was used for the pull-down. Both immunoprecipitation and lysate input were blotted for endogenous STING (rabbit) and NPC1 (mouse). h, Immunoblot analysis of endogenous STING interaction with NPC1 or LAMP1 in wild-type MEFs. Anti-IgG (rabbit) or anti-STING (rabbit) was used for the pull-down. Both immunoprecipitation and lysate input were blotted for endogenous STING, NPC1 or LAMP1. Red arrow, co-immunoprecipitated NPC1 band. i, Live-cell fluorescent microscopy analysis of STING–EGFP and NPC1–mCherry localization. Npc1KOSting1KO MEFs stably expressing STING–EGFP (green) and NPC1–mCherry (red) were stimulated with HT-DNA (4 μg ml−1) and imaged at the indicated times. Scale bars, 10 μm. j, k, Diagrams showing STING (j) and NPC1 (k) full length and truncations. l, Immunoblot analysis of STING degradation in Npc1WT, Npc1KO or Npc1KO MEFs stably expressing indicated NPC1 truncations. Cells were mock-treated or stimulated with HT-DNA (1 μg ml−1) for 8 h. Cell lysates were analysed for the proteins indicated on the left. m, Immunoblot analysis of STING interaction with NPC1 transmembrane bundles in HEK293T cells. HEK293T cells were transfected with the indicated plasmids (top), and 24 h later, anti-IgG (mouse) or anti-Flag (mouse) was used for the pull-down. Both immunoprecipitation and whole-cell lysates were analysed by anti-Flag (NPC1), anti-STING and anti-tubulin. Data are representative of at least two independent experiments.
Extended Data Fig. 6 |
Extended Data Fig. 6 |. STING drives neuroinflammation in Npc1−/− mice.
a, Immunoblot analysis of the indicated proteins (left) in whole-brain lysates from BALB/c Npc1+/+, Npc1−/− and Npc1−/−Sting1−/− mice (n = 2). b, qRT–PCR analysis of the expression of ISGs in the cerebellum of BALB/c Npc1+/+, Npc1−/− and Npc1−/−Sting1−/− mice (n = 4). c, Heat map showing the expression of ISGs in BMDMs from BALB/c Npc1+/+, Npc1−/− and Npc1−/−Sting1−/− mice (n = 3). The mRNA expression level of each ISG was measured by qRT–PCR. b, Data are mean ± s.d. Unpaired two-tailed Student’s t-test. Data are representative of at least two independent experiments.
Extended Data Fig. 7 |
Extended Data Fig. 7 |. STING and IRF3, but not cGAS, are required for Npc1−/− disease pathogenesis.
a, Representative image for the body size of eight-week-old mice. b, Immunoblot analysis of proteins (left) in whole-brain lysates of mice of the indicated genotypes (C57BL/6J; n = 3). c, Heat map showing the expression of ISGs in BMDMs from mice of the indicated genotypes (C57BL/6J; n = 3). The mRNA expression level of each ISG was measured by qRT–PCR. d, Serum cytokine levels in four-week-old mice of the indicated genotypes measured by multiplex ELISA (n = 4). e, Heat map showing the expression of ISGs in Npc1+/+ and Npc1−/− BMDMs that were mock-treated or treated with the STING inhibitor C-176 (0.5 μM) or C-178 (0.5 μM) overnight (n = 2). The mRNA expression of each ISG was measured by qRT–PCR. d, Data are mean ± s.d. Unpaired two-tailed Student’s t-test. Data are representative of at least two independent experiments.
Extended Data Fig. 8 |
Extended Data Fig. 8 |. STING function in Purkinje cells and microglia.
a, Progression of Npc1−/− neuropathology. Fluorescent IHC staining of mouse cerebellum of Npc1+/+ and Npc1−/− mice at P7, four weeks old and eight weeks old. Calbindin is shown in red, CD68 is shown in green and DAPI is shown in blue. Representative images are shown (n = 3). Bottom panels are enlarged views. Scale bars, 200 μm (top); 30 μm (bottom). b, STING antibody validation for IHC. Fluorescent IHC staining with IgG (rabbit), anti-STING (rabbit) in wild-type C57BL/6J cerebellum or staining with anti-STING (rabbit) in Sting1−/− C57BL/6J cerebellum. Scale bars, 30 μm. Representative images are shown (n = 3). c, Heat map showing the baseline expression of ISGs in ex-vivo-cultured microglia isolated from P10–P12 mouse brains of the indicated genotypes (n = 3). The mRNA expression of each ISG was measured by qRT–PCR. Representative microscopy images of isolated microglia from indicated genotype of mice are shown at the bottom. Scale bars, 30 μm.
Extended Data Fig. 9 |
Extended Data Fig. 9 |. STING signalling activation in Npc1−/− and Npc2−/− cells and mice.
a, Immunoblot analysis of proteins (left) in whole-brain lysates of BALB/c mice of the indicated genotypes (n = 3). b, qRT–PCR analysis of cholesterol-synthesis gene (Hmgcr) expression in the cerebellums of mice of the indicated genotypes (BALB/c) (n = 3). c, Heat map showing the expression of ISGs in BALB/c Npc1+/+, Npc1−/− and Npc2−/− mouse cerebellum (n = 3). The mRNA expression of each ISG was measured by qRT–PCR. d, qRT–PCR analysis of the expression of some ISGs in the cerebellum of mice of the indicated genotypes (BALB/c) (n = 3). e, Immunoblot analysis of the STING signalling cascade. BALB/c Npc1+/+, Npc1−/− and Npc2−/− mouse BMDMs were stimulated with DMXAA (50 μg ml−1) for 0, 2 or 4 h. Phosphorylated and total proteins blotted are shown on the left. f, qRT–PCR analysis of the baseline expression of ISGs in Npc2WT, Npc2KD and Npc2KDSting1KD MEFs (n = 3). g, qRT–PCR analysis of the baseline expression of ISGs in BALB/c Npc2+/+ and Npc2−/− mouse BMDMs that were mock-treated or treated with STING inhibitor C-176 (0.5 μM) overnight (n = 3). b, d, f, g, Data are mean ± s.d. Unpaired two-tailed Student’s t-test. Data are representative of at least two independent experiments.
Fig. 1
Fig. 1. NPC1 deficiency chronically activates STING-mediated type I IFN signalling independently of cGAS
a, c, Quantitative PCR with reverse transcription (qRT–PCR) analysis of the mRNA expression of resting-state ISGs (Oas3, Oas1a and Cxcl10) in Npc1WT and two independent Npc1KO MEF cell lines (a) or in Npc1WT, Npc1KO and Npc1KOSting1KO MEFs (c) (n = 3). b, d, qRT–PCR analysis of Ifnb1 mRNA expression in Npc1WT and two independent Npc1KO MEF cell lines (b) or in Npc1WT, Npc1KO and Npc1KOSting1KO MEFs (d) after stimulation with the STING agonist DMXAA (50 μg ml-1) for 2 h (n = 3). e, qRT–PCR analysis of the baseline mRNA expression of ISGs (Oas3, Oas1a, Ifi30) in Npc1WT, Npc1KO and Npc1KOCgasKO MEFs (n = 3). f, Immunoblot analysis of the indicated proteins in Npc1WT, Npc1KO and Npc1KOCgasKO MEFs. ae, Data are mean ± s.d. a, c, e, Unpaired two-tailed Student’s t-test. b, d, Two-way ANOVA. NS, not significant. Data are representative of at least three independent experiments.
Fig. 2
Fig. 2. SREBP2 trafficking primes STING trafficking and activation in Npc1-deficient cells
a, b, qRT–PCR analysis of SREBP2 and STING activation. SREBP2 activation induces cholesterol-synthesis genes (a; Srebf2 and Hmgcs1) and STING activation induces ISGs (b; Cxcl10, Usp18 and Ccl8). Npc1WT and Npc1KO MEFs were mock-treated or treated with HP-β-CD (0.3 mM) overnight (n = 3). c, Immunoblot analysis of SREBP2 and STING activation. SREBP2 cleavage indicates activation. STING activation induces pSTING and pTBK1. d, Fluorescent microscopy analysis of SREBP2 and STING activation. Cleaved SREBP2 translocates to the nucleus (red). The STING activation markers pSTING, pTBK1 and pIRF3 are shown in green. The nucleus dye DAPI is shown in blue. Scale bars, 10 μm. e, STING activation in Npc1KO cells requires SREBP2. qRT–PCR analysis of ISG expression in Npc1WT and Npc1KO MEFs transfected with control siRNA (siCtrl) or siSrebf2 for 48 h (n = 3). f, g, qRT–PCR analysis of cholesterol-synthesis genes (f) and ISGs (g) in wild-type, Sting1−/− and Cgas−/−BMDMs that were mock-treated or treated with triparanol (Trip, 14 μM) for 12 h (n = 3). a, b, eg, Data are mean ± s.d. Unpaired two-tailed Student’s t-test. Data are representative of at least two independent experiments.
Fig. 3
Fig. 3. NPC1 is a lysosomal adaptor that mediates STING degradation.
a, Immunoblot analysis of the STING signalling cascade. Npc1WT and Npc1KO MEFs were stimulated with the STING agonist DMXAA (30 μg ml−1) for 0, 1, 3, 5 or 7 h. The total and phosphorylated proteins immunoblotted are identified on the left. b, c, STING and NPC1 interaction domain mapping. HEK293T cells were transfected with the indicated plasmids (top), and 24 h later, the indicated antibodies were used for the pull-down. b, Full-length (FL) HA–NPC1 co-immunoprecipitated with Flag–STING truncated variants. c, Full-length HA–STING co-immunoprecipitated with Flag–NPC1 truncated variants. EV, empty vector; IP, immunoprecipitation. dg, Cell-free lysosome recruitment assay. d, Diagram of the assay. e, Representative images of 6×His–STING–EGFP beads incubated with LysoCtrl–mCherry-, LAMP1–mCherry- and NPC1-mCherry-labelled lysosomes. f, Quantification of the recruitment of lysosomes to 6×His–STING–EGFP beads. For quantification, NPC1–mCherry, n = 33 beads; LAMP1–mCherry, n = 20 beads; LysoCtrl–mCherry, n = 20 beads. Data are mean ± s.d. Unpaired two-tailed Student’s t-test. g, Immunoblot analysis of the indicated proteins in different MEFs. Data are representative of at least two independent experiments.
Fig. 4
Fig. 4. STING drives neuroinflammation and neuropathology in Npc1−/−mice
a, Body weight of mice of the indicated genotypes (8 weeks old). All mice are on the BALB/c background (Npc+/+ mice, n = 5; Npc−/− mice, n = 8; Npc1−/−Sting1−/− mice, n = 8). b, Cerebellar ataxia scores for BALB/c mice of the indicated genotypes (8 weeks old). Mice were scored 0–12, which reflects a combination of four measurements (each 0–3): hindlimb clasping, ledge test, gait and kyphosis (Npc1+/+ mice, n = 10; Npc1−/− mice, n = 9; Npc1−/−Sting1−/− mice, n = 12). c, Heat map showing ISG expression in the cerebellum of mice of the indicated genotypes (8 weeks old). All mice are on the BALB/c background. The mRNA expression of each ISG was measured by qRT–PCR (n = 4). Min, minimum; max, maximum. d, Fluorescent IHC staining of the cerebellum of mice of the indicated genotypes (8 weeks old). All mice are on the BALB/c background. Calbindin (Purkinje neuron marker) is shown in red, CD68 (microglia activation marker) is shown in green and DAPI (nucleus marker) is shown in blue. Representative images are shown (n = 3). The bottom images are enlarged views. Scale bars, 200 μm (top); 30 μm (bottom).a, b, Data are mean ± s.d. Unpaired two-tailed Student’s t-test.
Fig. 5
Fig. 5. IRF3, but not cGAS, is required for disease pathogenesis in Npc1−/−mice
a, Body weight of mice of the indicated genotypes. All mice are on the C57BL/6J background (Npc1+/+ mice, n = 5; Npc1−/− mice, n = 10; Npc1−/−Irf3−/− mice, n = 10; Npc1−/−Cgas−/− mice, n = 10). b, Heat map showing ISG expression in the cerebellum of mice of the indicated genotypes (n = 3; 8 weeks old). The mRNA expression of each ISG was measured by qRT–PCR. c, Cerebellar ataxia scores of mice of the indicated genotypes (8 weeks old). All mice are on the C57BL/6J background. Mice were scored as in Fig. 4b (Npc1+/+ mice, n = 9; Npc1−/− mice, n = 9; Npc1−/−Irf3−/− mice, n = 13; Npc1−/−Cgas−/− mice, n = 12). d, Fluorescent IHC staining of the cerebellum of mice (C57BL/6J) of the indicated genotypes. Calbindin is shown in red, CD68 is shown in green and DAPI is shown in blue. Representative images are shown (n = 3). The bottom images are enlarged views. Scale bars, 200 μm (top); 30 μm (bottom). e, Fluorescent IHC co-staining of neural markers with STING in the cerebellum of wild-type mice (C57BL/6J; 4 weeks old). Top, STING is shown in green and calbindin (Purkinje cell marker) is shown in red. Bottom, STING is shown in green and GFAP (astrocyte marker) is shown in red. DAPI is shown in blue. Representative images are shown (n = 3). Scale bars, 200 μm (main panels); 30 μm (enlarged views; far right). f, Graphical abstract of the study. Chol., cholesterol. a, c, Data are mean ± s.d. a, Two-way ANOVA. c, Unpaired two-tailed Student’s t-test.

References

    1. Chin AC Neuroinflammation and the cGAS–STING pathway.J. Neurophysiol 121, 1087–1091 (2019). - PubMed
    1. Yan N Immune diseases associated with TREX1 and STING dysfunction.J.Interferon Cytokine Res. 37, 198–206 (2017). - PMC - PubMed
    1. Sliter DA et al.Parkin and PINK1 mitigate STING-induced inflammation.Nature 561, 258–262 (2018). - PMC - PubMed
    1. Yang K,Huang R, Fujihira H,Suzuki T&Yan N N-glycanase NGLY1 regulates mitochondrial homeostasis and inflammation through NRF1. J. Exp. Med. 215, 2600–2616 (2018). - PMC - PubMed
    1. Yu C-H et al.TDP-43 triggers mitochondrial DNA release via mPTP to activate cGAS/STING in ALS. Cell 183, 636–649 (2020). - PMC - PubMed

Publication types

MeSH terms

Substances