. 2021 Jun 2;1(1):ltab011.
doi: 10.1093/immadv/ltab011. eCollection 2021 Jan.

Type 2 immunity is maintained during cancer-associated adipose tissue wasting

Affiliations

Type 2 immunity is maintained during cancer-associated adipose tissue wasting

Patrick J Lenehan et al. Immunother Adv. .

Abstract

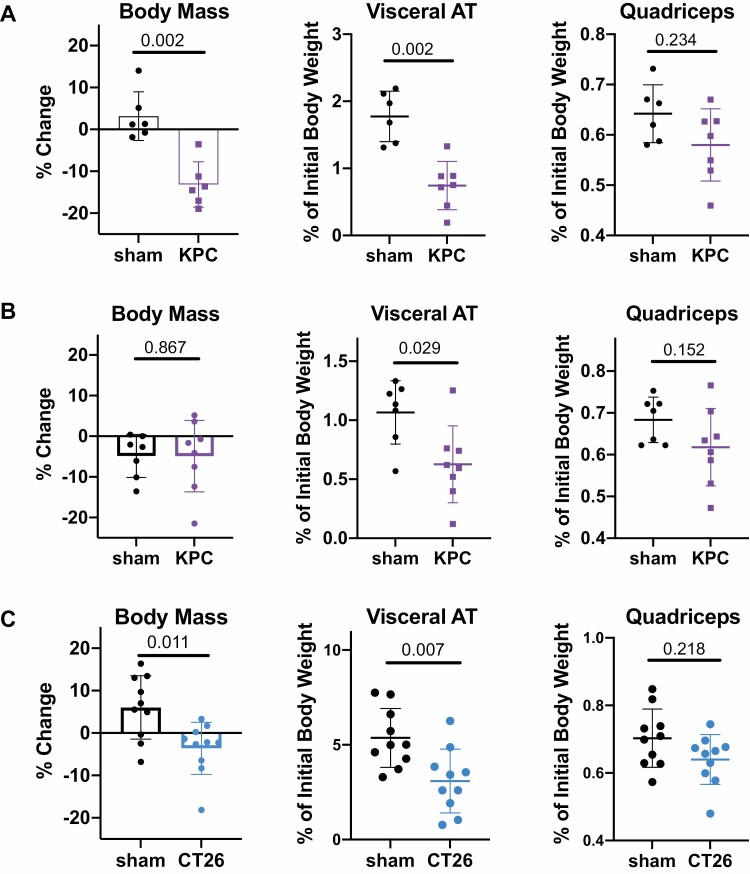
Objectives: Cachexia is a systemic metabolic disorder characterized by loss of fat and muscle mass, which disproportionately impacts patients with gastrointestinal malignancies such as pancreatic cancer. While the immunologic shifts contributing to the development of other adipose tissue (AT) pathologies such as obesity have been well described, the immune microenvironment has not been studied in the context of cachexia.

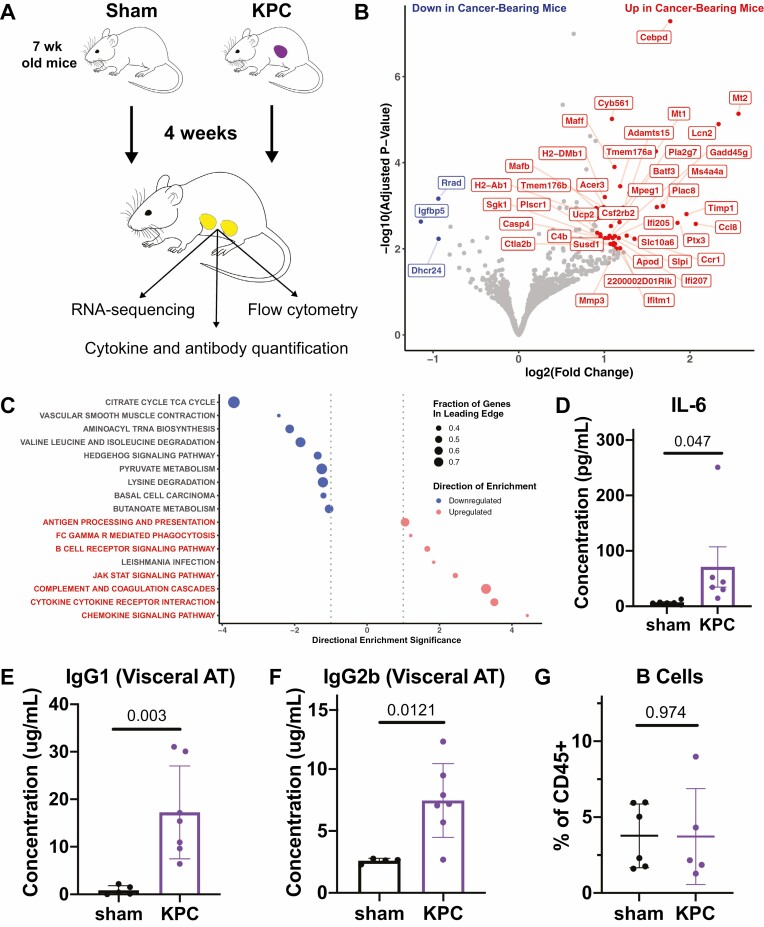
Methods: We performed bulk RNA-sequencing, cytokine arrays, and flow cytometry to characterize the immune landscape of visceral AT (VAT) in the setting of pancreatic and colorectal cancers.

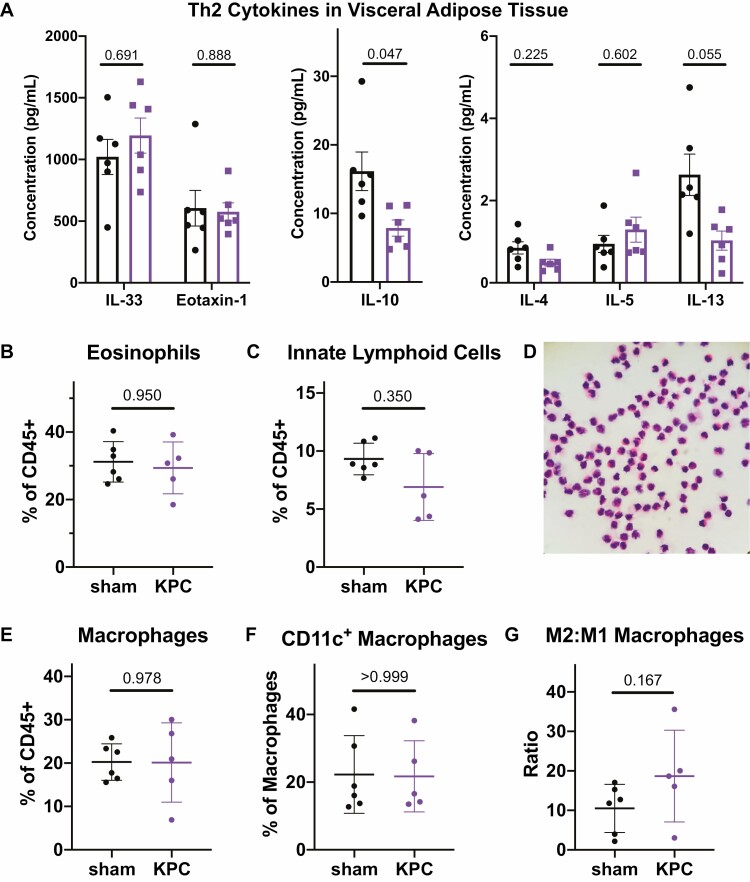
Results: The cachexia inducing factor IL-6 is strongly elevated in the wasting VAT of cancer bearing mice, but the regulatory type 2 immune landscape which characterizes healthy VAT is maintained. Pathologic skewing toward Th1 and Th17 inflammation is absent. Similarly, the VAT of patients with colorectal cancer is characterized by a Th2 signature with abundant IL-33 and eotaxin-2, albeit also with high levels of IL-6.

Conclusions: Wasting AT during the development of cachexia may not undergo drastic changes in immune composition like those seen in obese AT. Our approach provides a framework for future immunologic analyses of cancer associated cachexia.

Keywords: adipose tissue; cachexia; pancreatic cancer.


Figures

Graphical Abstract
Graphical Abstract
Figure 1.
Figure 1.
Models of cancer associated cachexia and adipose tissue wasting. Summary of changes in body mass, visceral adipose tissue (AT) mass, and quadriceps muscle mass in three tested models of CAC. (A) 50,000 KPC cells were mixed with Matrigel and surgically implanted into the pancreas of 20-week-old female C57BL/6J mice versus sham surgery. Body weight was monitored over time, and mice were harvested 28 days post-surgery. (B) Orthotopic KPC tumors were implanted as in panel (A) into 7-week old female C57BL/6J recipient mice versus sham surgery. Net body weight, adipose and muscle weights were determined at 28 days post-surgery. (C) PBS (‘sham’) or 250,000 CT26 cells (‘CT26’) were implanted subcutaneously in 7-week-old female Balb/c mice. Net body weight, adipose and muscle weights were determined at 21 days post-implantation. Statistical analyses were performed using the Mann–Whitney test; mean ± SD is shown.
Figure 2.
Figure 2.
Immune-related transcripts and proteins are upregulated in adipose tissue in the setting of cancer. (A) Schematic describing the approach to assessing immunologic changes in VAT in cancer bearing mice. Note that RNA-sequencing and cytokine quantification were performed using VAT samples from the same mice, while flow cytometry and antibody quantification were performed using VAT samples from two separate experiments. Mice were 7 weeks old at the time of tumor inoculation. (B) Volcano plot highlighting genes which are most strongly upregulated (subset shown in red) and downregulated (subset shown in blue) in VAT of cancer bearing mice compared to that of sham-operated mice. (C) Bubble plot showing KEGG pathways enriched based on RNA-sequencing data depicted in (B). Immune-related pathways that are upregulated are highlighted in red. (D) IL-6 quantification by cytokine array shows elevation in VAT of cancer bearing mice. (E–F) Quantification of total IgG1 (E) and IgG2b (F) by ELISA in VAT of cancer bearing and sham-operated mice. (G) Quantification of B cells as a fraction of total CD45+ cells in VAT by flow cytometry. Statistical analyses were performed using the Mann–Whitney test; mean ± SD is shown.
Figure 3.
Figure 3.
Th1 inflammation is not evident in the adipose tissue of cancer bearing mice. (A–B) Gene set enrichment plots depicting the upregulation of both IFNγ (A) and IFNα/β (B) signaling pathways in VAT of cancer bearing mice. (C) Heatmap depicting sample-level expression of genes in the IFNγ signaling pathway which are most strongly upregulated in the VAT of cancer bearing mice. (D–H) Cytokine array quantifications of Th1-related cytokines including IFNγ (D), TNFα (E), IL-2 (F), CXCL9 (G), and CXCL10 (H). (I-J) Quantification of cell types by flow cytometry, including CD8+ T cells (I) and CD11c+ dendritic cells (J). Statistical analyses were performed using the Mann–Whitney test; mean ± SD is shown.
Figure 4.
Figure 4.
PD-L1 expression in adipose tissue is regulated by IFNγ but is not increased in the setting of cancer. (A) Immunoblot depicting the expression of brown fat marker uncoupling protein 1 (UCP1), PD-L1, and beta actin in the whole tissue lysate (‘whole’) and stromovascular fraction (‘SVF’) of brown adipose tissue (BAT) and visceral adipose tissue (VAT). Samples were taken from Pdl1+/- (‘WT’) and Pdl1-/- (‘KO’) mice. The band corresponding to PD-L1 is indicated with arrows. (B-C) Western blot depicting the expression of PD-L1 and beta actin in VAT (B) and BAT (C) isolated 24 hours after the systemic administration of PBS, 1B7, B3-IFNγ, or 1B7-IFNγ. (D-E) RT-qPCR analysis depicting the expression of Irf1 and Pdl1 in the VAT (D) and BAT (E) isolated 24 hours after the systemic administration of PBS, 1B7, B3-IFNγ, or 1B7-IFNγ. The normalized expression ratio (NER) relative to the housekeeping gene beta-Actin is shown. (F) Comparison of Pdl1 expression by RNA-seq in VAT of sham-operated and KPC tumor-bearing mice. Values plotted are DESeq2-derived normalized expression values. The difference in Pdl1 expression between these groups was not statistically significant (P = 0.71). (G–H) Western blot depicting the expression of PD-L1 and beta actin in VAT (G) and BAT (H) of sham-operated and KPC tumor-bearing mice. Statistical analyses in (D) and (E) were performed using an ordinary two-way ANOVA with Dunnett’s multiple comparisons test; mean ± SD is shown. Immunoblot in (A) was blocked with 3% BSA in PBST, while subsequent PD-L1 blots were blocked with 5% BSA in PBST.
Figure 5.
Figure 5.
Th17 immunity is not increased in the adipose tissue of cancer bearing mice. (A) Cytokine array quantifications of Th17 cytokines in VAT of sham-operated and cancer bearing mice. Separate plots are shown for those with high, medium, and low concentrations to improve visualization. (B) Quantification of γδ T cells in VAT as a fraction of all CD45+ cells (left) and as a fraction of T cells (right) defined by CD3 expression. (C) Cytokine array quantification of CXCL1 (KC), the murine homologue of the human neutrophil chemoattractant IL-8. (D) Quantification of neutrophils in VAT as a fraction of all CD45+ cells. Statistical analyses were performed using the Mann–Whitney test; mean ± SD is shown.
Figure 6.
Figure 6.
Th2 immunity is maintained in adipose tissue of cancer bearing mice. (A) Cytokine array quantifications of Th2 cytokines in VAT of sham-operated and cancer bearing mice. Separate plots are shown for those with high, medium, and low concentrations to improve visualization. (B–C) Quantification of eosinophils (B) and innate lymphoid cells (C) as a fraction of total CD45+ cells in VAT by flow cytometry. (D) Hematoxylin and eosin staining of cytospin with sorted CD45+CD11b+SiglecF+ cells from VAT, confirming the eosinophil identity of the cell population defined by this gate in flow cytometry. (E) Quantification of macrophages (CD11b+F4/80hi) as a fraction of total CD45+ cells in VAT by flow cytometry. (F) Quantification of inflammatory CD11c+ macrophages in VAT as a fraction of total macrophages. (G) Ratio of M2 to M1 macrophages in VAT, where M1 phenotype is defined by CD11c expression. Statistical analyses were performed using the Mann–Whitney test; mean ± SD is shown.
Figure 7.
Figure 7.
Th2 immunity is present in the adipose tissue of human cancer patients. (A) Cytokine array shows high levels of IL-6, IL-33, and eotaxin-2 in VAT from humans with colorectal cancer (n = 5), with low levels of eotaxin-1, IFNγ, and TNFα detected. Mean ± SD is shown. (B–C) Flow cytometry of human VAT stromovascular fraction (SVF) captures eosinophil population defined by coexpression of CD45, CD15, and SIGLEC8 (B) or CD45, CD15, and CCR3 (C). Each panel corresponds to a unique patient. (D) Hematoxylin and eosin staining of whole SVF from human VAT identifies eosinophils among other tissue-resident immune cells.

Similar articles

Cited by

References

    1. Baracos VE, Martin L, Korc Met al. Cancer-associated cachexia. Nature Reviews Disease Primers 2018;4:17105. 10.1038/nrdp.2017.105 - DOI - PubMed
    1. Hendifar AE, Chang JI, Huang BZet al. Cachexia, and not obesity, prior to pancreatic cancer diagnosis worsens survival and is negated by chemotherapy. J Gastrointest Oncol 2018;99(1):17–23. 10.21037/jgo.2017.11.10 - DOI - PMC - PubMed
    1. Bachmann J, Büchler MW, Friess Het al. Cachexia in patients with chronic pancreatitis and pancreatic cancer: impact on survival and outcome. Nutr Cancer 2013;65(6):827–33. 10.1080/01635581.2013.804580 - DOI - PubMed
    1. Nemer L, Krishna SG, Shah ZKet al. Predictors of pancreatic cancer-associated weight loss and nutritional interventions. Pancreas 2017;46(9):1152–7. 10.1097/MPA.0000000000000898 - DOI - PMC - PubMed
    1. Argils JM, López-Soriano FJ, Stemmler Bet al. Therapeutic strategies against cancer cachexia. Eur J Transl Myol 2019;29(1):7960. 10.4081/ejtm.2019.7960 - DOI - PMC - PubMed